

The neuroanatomical organization of the hypothalamus is driven by spatial and topological efficiency
- PMID: 39165582
- PMCID: PMC11334159
- DOI: 10.3389/fnsys.2024.1417346
The neuroanatomical organization of the hypothalamus is driven by spatial and topological efficiency
Abstract
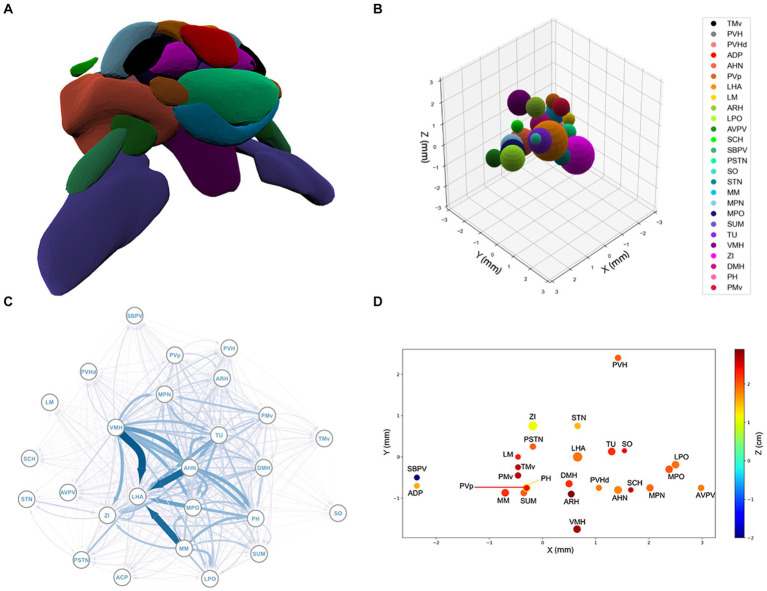
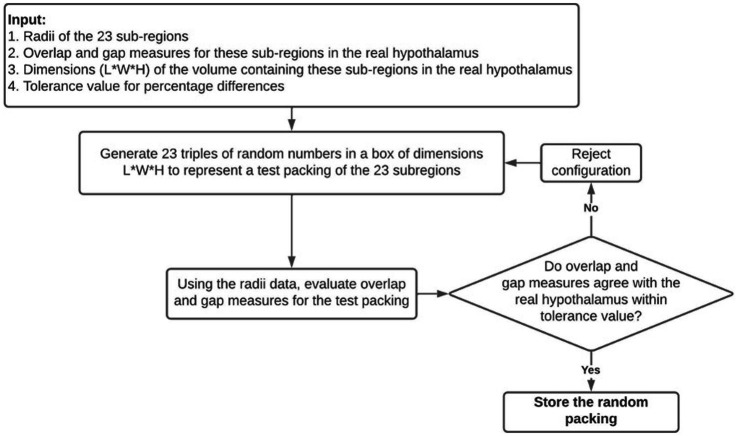
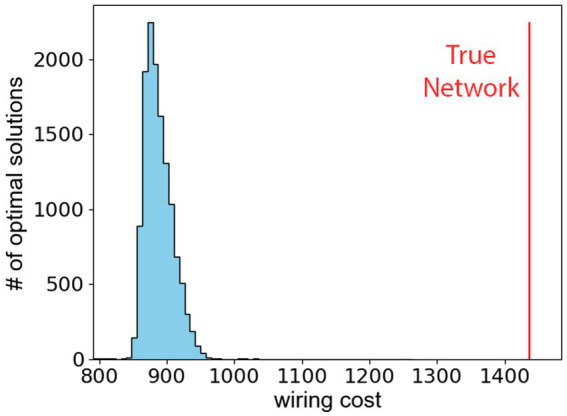
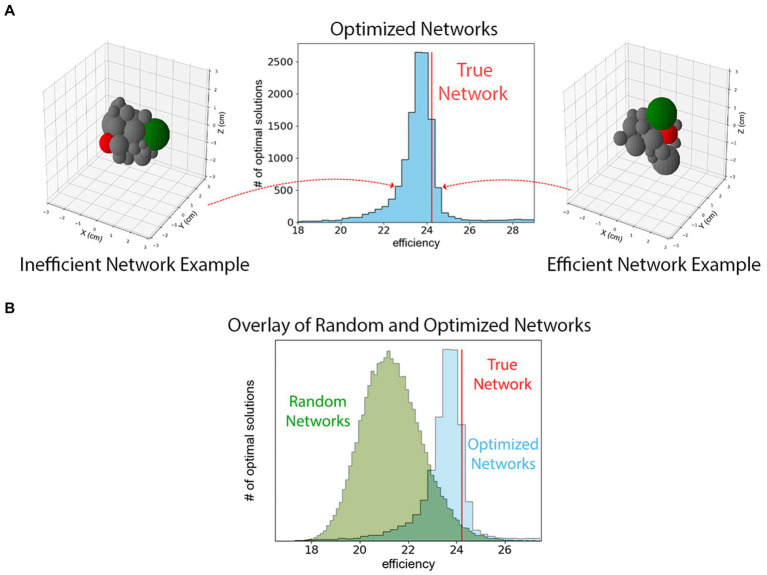
The hypothalamus in the mammalian brain is responsible for regulating functions associated with survival and reproduction representing a complex set of highly interconnected, yet anatomically and functionally distinct, sub-regions. It remains unclear what factors drive the spatial organization of sub-regions within the hypothalamus. One potential factor may be structural connectivity of the network that promotes efficient function with well-connected sub-regions placed closer together geometrically, i.e., the strongest axonal signal transferred through the shortest geometrical distance. To empirically test for such efficiency, we use hypothalamic data derived from the Allen Mouse Brain Connectivity Atlas, which provides a structural connectivity map of mouse brain regions derived from a series of viral tracing experiments. Using both cost function minimization and comparison with a weighted, sphere-packing ensemble, we demonstrate that the sum of the distances between hypothalamic sub-regions are not close to the minimum possible distance, consistent with prior whole brain studies. However, if such distances are weighted by the inverse of the magnitude of the connectivity, their sum is among the lowest possible values. Specifically, the hypothalamus appears within the top 94th percentile of neural efficiencies of randomly packed configurations and within one standard deviation of the median efficiency when packings are optimized for maximal neural efficiency. Our results, therefore, indicate that a combination of geometrical and topological constraints help govern the structure of the hypothalamus.
Keywords: Allen Brain Atlas; Monte - Carlo simulation; computational biology; connectivity; connectome; efficiency; graph theory - graph algorithms; hypothalamus.
Copyright © 2024 Smith, Ameen, Miller, Kasper, Schwarz, Hommel and Borzou.
Conflict of interest statement
The authors declare that the research was conducted in the absence of any commercial or financial relationships that could be construed as a potential conflict of interest.
Figures
References
-
- Allen Institute for Brain Science . Allen Mouse Brain Connectivity Atlas Technical White Paper: Overview. (2017). Available at: http://help.brain-map.org/download/attachments/2818171/Connectivity_Over...
-
- Bassett D. S., Greenfield D. L., Meyer-Lindenberg A., Weinberger D. R., Moore S. W., Bullmore E. T. (2010). Efficient physical embedding of topologically complex information processing networks in brains and computer circuits. PLoS Comput. Biol. 6:e1000748. doi: 10.1371/journal.pcbi.1000748, PMID: - DOI - PMC - PubMed
Grants and funding
LinkOut - more resources
Full Text Sources