. 2024 Aug 19;8(3):036110.
doi: 10.1063/5.0215273. eCollection 2024 Sep.

Iodinated gadolinium-gold nanomaterial as a multimodal contrast agent for cartilage tissue imaging

Affiliations

Iodinated gadolinium-gold nanomaterial as a multimodal contrast agent for cartilage tissue imaging

Cheng-Hsiu Lu et al. APL Bioeng. .

Abstract

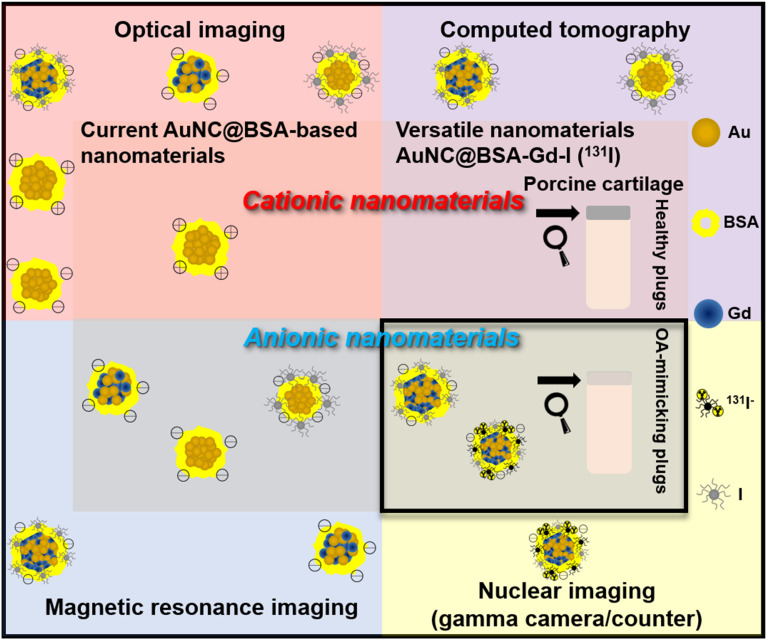
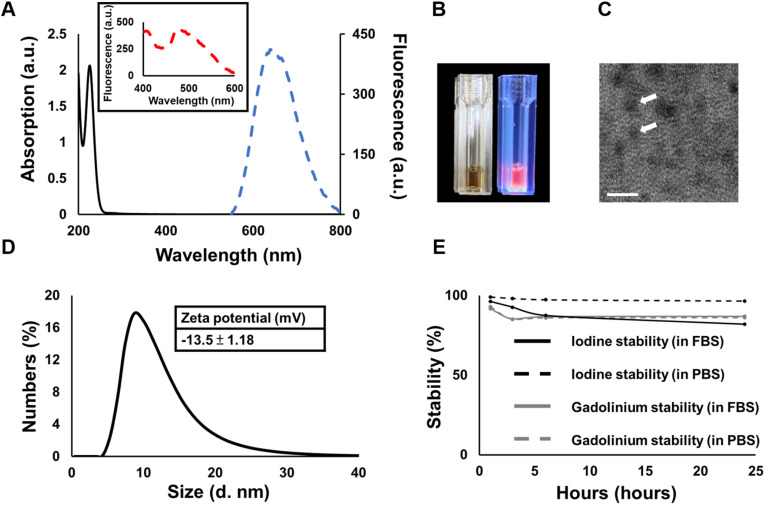
Cartilage damage, a common cause of osteoarthritis, requires medical imaging for accurate diagnosis of pathological changes. However, current instruments can acquire limited imaging information due to sensitivity and resolution issues. Therefore, multimodal imaging is considered an alternative strategy to provide valuable images and analyzes from different perspectives. Among all biomaterials, gold nanomaterials not only exhibit outstanding benefits as drug carriers, in vitro diagnostics, and radiosensitizers, but are also widely used as contrast agents, particularly for tumors. However, their potential for imaging cartilage damage is rarely discussed. In this study, we developed a versatile iodinated gadolinium-gold nanomaterial, AuNC@BSA-Gd-I, and its radiolabeled derivative, AuNC@BSA-Gd-131I, for cartilage detection. With its small size, negative charge, and multimodal capacities, the probe can penetrate damaged cartilage and be detected or visualized by computed tomography, MRI, IVIS, and gamma counter. Additionally, the multimodal imaging potential of AuNC@BSA-Gd-I was compared to current multifunctional gold nanomaterials containing similar components, including anionic AuNC@BSA, AuNC@BSA-I, and AuNC@BSA-Gd as well as cationic AuNC@CBSA. Due to their high atomic numbers and fluorescent emission, AuNC@BSA nanomaterials could provide fundamental multifunctionality for imaging. By further modifying AuNC@BSA with additional imaging materials, their application could be extended to various types of medical imaging instruments. Nonetheless, our findings showed that each of the current nanomaterials exhibited excellent abilities for imaging cartilage with their predominant imaging modalities, but their versatility was not comparable to that of AuNC@BSA-Gd-I. Thus, AuNC@BSA-Gd-I could be served as a valuable tool in multimodal imaging strategies for cartilage assessment.


Conflict of interest statement

The authors have no conflicts to disclose.

Figures

FIG. 1.
FIG. 1.
Schematic illustration comparing the versatility of AuNC@BSA-Gd-I for cartilage imaging and detection with current gold nanomaterials.
FIG. 2.
FIG. 2.
Characterization of AuNC@BSA-Gd-I. (a) The absorption values were merged with the fluorescent emission spectrum, and the inset figure displayed the spectrum of fluorescent excitation. Black line, UV-vis spectra; blue dotted line, emission spectra (λex = 470 nm); red dotted line, excitation spectra (λem = 640 nm). (b) The AuNC@BSA-Gd-I exhibited red fluorescence under UV light (365 nm). (c) The exact size and morphology of AuNC@BSA-Gd-I were observed using TEM. The scale bars are 5 nm. (d) The hydrodynamic radius of AuNC@BSA-Gd-I was recorded, and an inner table displayed the zeta potential. (e) Quantitative UV-vis spectrum and MRI analysis were employed to calculate the stability of iodine and gadolinium contained in AuNC@BSA-Gd-I when exposed to PBS or FBS for 1, 3, 6, and 24 h after modification.
FIG. 3.
FIG. 3.
MRI and CT imaging potential of AuNC@BSA-Gd-I for cartilage. (a) T1-weighted imaging was performed using AuNC@BSA-Gd-I, and (b) quantitative analysis was conducted at concentrations ranging from 0.625 to 5 mg/ml. (c) CT imaging of AuNC@BSA-Gd-I was conducted using 60 or 90 kVp, with concentrations ranging from 2.5 to 20 mg/ml. (d) Hounsfield Unit (HU) values for each concentration were recorded. (e) Cartilage tissue in papain solution was subjected to quantitative analysis at 9.4 T MRI 24 h post-incubation with AuNC@BSA-Gd-I. (f) Correlation of T1 relaxivity with sGAG content in cartilage. (g) CT imaging and analysis of cartilage plugs were performed at 60 or 90 kVp before and after 24 h of incubation with AuNC@BSA-Gd-I. (h) Correlation of attenuation in cartilage regions at 60 or 90 kVp with sGAG content in cartilage.
FIG. 4.
FIG. 4.
Exploration of optical imaging potential for cartilage tissue using AuNC@BSA-Gd-I nanomaterial. (a) Fluorescent images of AuNC@BSA-Gd-I were detected by the IVIS system at concentrations ranging from 2.5 to 20 mg/ml in FOV-C (12.9 cm) or FOV-B (6.5 cm). (b) Fluorescent signals of the cartilage plugs were acquired at 0 (before), 1, 4, 8, 12, and 24 h after incubation with AuNC@BSA-Gd-I. (c) Quantitative imaging analysis of AuNC@BSA-Gd-I at concentrations from 2.5 to 20 mg/ml. (d) Imaging intensity comparison of healthy and OA-mimicking cartilage at different time points following AuNC@BSA-Gd-I accumulation. (e) Establishment of a correlation between the sGAG content in cartilage and fluorescent intensity measured at 24 h.
FIG. 5.
FIG. 5.
The synthesis of AuNC@BSA-Gd-131I and its potential for assessing damaged cartilage were examined. (a) The radiochemical purity of sodium iodide (131I) and (b) AuNC@BSA-Gd-131I was analyzed using RP-TLC on a silica-gel-impregnated paraffin oil plate. (c) Calculating the radioactivity in both defective cartilage (N = 3) and healthy cartilage (N = 3). (d) Comparing the percentage of radioactivity within the cartilage portion of the entire plug between damaged (N = 3) and healthy cartilage (N = 3). Statistical differences in (c) were assessed using Welch's t-test, and in (d) using the pooled t-test. Data are presented as mean ± SD (**p < 0.01) or not significant (ns).
FIG. 6.
FIG. 6.
Imaging potentials of candidate nanomaterials. (a) The imaging potential of nanomaterials for MRI and their (b) quantitative results. The individual slopes correspond to the longitudinal relaxivity value (r1). (c) The assessment of CT imaging capabilities exhibited by nanomaterials ranging from 2.5 to 20 mg/ml. (d) Quantitative analysis of CT images. (e) The optical images of nanomaterials were acquired by IVIS, encompassing concentrations from 2.5 to 20 mg/ml. (f) The quantitative results of nanomaterials at FOV-C. (g) Images and (h) quantitative analysis of selected nanomaterials acquired at FOV-B. Orange line, AuNC@BSA; pearl line, AuNC@BSA-I; blue line, AuNC@BSA-Gd. FOV-C, 12.9 cm; FOV-B, 6.5 cm.
FIG. 7.
FIG. 7.
Cartilage imaging capabilities of the candidate nanomaterials for MRI, CT, and IVIS. (a) Cartilage specimens were incubated with AuNC@BSA (control) and AuNC@BSA-Gd for 24 h, followed by dissolution using a papain reagent to perform MRI image acquisition. (b) The tissue plugs were immersed in the candidate nanomaterials and imaged by μCT at before and 24 h after treatment. (c) Images were acquired by IVIS at various time points (0, 1, 4, 8, 12, and 24 h) after the incubation of candidate nanomaterials with OA-mimicking plugs or (d) healthy plugs. The correlation between the quantitative imaging analysis and normalized imaging results with the sGAG content at 24 h post-incubation is examined for both (e) and (f) anionic materials and (g) and (h) cationic AuNC@CBSA. Solid line, healthy plugs; dotted line, OA-mimicking plugs; orange line, AuNC@BSA; pearl line, AuNC@BSA-I; blue line, AuNC@BSA-Gd; black line, control; brown line, AuNC@CBSA.

Similar articles

Cited by

References

    1. Sophia Fox A. J., Bedi A., and Rodeo S. A., Sports Health 1, 461–468 (2009).10.1177/1941738109350438 - DOI - PMC - PubMed
    1. Gao X., Patwa A. N., Deng Z., Utsunomiya H., Grinstaff M. W., Ruzbarsky J. J., Snyder B. D., Ravuri S., Philippon M. J., and Huard J., Am. J. Transl. Res. 13, 8921–8937 (2021). - PMC - PubMed
    1. Stewart R. C., Bansal P. N., Entezari V., Lusic H., Nazarian R. M., Snyder B. D., and Grinstaff M. W., Radiology 266, 141–150 (2013).10.1148/radiol.12112246 - DOI - PMC - PubMed
    1. Fantoni S., Gabucci I., Cardarelli P., Paterno G., Taibi A., Cristofori V., Trapella C., Bazzani A., Assenza M., Zanna Bonacorsi A., Conti D., and Baruffaldi F., Diagnostics 12, 2111 (2022).10.3390/diagnostics12092111 - DOI - PMC - PubMed
    1. Casale J. and Crane J. S., in StatPearls (StatPearls Publishing, Treasure Island, FL, 2021), https://pubmed.ncbi.nlm.nih.gov/31335015/.

LinkOut - more resources