. 2024 Aug 20:7:0450.
doi: 10.34133/research.0450. eCollection 2024.

Targeting the Cascade Amplification of Macrophage Colony-stimulating Factor to Alleviate the Immunosuppressive Effects Following Radiotherapy

Affiliations

Targeting the Cascade Amplification of Macrophage Colony-stimulating Factor to Alleviate the Immunosuppressive Effects Following Radiotherapy

Zhiyun Liao et al. Research (Wash D C). .

Abstract

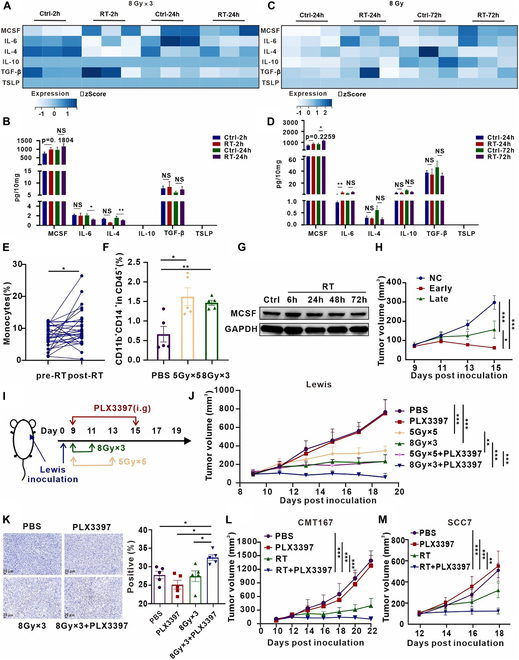
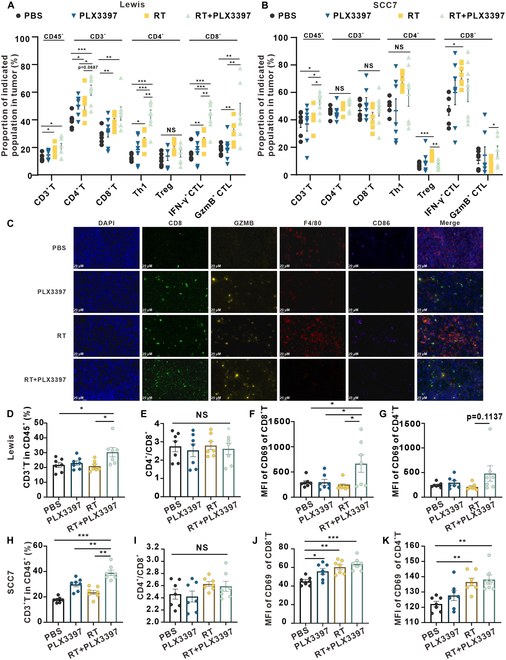
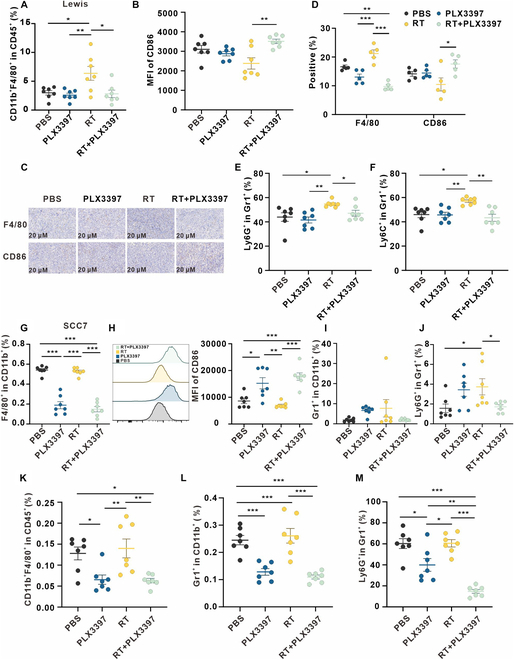
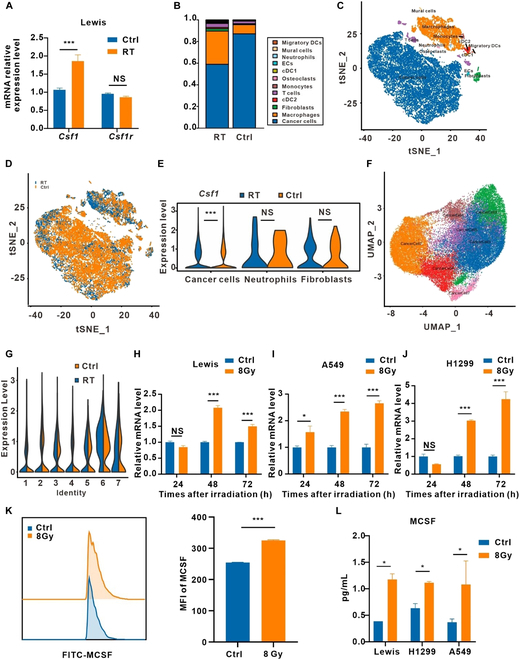
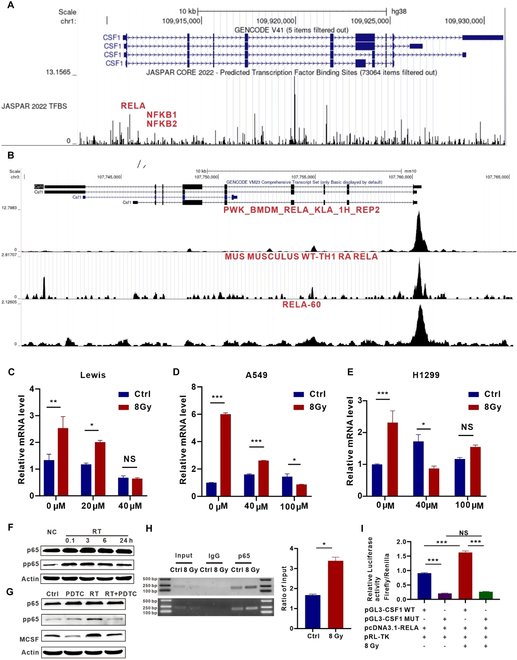
Radiotherapy (RT) serves as the primary treatment for solid tumors. Its potential to incite an immune response against tumors both locally and distally profoundly impacts clinical outcomes. However, RT may also promote the accumulation of immunosuppressive cytokines and immunosuppressive cells, greatly impeding the activation of antitumor immune responses and substantially limiting the effectiveness of RT. Therefore, regulating post-RT immunosuppression to steer the immune milieu toward heightened activation potentially enhances RT's therapeutic potential. Cytokines, potent orchestrators of diverse cellular responses, play a pivotal role in regulating this immunosuppressive response. Identifying and promptly neutralizing early released immunosuppressive cytokines are a crucial development in augmenting RT's immunomodulatory effects. To this end, we conducted a screen of immunosuppressive cytokines following RT and identified macrophage colony-stimulating factor (MCSF) as an early up-regulated and persistent immune suppressor. Single-cell sequencing revealed that the main source of up-regulated MCSF derived from tumor cells. Mechanistic exploration revealed that irradiation-dependent phosphorylation of the p65 protein facilitated its binding to the MCSF gene promoter, enhancing transcription. Knockdown and chemical inhibitor experiments conclusively demonstrated that suppressing tumor cell-derived MCSF amplifies RT's immune-activating effects, with optimal results achieved by early MCSF blockade after irradiation. Additionally, we validated that MCSF acted on macrophages, inducing the secretion of a large number of inhibitory cytokines. In summary, we propose a novel approach to enhance the immune activation effects of RT by blocking the MCSF-CSF1R signaling pathway early after irradiation.


Conflict of interest statement

Competing interests: The authors declare that they have no competing interests.

Figures

Fig. 1.
Fig. 1.
Inhibition of MCSF signaling after irradiation substantially attenuates tumor growth. (A) Heatmap illustrating alterations in cytokine expression profiles within Lewis subcutaneous transplant tumors at 2 and 24 h following 8 Gy ×3 irradiation. (B) Statistical presentation of differential cytokine expression patterns in subcutaneous tumors (n = 4 to 6 per group). (C) Heatmap depicting changes in cytokine expression profiles within Lewis subcutaneous transplant tumors at 24 and 72 h after a single 8-Gy irradiation. (D) Statistical representation of differential cytokine expression profiles within subcutaneous tumors (n = 4 to 6 per group). (E) Elevation in the proportion of monocytes in peripheral blood observed in patients with non-small cell lung cancer following RT (n = 30). (F) Flow cytometry analysis presenting variations in monocytes (CD11b+CD14+) within the peripheral blood of the Lewis subcutaneous transplant tumor model in response to the designated treatment regimens (n = 5 per group). (G) Protein expression levels of MCSF in Lewis cells after irradiation at 6, 24, 48, and 72 h were analyzed by Western blot (n = 3). (H) Tumor growth curves of the Lewis subcutaneous transplant tumor model subjected to different treatments (n = 7 per group). (I) Schematic representation of the treatment regimen involving RT in combination with the CSF1R inhibitor PLX3397. (J) Tumor growth curves of the Lewis subcutaneous transplant tumor model across different treatment groups (n = 7 per group). (K) Representative TUNEL immunohistochemical staining images of Lewis subcutaneous transplant tumors in the respective treatment groups (left). Quantification of the percentage of TUNEL staining-positive area, derived from 5 randomly selected fields within 3 replicate samples for each group (right) (n = 5 per group). (L) Tumor growth dynamics in the CMT167 subcutaneous transplant tumor model in response to the different treatments (n = 7 per group). (M) Tumor growth dynamics in the SCC7 subcutaneous transplant tumor model in response to the different treatments (n = 9 per group). *P < 0.05; **P < 0.01; ***P < 0.001.
Fig. 2.
Fig. 2.
Early blocking of MCSF pathway activates T cell-mediated immunity. (A) Flow cytometry analysis depicting alterations in T cell populations within the Lewis subcutaneous tumor across various treatment groups (n = 7 per group). (B) Flow cytometry analysis illustrating changes in T cell populations within the SCC7 subcutaneous tumor in different groups (n = 7 per group). (C) Immunofluorescence staining of tumor tissue displaying CD8 (green) and granzyme B (yellow), as well as F4/80 (red) and CD86 (purple) expression following diverse treatments. Scale bars, 20 μm. (D to G) Flow cytometry analysis presenting variations in T cell populations within the spleen of the Lewis subcutaneous transplant tumor model in response to the different treatments (n = 7 per group). (H to K) Flow cytometry analysis presenting variations in T cell populations within the spleen of the SCC7 subcutaneous transplant tumor model in response to the different treatments (n = 7 per group).
Fig. 3.
Fig. 3.
Early blockade of the MCSF pathway promotes macrophage polarization toward M1 phenotype and reduces MDSCs. (A and B) Flow cytometry analysis depicting alterations in macrophages within the Lewis subcutaneous tumor across various treatment groups (n = 7 per group). (C) Representative immunohistochemical staining of Lewis subcutaneous tumors in corresponding groups. (D) Five fields were randomly selected from 3 replicates for each group, and the percentage of staining positive area was counted. (E and F) MDSCs in Lewis subcutaneous tumors in corresponding treatment groups were analyzed using flow cytometry (n = 7 per group). (G to J) Myeloid cells in SCC7 subcutaneous tumor in corresponding treatment groups (n = 7 per group) were analyzed using flow cytometry. (K to M) Myeloid cells in the spleen of SCC7 subcutaneous transplant tumor model in corresponding treatment (n = 7 per group) were analyzed using flow cytometry.
Fig. 4.
Fig. 4.
MCSF elevated after irradiation mainly came from tumor cells. (A) Analysis of Csf1 and Csf1r mRNA expression in Lewis subcutaneous transplant tumors by RT-qPCR (n = 3). (B) Histograms of single sample cell compositions. (C and D) t distributed stochastic neighbor embedding (tSNE) representation for unirradiated (Ctrl) and irradiated (RT) tumor tissue. Color-coded for cell type. (E) Comparison of Csf1 expression in 3 major clusters of cells. (F) Uniform manifold approximation and projection (UMAP) representation for tumor cell clusters. (G) Comparison of Csf1 expression in 7 tumor cell clusters. (H to J) Csf1 mRNA expression levels in Lewis (H), A549 (I) and H1299 (J) cells after irradiation (n = 3). (K) Flow cytometry analysis of MCSF expression in Lewis cells after irradiation. MFI, mean fluorescence intensity (n = 3). (L) Cell supernatants from irradiated Lewis, A549, and H1299 cells were analyzed by ELISA for MCSF (n = 3). *P < 0.05; **P < 0.01; ***P < 0.001.
Fig. 5.
Fig. 5.
P65 binding to the MCSF gene promoter is enhanced after irradiation. (A) Transcription factors for MCSF (gene name: Csf1) were predicted using the JASPAR database. (B) ChIP-seq data of murine cell lines predicted p65 (RELA) binding to the Csf1. (C to E) Analysis of Csf1 mRNA expression in Lewis (C), A549 (D), and H1299 (E) cells treated with PDTC after irradiation (n = 3). (F) Protein expression levels of p65 and pp65 in H1299 cells after irradiation at 0.1, 3, 6, and 24 h were analyzed by Western blot (n = 3). (G) Protein expression levels of p65, pp65, MCSF in H1299 cells treated by PDTC after irradiation were analyzed by Western blot (n = 3). (H) In unirradiated and irradiated H1299 cells (n = 3), ChIP assays were performed. Left panel shows representative gel electrophoresis images. Right panel shows p65 levels in the gene promoter region normalized to input. (I) Relative luciferase activity was evaluated in different groups. WT, wild type; MUT, mutation; pRL-TK, renilla luciferase plasmid (n = 3). *P < 0.05; **P < 0.01; ***P < 0.001.
Fig. 6.
Fig. 6.
Reducing tumor cell-derived MCSF after irradiation diminishes the cascading amplification of immunoinhibitory cytokines. (A) Lewis cells were transfected with either control or shCsf1 lentivirus, and subsequently, samples were collected for Western blot analysis to assess the expression levels of MCSF (n = 3). (B) RT-qPCR analysis of the expression levels of cytokines in Lewis stable cells (shCtrl and shCsf1) after irradiation (n = 3). (C) Growth curves of tumors in the Lewis subcutaneous transplant tumor model treated in corresponding treatment groups (left). Visual representation of tumors in Lewis subcutaneous transplant tumor model treated by corresponding treatment groups (right) (n = 9 per group). (D) Immunofluorescence staining of CD8 (green), F4/80 (red), and CD86 (purple) expression on the tumor tissue after different treatments. Scale bars, 20 μm. (E) Five fields were randomly selected from 3 replicates for each group, and the percentage of staining positive area of GzmB was counted. (F) Flow cytometry analysis of T cells, macrophages, and myeloid cells in Lewis subcutaneous tumors. (G) Differences in the expression of different cytokines in Lewis subcutaneous transplant tumor models according to their treatment (n = 3).
Fig. 7.
Fig. 7.
RT combined with the CSF1R inhibitor exerts tumor-suppressive effects partly by acting on macrophages. (A and B) Csf1r mRNA expression levels in Lewis (A) and RAW264.7 (B) after irradiation for 24, 48, and 72 h (n = 3). (C) Schematic illustration of the coculture. (D) In BMDMs cocultured with Lewis stable cells (shCtrl and shCSF1), RT-qPCR was used to identify cytokines expressed in the cells (n = 3). (E) Flow cytometry analysis of clearance efficiency of clodronate liposomes (Clo) on macrophages in peripheral blood (n = 3). (F) Schema illustrating the treatment plan of RT combined with the CSF1R inhibitor PLX3397 and Clo. (G) Growth curves of tumors in the Lewis subcutaneous transplant tumor model in the different groups (n = 7 per group). *P < 0.05; **P < 0.01; ***P < 0.001.

References

    1. Harrington KJ, Billingham LJ, Brunner TB, Burnet NG, Chan CS, Hoskin P, Mackay RI, Maughan TS, Macdougall J, Mckenna WG, et al. . Guidelines for preclinical and early phase clinical assessment of novel radiosensitisers. Br J Cancer. 2011;105(5):628–639. - PMC - PubMed
    1. Schaue D, Mcbride WH. Opportunities and challenges of radiotherapy for treating cancer. Nat Rev Clin Oncol. 2015;12(9):527–540. - PMC - PubMed
    1. Herrera FG, Bourhis J, Coukos G. Radiotherapy combination opportunities leveraging immunity for the next oncology practice. CA Cancer J Clin. 2017;67(1):65–85. - PubMed
    1. Ngwa W, Irabor OC, Schoenfeld JD, Hesser J, Demaria S, Formenti SC. Using immunotherapy to boost the abscopal effect. Nat Rev Cancer. 2018;18(5):313–322. - PMC - PubMed
    1. Zhang Z, Liu X, Chen D, Yu J. Radiotherapy combined with immunotherapy: The dawn of cancer treatment. Signal Transduct Target Ther. 2022;7(1):258. - PMC - PubMed

LinkOut - more resources