. 2024 Aug 6:11:1414164.
doi: 10.3389/fmolb.2024.1414164. eCollection 2024.

The clinical significance of endoplasmic reticulum stress related genes in non-small cell lung cancer and analysis of single nucleotide polymorphism for CAV1

Affiliations

The clinical significance of endoplasmic reticulum stress related genes in non-small cell lung cancer and analysis of single nucleotide polymorphism for CAV1

Shuang Li et al. Front Mol Biosci. .

Abstract

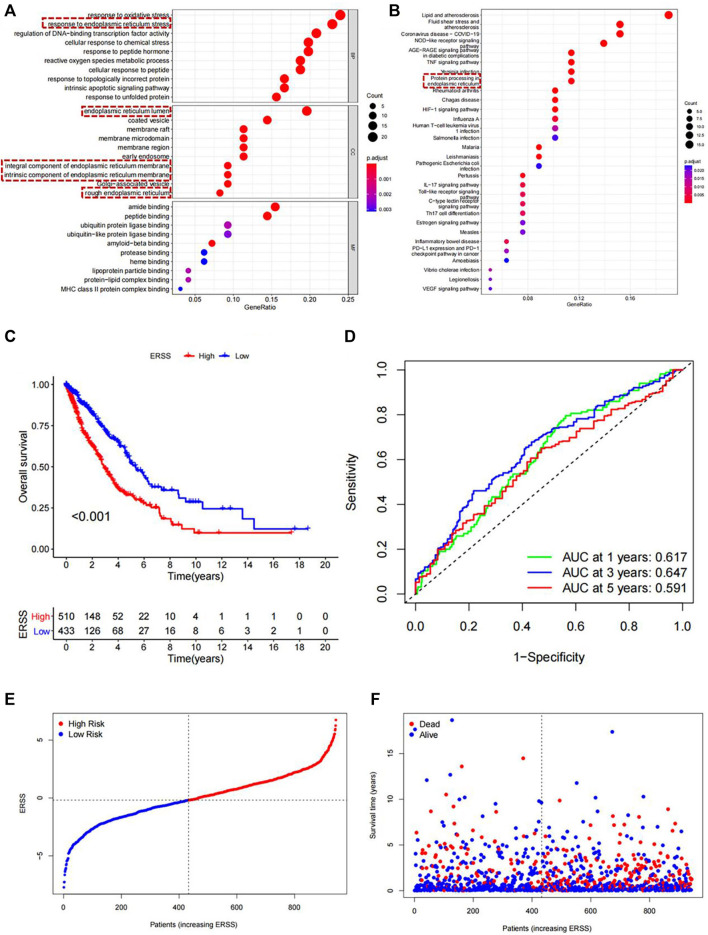
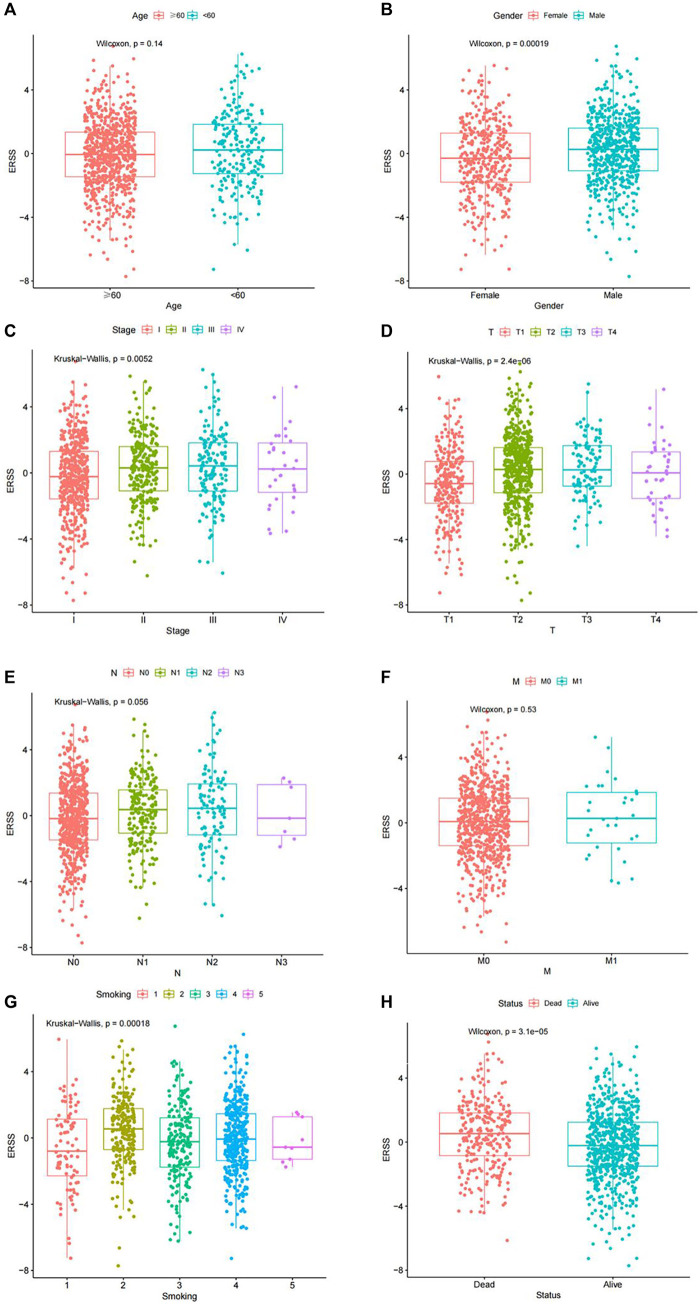
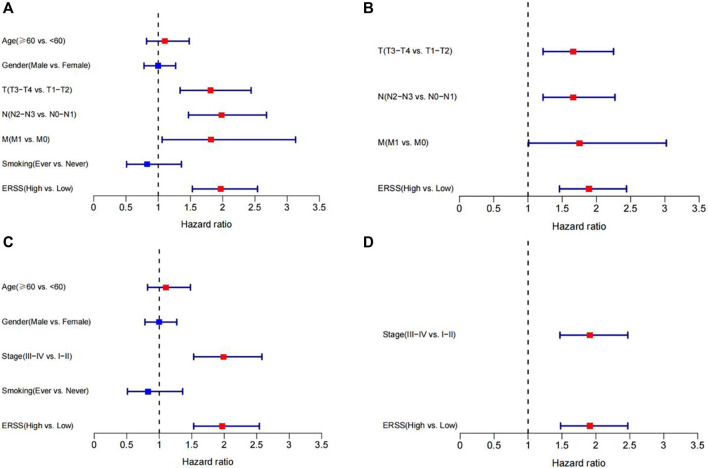
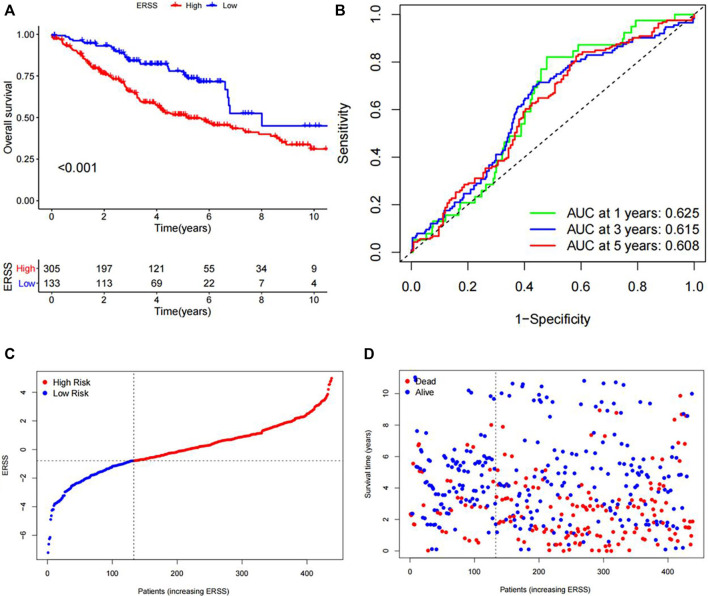
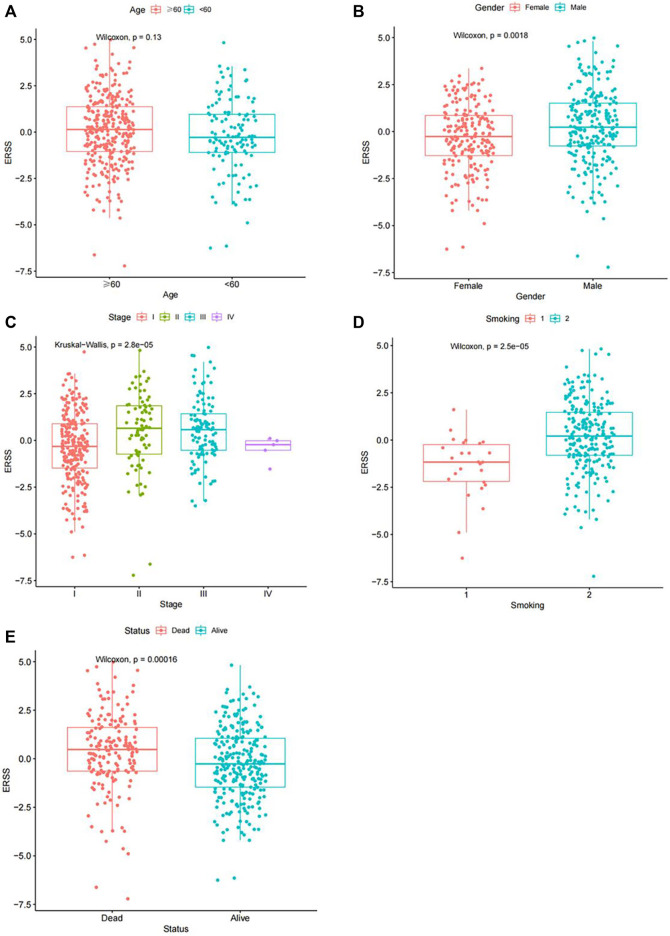
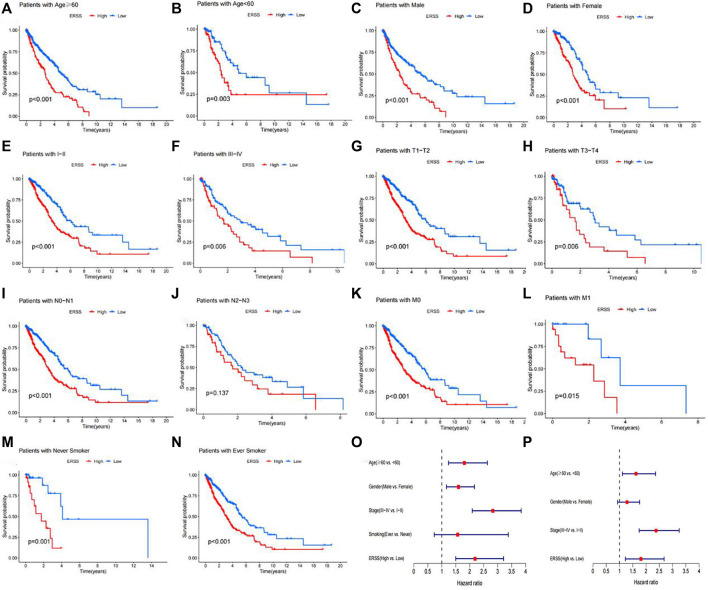
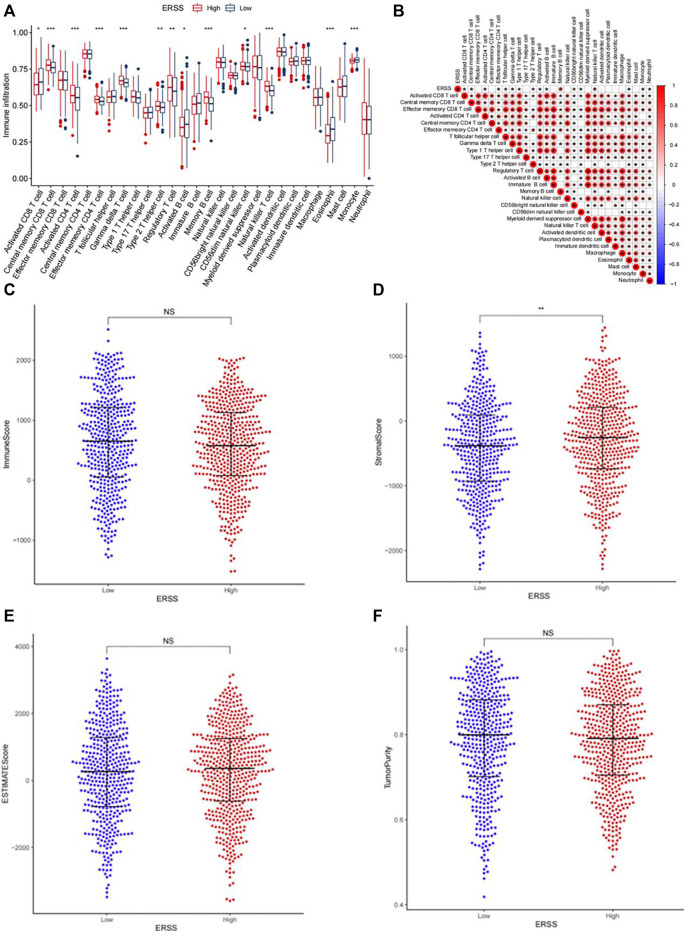
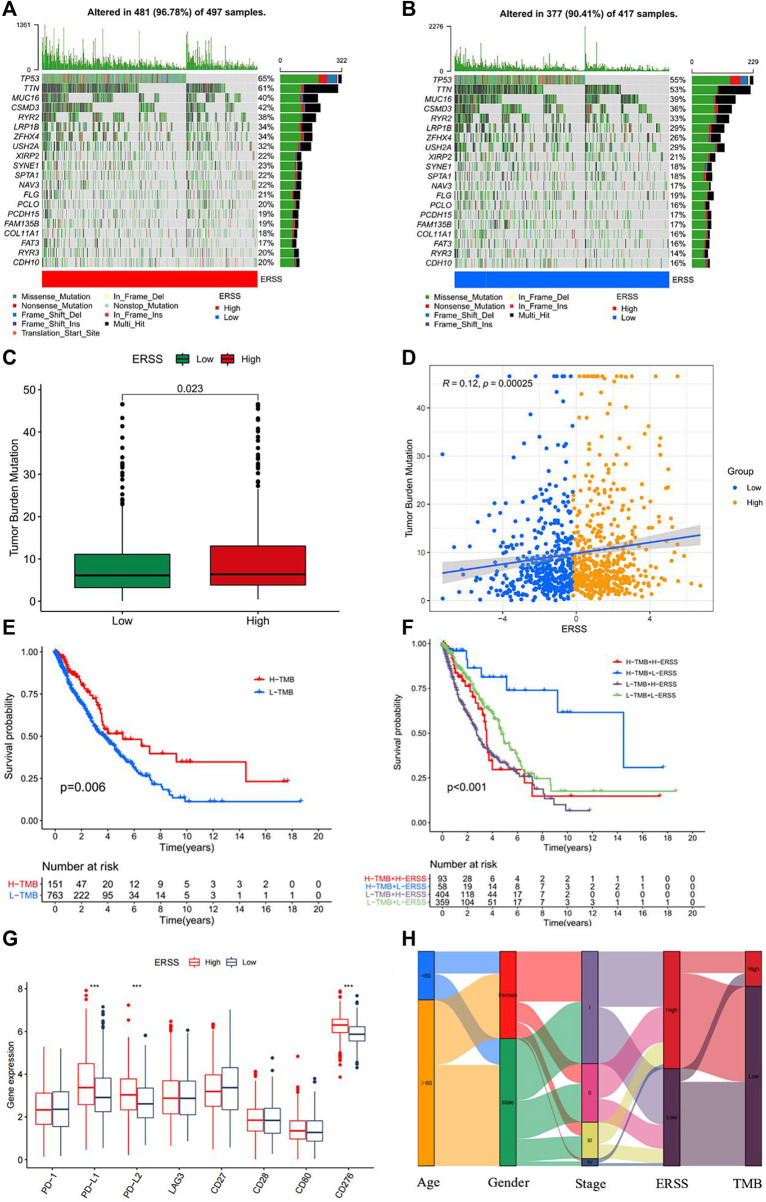
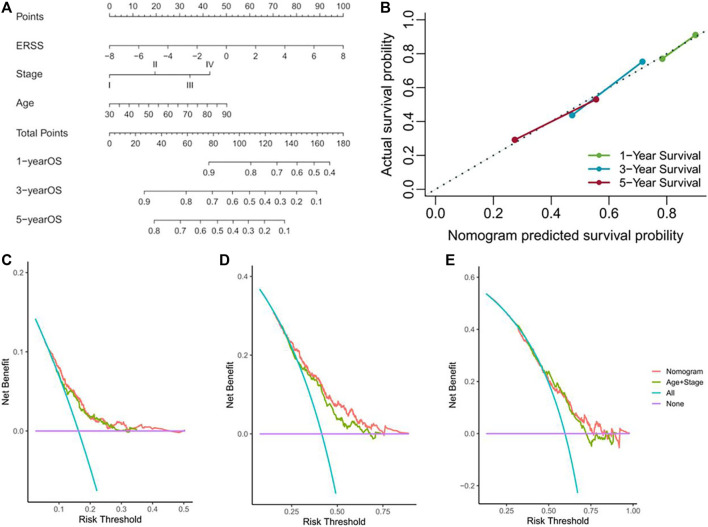
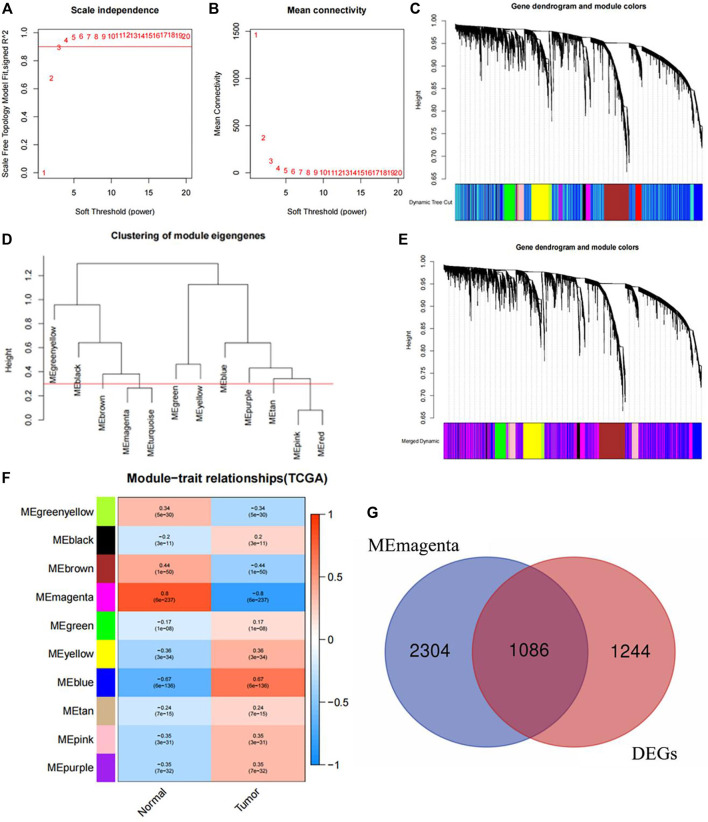
In recent years, protein homeostasis imbalance caused by endoplasmic reticulum stress has become a major hallmark of cancer. Studies have shown that endoplasmic reticulum stress is closely related to the occurrence, development, and drug resistance of non-small cell lung cancer, however, the role of various endoplasmic reticulum stress-related genes in non-small cell lung cancer is still unclear. In this study, we established an endoplasmic reticulum stress scores based on the Cancer Genome Atlas for non-small cell lung cancer to reflect patient features and predict prognosis. Survival analysis showed significant differences in overall survival among non-small cell lung cancer patients with different endoplasmic reticulum stress scores. In addition, endoplasmic reticulum stress scores was significantly correlated with the clinical features of non-small cell lung cancer patients, and can be served as an independent prognostic indicator. A nomogram based on endoplasmic reticulum stress scores indicated a certain clinical net benefit, while ssGSEA analysis demonstrated that there was a certain immunosuppressive microenvironment in high endoplasmic reticulum stress scores. Gene Set Enrichment Analysis showed that scores was associated with cancer pathways and metabolism. Finally, weighted gene co-expression network analysis displayed that CAV1 was closely related to the occurrence of non-small cell lung cancer. Therefore, in order to further analyze the role of this gene, Chinese non-smoking females were selected as the research subjects to investigate the relationship between CAV1 rs3779514 and susceptibility and prognosis of non-small cell lung cancer. The results showed that the mutation of rs3779514 significantly reduced the risk of non-small cell lung cancer in Chinese non-smoking females, but no prognostic effect was found. In summary, we proposed an endoplasmic reticulum stress scores, which was an independent prognostic factor and indicated immune characteristics in the microenvironment of non-small cell lung cancer. We also validated the relationship between single nucleotide polymorphism locus of core genes and susceptibility to non-small cell lung cancer.

Keywords: CAV1; bioinformatics; endoplasmic reticulum stress; non-small cell lung cancer; single nucleotide polymorphisms.


Conflict of interest statement

The authors declare that the research was conducted in the absence of any commercial or financial relationships that could be construed as a potential conflict of interest.

Figures

FIGURE 1
FIGURE 1
Functional enrichment analysis and Establishment of ERSS for NSCLC. (A) GO analysis of 97 differentially expressed endoplasmic reticulum stress-related genes. (B) KEGG analysis of 97 differentially expressed endoplasmic reticulum stress-related genes (C) KM curve comparing overall survival between high and low ERSS groups. (D) ROC curve of the prognostic characteristics of ERSS. (E) Risk plot of NSCLC patients. (F) Survival status plot of NSCLC patients.
FIGURE 2
FIGURE 2
Distribution of ERSS in NSCLC patients of clinical features. (A) Distribution of ERSS in NSCLC patients of different ages. (B) The distribution of ERSS in NSCLC patients of different genders. (C) The distribution of ERSS in NSCLC patients with different pathological stages. (D) The distribution of ERSS in NSCLC patients in different T stages. (E) The distribution of ERSS in NSCLC patients with different N stages. (F) The distribution of ERSS in NSCLC patients with different M stages. (G) The distribution of ERSS in NSCLC patients with different smoking histories, where the number “1–5″ represented the same meaning as Supplementary Table S1. (H) The distribution of ERSS in NSCLC patients with different survival status.
FIGURE 3
FIGURE 3
Cox regression analysis of ERSS and clinical features. (A) Forest plot of univariate Cox regression analysis results on factors affecting survival in NSCLC patients (including TNM stages). (B) Forest plot of multivariate Cox regression analysis results on factors affecting survival in NSCLC patients (including TNM stages). (C) Forest plot of univariate Cox regression analysis results on factors affecting survival in NSCLC patients (including pathological stage). (D) Forest plot of multivariate Cox regression analysis results on factors affecting survival in NSCLC patients (including pathological stage).
FIGURE 4
FIGURE 4
Validation of ERSS for NSCLC. (A) KM curve comparing the overall survival between high and low ERSS groups in the GEO validation dataset. (B) ROC curve of the prognostic characteristics of ERSS in GEO validation dataset. (C) Risk plot of NSCLC patients in GEO validation dataset. (D) Survival status plot of NSCLC patients in GEO validation dataset.
FIGURE 5
FIGURE 5
Distribution of ERSS in NSCLC patients of clinical features in the GEO validation dataset. (A) Distribution of ERSS in NSCLC patients of different ages in the GEO validation dataset. (B) The distribution of ERSS in NSCLC patients of different genders in the GEO validation dataset. (C) The distribution of ERSS in NSCLC patients with different pathological stages in the GEO validation dataset. (D) The distribution of ERSS in NSCLC patients with different smoking histories in the GEO validation dataset, where the numbers “1, 2″represented the same meaning as Supplementary Table S2. (E) The distribution of ERSS in NSCLC patients with different survival states in the GEO validation dataset.
FIGURE 6
FIGURE 6
Subgroup analysis of overall survival in NSCLC patients. (A) Age ≥60 years. (B) Age <60 years. (C) Male. (D) Female. (E) Pathological stage with I-II. (F) Pathological stage with III-IV. (G) T1-T2 stage. (H) T3-T4 stage. (I) N0-N1 stage. (J) N2-N3 stage. (K) M0 stage. (L) M1 stage. (M) Never smokers. (N) Ever smokers. (O) Forest plot of univariate Cox regression analysis results on factors affecting survival in NSCLC patients in the GEO validation dataset. (P) Forest plot of multivariate Cox regression analysis results on factors affecting survival in NSCLC patients in the GEO validation dataset.
FIGURE 7
FIGURE 7
Analysis of tumor immune infiltration. (A) Infiltration of 28 types of immune cells in patients with high and low ERSS. (B) Heatmap of the correlation between ERSS and immune cell infiltration. (C) Comparison of immune scores between high and low ERSS patients. (D) Comparison of stroma scores between high and low ERSS patients. (E) Comparison of estimate scores between high and low ERSS patients. (F) Comparison of tumor purity between high and low ERSS patients; Where “*” represented p < 0.05, “**” represented p < 0.01, and “***” represented p < 0.001.
FIGURE 8
FIGURE 8
Tumor mutation burden analysis. (A) Somatic mutation frequency in patients with high ERSS. (B) Somatic mutation frequency in patients with low ERSS. (C) Box plot of TMB comparison between high and low ERSS patients. (D) Correlation plot between ERSS and TMB. (E) KM curve of patients with different TMB. (F) KM curve of composite TMB and ERSS. (G) The expression level of immune checkpoint genes in high and low ERSS patients. (H) Patient features Sankey diagram.
FIGURE 9
FIGURE 9
Establishment and verification of nomogram. (A) Nomogram for predicting the overall survival of NSCLC patients. (B) Calibration gram of column chart. (C) The decision curve analysis of NSCLC patients at 1 year. (D) The decision curve analysis of NSCLC patients at 3 years. (E) The decision curve analysis of NSCLC patients at 5 years.
FIGURE 10
FIGURE 10
Core gene screening and determination with WGCNA. (A) Soft threshold under R 2. (B) The relationship between soft threshold and mean connectivity. (C) Dynamic tree. (D) The cutting height of each module. (E) The merged dynamic tree. (F) Correlation diagram between modules and traits. (G) Intersection diagram between Magenta module and different expressed genes.

Similar articles

Cited by

References

    1. Adams B. M., Oster M. E., Hebert D. N. (2019). Protein quality control in the endoplasmic reticulum. Protein J. 38 (3), 317–329. 10.1007/s10930-019-09831-w - DOI - PMC - PubMed
    1. Aliabadi F., Sohrabi B., Mostafavi E., Pazoki-Toroudi H., Webster T. J. (2021). Ubiquitin-proteasome system and the role of its inhibitors in cancer therapy. Open Biol. 11 (4), 200390. 10.1098/rsob.200390 - DOI - PMC - PubMed
    1. Almanza A., Carlesso A., Chintha C., Creedican S., Doultsinos D., Leuzzi B., et al. (2019). Endoplasmic reticulum stress signalling - from basic mechanisms to clinical applications. Febs J. 286 (2), 241–278. 10.1111/febs.14608 - DOI - PMC - PubMed
    1. Ancey P. B., Contat C., Boivin G., Sabatino S., Pascual J., Zangger N., et al. (2021). GLUT1 expression in tumor-associated neutrophils promotes lung cancer growth and resistance to radiotherapy. Cancer Res. 81 (9), 2345–2357. 10.1158/0008-5472.CAN-20-2870 - DOI - PMC - PubMed
    1. Andersson T., Alfredsson L., Källberg H., Zdravkovic S., Ahlbom A. (2005). Calculating measures of biological interaction. Eur. J. Epidemiol. 20 (7), 575–579. 10.1007/s10654-005-7835-x - DOI - PubMed

LinkOut - more resources