. 2024;5(1):1-14.
doi: 10.35459/tbp.2023.000253. Epub 2023 Dec 7.

Using Histologic Image Analysis to Understand Biophysical Regulations of Epithelial Cell Morphology

Affiliations

Using Histologic Image Analysis to Understand Biophysical Regulations of Epithelial Cell Morphology

Alexandra Bermudez et al. Biophysicist (Rockv). 2024.

Abstract

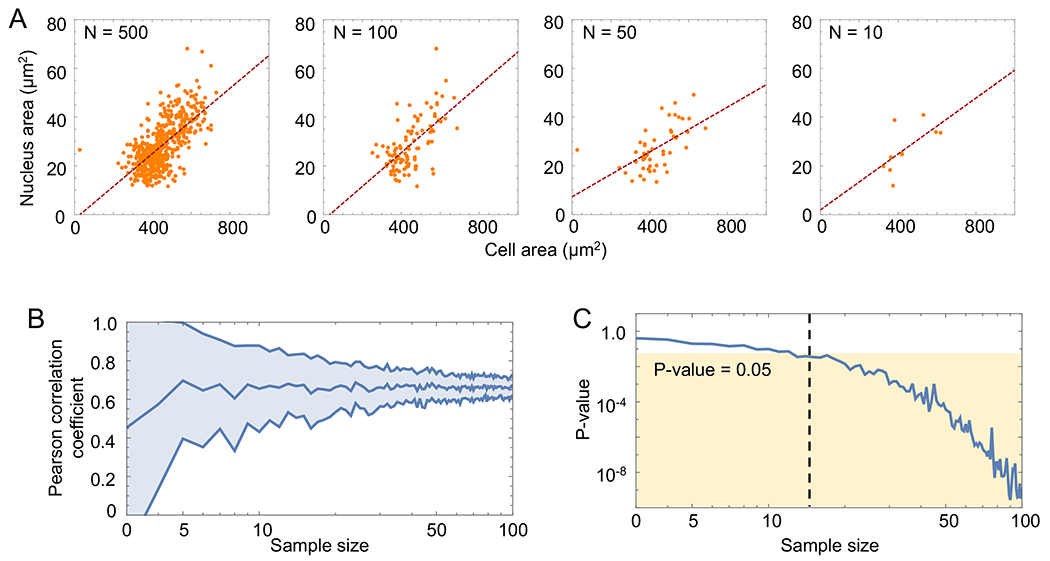
Epithelial mechanics and mechanobiology have become 2 important research fields in life sciences and bioengineering. These fields investigate how physical factors induced by cell adhesion and collective behaviors can directly regulate biologic processes, such as organ development and disease progression. Cell mechanics and mechanobiology thus make exciting biophysics education topics to illustrate how fundamental physics principles play a role in regulating cell biology. However, the field currently lacks hands-on activities that engage students in learning science and outreach programs in these topics. One such area is the development of robust hands-on modules that allow students to observe features of cell shape and mechanics and connect them to fundamental physics principles. Here, we demonstrate a workflow that engages students in studying epithelial cell mechanics by using commercial histology slides of frog skin. We show that by using recently developed artificial intelligence-based image-segmentation tools, students can easily quantify different cell morphologic features in a high-throughput manner. Using our workflow, students can reproduce 2 essential findings in cell mechanics: the common gamma distribution of normalized cell aspect ratio in jammed epithelia and the constant ratio between the nuclear and cellular area. Importantly, because the only required instrument for this active learning module is a readily available light microscope and a computer, our module is relatively low cost, as well as portable. These features make the module scalable for students at various education levels and outreach programs. This highly accessible education module provides a fun and engaging way to introduce students to the world of epithelial tissue mechanics.

Keywords: first-year undergraduate; hands-on learning; high/middle school laboratories; interdisciplinary.


Figures

Fig 1.
Fig 1.
Epithelium and jammed foam exhibit similar morphology. (A) Image of Madin–Darby canine kidney epithelial cells reproduced from He et al. (55). Scale bar is 10 μm. (B) Screenshot of a 2D wet foam, which represents a jammed physical system (56). Despite the different nature between these 2 physical and biologic examples, the analogous morphology suggests that interfacial tension largely regulates the structure in both systems.
Fig 2.
Fig 2.
Data acquisition and analysis overview. (A) Workflow describing the 3 key experimental steps. Phase contrast images of frog skin epithelial cells are acquired (top) and used as an input into Cellpose, which is an AI-based segmentation tool for nuclear and cytoplasmic segmentation (middle). The segmentation outlines exported from Cellpose were then read into ImageJ to obtain morphologic measurements for downstream analyses, which can be performed by using various platforms, including MATLAB or Excel (bottom). (B) Cross-section image of frog skin illustrating the 3 main layers of the tissue. In this work, we focused on the topmost layer of the skin, the stratum corneum, because it can be approximated as a 2D system. Scale bar = 200 μm. (C) The 10× phase contrast image of flat-mount frog skin, illustrating the overall shape and dimension of the sample. Out-of-focus regions represent portions of the sample that are not in the same optical plane due to sample wrinkling. The red box denotes the region of interest (ROI) shown in (D–F). Scale bar = 100 ¼m. (D) The 20× phase contrast image of ROI shown in (C). (E) The 40× phase contrast image of the same ROI. (F) The 40× bright field image of the same ROI, but this produced a more out-of-focus background and less defined boundaries, which may reduce the segmentation robustness. Scale bars in (D–F) = 50 ¼m.
Fig 3.
Fig 3.
Image segmentation and morphology analysis. (A) Screenshot of Cellpose 2.0 displaying nuclear masks identified by using a user-trained model. (B) Cytoplasmic and nuclear segmentation overlay (yellow) superimposed on the original image using ImageJ. The region of interest (ROI) manager (left window) allows users to look at each outline individually. Users can then press measure to obtain the results shown in the right window. (C) Zoom in of the red boxed region of the Cellpose user interface shown in (A). Here, users can chose from a pretrained model or optimize segmentation parameters. (D) Enlargement of the orange boxed region shown in (B) illustrating the ImageJ ROI manager. (E) Enlargement of the green boxed region in (B) demonstrating the ImageJ measurement results.
Fig 4.
Fig 4.
Epithelial cell vertex and AR analyses. (A) The 3-cell vertex. An example phase contrast image of 3 cell boundaries forming a vertex. (B) Associated vertices. An example phase contrast image of two 3-cell vertices that are closely associated. (C) Vertex distribution in frog skin samples. The 108 vertices were analyzed and roughly 85% of all vertices were well separated. (D) Representative phase contrast images of high AR cells. (E) Representative phase contrast images of low AR cells. (F) Probability density function (PDF) demonstrating the spread in AR within the frog skin samples. (G) PDFs normalized by using the rescaling parameter AR1AR1 where AR represents the average AR. Distribution was fit to a gamma curve with κ = 2.40. Scale bar for panels (A), (B), and (E) = 20 μm. Scale bar for panel (D) = 10 μm.
Fig 5.
Fig 5.
Nuclear-to-cytoplasmic correlation analysis. (A) Scatter plot of nucleus area versus cell area used to obtain the Pearson correlation coefficient for varying sample sizes. The red dashed line denotes the best fit line. A higher correlation between nuclear and cell area was observed with increasing sample size N. (B) The Pearson correlation coefficient (linear) versus sample size (logarithmic). The middle blue curve denotes the mean, while the shaded blue band denotes the standard deviation. (C) The P value (linear) versus sample size (logarithmic). The tan-shaded region denotes a P value significance threshold of 0.05. The black dashed line denotes the corresponding sample size for a P value of 0.05.

References

    1. Herrera-Perez RM, and Kasza KE. 2018. Biophysical control of the cell rearrangements and cell shape changes that build epithelial tissues. Curr Opin Genet Dev 51:88–95. - PubMed
    1. Lemke SB, and Nelson CM. 2021. Dynamic changes in epithelial cell packing during tissue morphogenesis. Curr Biol 31:R1098–R1110. - PMC - PubMed
    1. Mammoto T, Mammoto A, and Ingber DE. 2013. Mechanobiology and developmental control. Annu Rev Cell Dev Biol 29:27–61. - PubMed
    1. Miettinen TP, Caldez MJ, Kaldis P, and Björklund M. 2017. Cell size control—a mechanism for maintaining fitness and function. Bioessays 39:1700058. - PubMed
    1. Lecuit T, and Lenne P-F. 2007. Cell surface mechanics and the control of cell shape, tissue patterns and morphogenesis. Nat Rev Mol Cell Biol 8:633–644. - PubMed

LinkOut - more resources