. 2024 Jul 20;27(8):110550.
doi: 10.1016/j.isci.2024.110550. eCollection 2024 Aug 16.

Multiplex spatial omics reveals changes in immune-epithelial crosstalk during inflammation and dysplasia development in chronic IBD patients

Affiliations

Multiplex spatial omics reveals changes in immune-epithelial crosstalk during inflammation and dysplasia development in chronic IBD patients

Matthijs J D Baars et al. iScience. .

Abstract

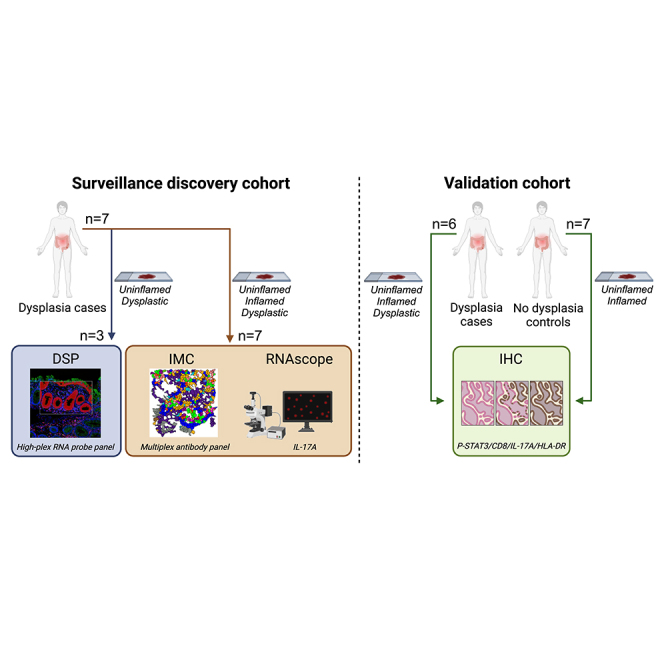
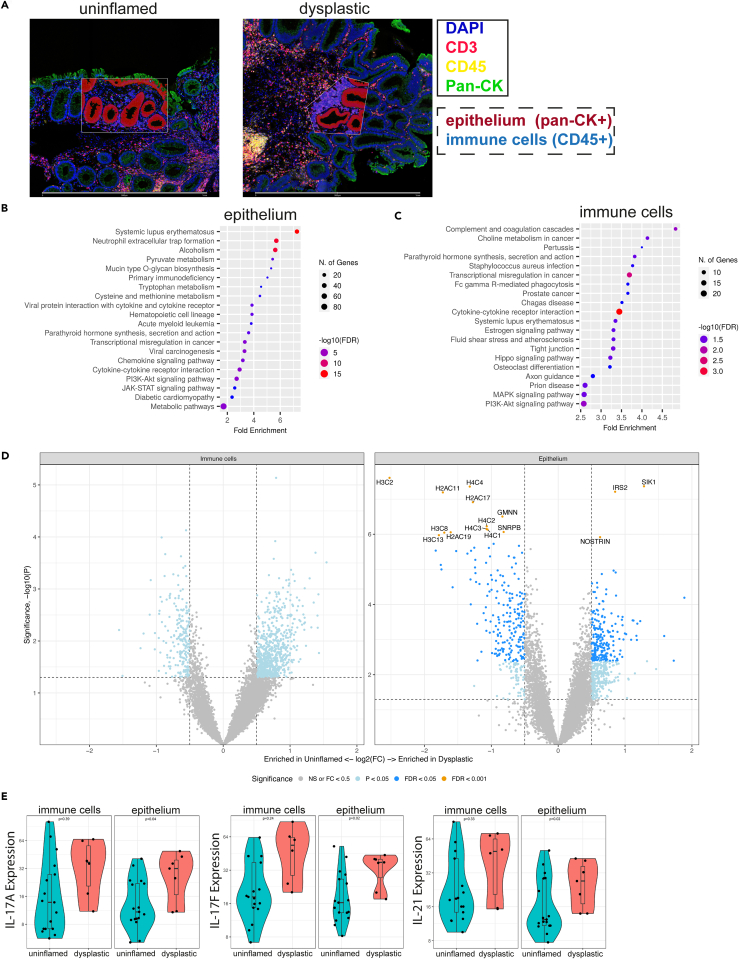
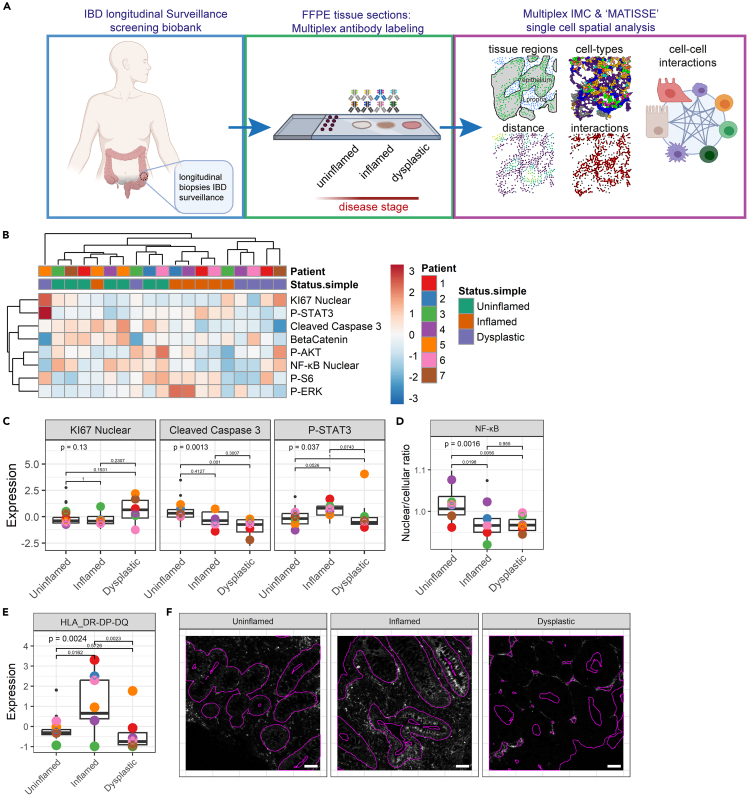
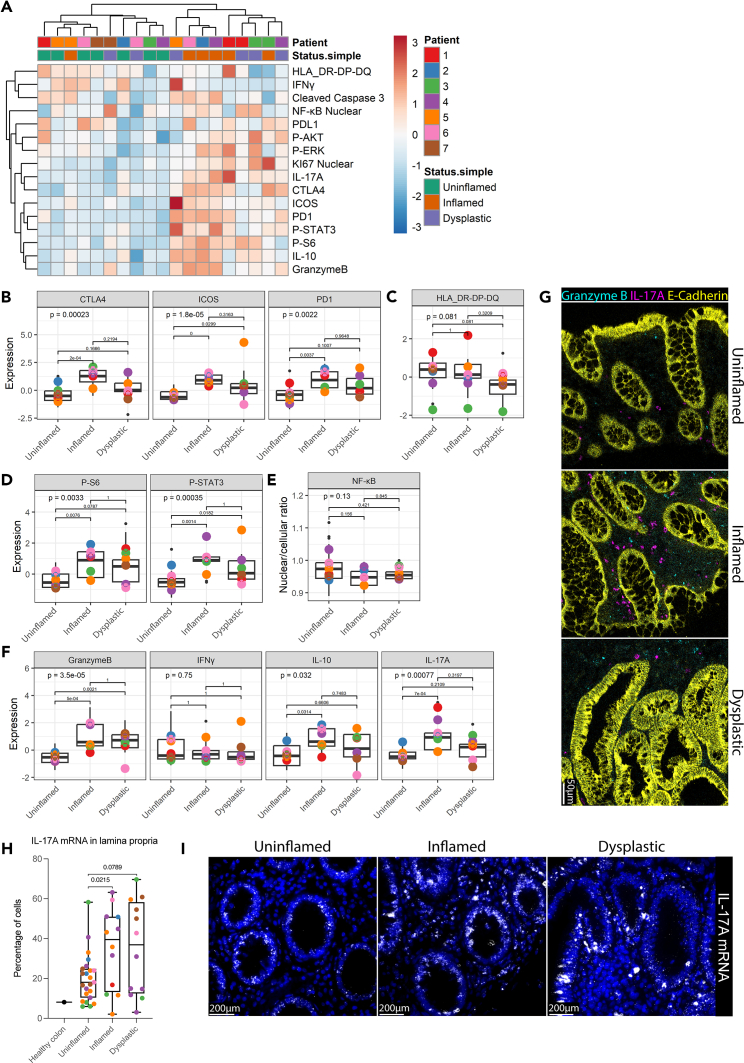
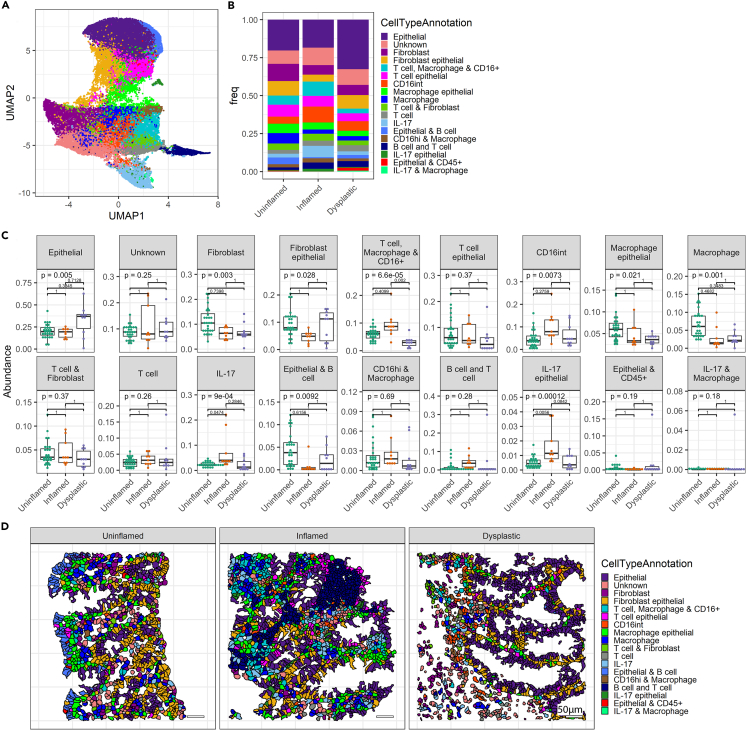
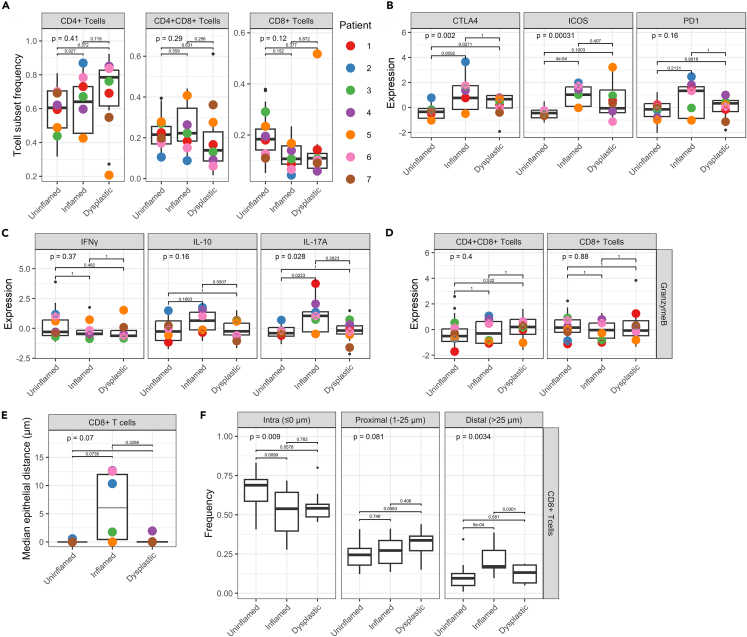
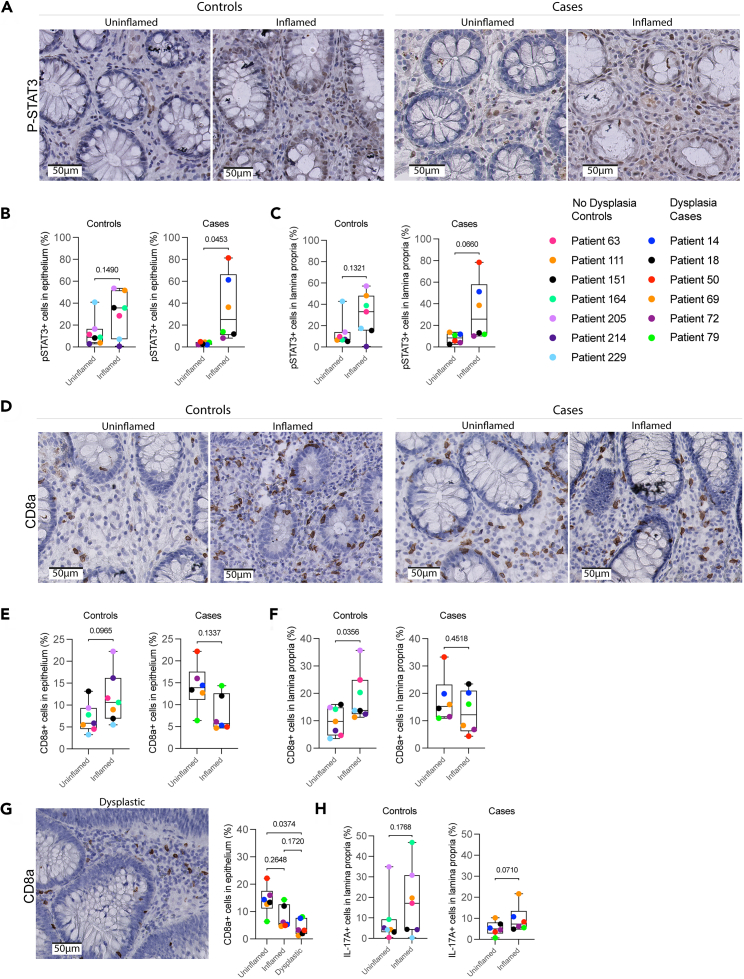
Patients with long-standing inflammatory bowel disease (IBD) face an increased risk of developing colitis-associated cancer (CAC). Although IBD-induced prolonged inflammation seems to be involved in CAC pathogenesis, the specific molecular changes that contribute remain unknown. Here, we applied digital spatial RNA profiling, RNAscope, and imaging mass cytometry to examine paired uninflamed, inflamed, and early dysplastic mucosa of patients with IBD. We observed robust type 3 (IL-17) responses during inflammation, accompanied by elevated JAK-STAT signaling and phosphorylated STAT3 (P-STAT3) levels, with both inflamed and dysplastic mucosa displaying immune cell activation. Higher stromal P-STAT3 was detected in uninflamed and inflamed mucosa of patients who eventually developed dysplasia. CD8a+ T cells did not infiltrate inflamed or dysplastic epithelial regions in these patients, while control patients showed elevated CD8a in inflamed mucosa. Our study reveals distinct inflammatory patterns throughout CAC development, marked by an activated IL-17 pathway, engaged STAT3, and diminished cytotoxic T cell infiltration.

Keywords: bioinformatics; biopsy sample; components of the immune system; disease; expression study; transcriptomics.


Conflict of interest statement

B.O. received research grants from AbbVie, Celltrion, Ferring, Takeda, Galapagos, and Pfizer and is a member of the advisory boards of Cablon, Pfizer, BMS, Janssen, MSD, Takeda, and Galapagos. Y.V. received a Public Private Partnership grant from Health Holland (#TKI2017), with TigaTx BV and received a research grant from Galapagos.

Figures

None
Graphical abstract
Figure 1
Figure 1
Digital spatial RNA profiling reveals elevated inflammatory signals in colitis-associated dysplasia Formalin-fixed paraffin embedded mucosal biopsies (3 dysplastic and 7 paired non-dysplastic, uninflamed tissues) were included from 3 patients enrolled in surveillance. (A) Masks for epithelium (panCK+) and immune cells (CD45+) were generated, for 3 regions per biopsy. Scale bars represent 1 mm. (B) Epithelial and (C) immune cell gene expression-based pathway analysis of uninflamed versus dysplastic biopsies. Top 20 of KEGG human pathway enrichment, most significant processes are highlighted in red, and the less significant processes are highlighted in blue according to −log10(FDR). Dot size indicates number of genes involved: larger dots in the graph correspond to a greater number of genes. (D) Volcano plots showing differential gene expression with genes enriched in uninflamed (left) or in dysplastic tissue (right). Significance is indicated by color: p < 0.05 (light blue), FDR<0.05 (dark blue), FDR<0.001 (orange, and names indicated). (E) Gene expression level of IL-17 family (type 3 inflammation) cytokines compared between dysplastic and uninflamed epithelial regions and immune cells. Displayed are IL-17A, IL-17F, and IL-21. Student’s t test was performed. p values are indicated in the graphs. See also Tables S1A and S1B and Figure S1.
Figure 2
Figure 2
The epithelial compartment displays lower inflammatory signaling and HLA-DR-DP-DQ expression in dysplasia (A) Overview of the experimental design including sample selection, tissue staining, and downstream computational protein expression and spatial analysis. 48 tissue biopsies were included from 7 patients with IBD, of >3 separately timed biopsies. Tissue sections were labeled, and regions of interest (ROIs) were imaged and segmented using the MATISSE pipeline. (B) Hierarchical clustering of median expression data of all cells in the epithelial compartment per biopsy. Disease states and individual patients are color coded. Relative expression level is indicated by color intensity in the heatmap. (C) Boxplot showing median expression of KI67, cleaved caspase-3, P-STAT3 in tissues annotated as different disease states (uninflamed, inflamed, and dysplastic). Black dots indicate the median expression per biopsy. Colored points represent the mean expression of all biopsies included for each individual patient. Kruskal-Wallis statistical test was performed, with Dunn’s post-test and Bonferroni multiple testing correction. p values are indicated in the graphs. (D) Boxplot showing median of the nuclear/cellular ratio of NF-κB. ANOVA statistical test was performed, with Tukey HSD post-test. p values are indicated in the graphs. (E) Boxplot showing median expression of HLA-DR-DP-DQ. Kruskal-Wallis statistical test was performed, with Dunn’s post-test and Bonferroni multiple testing correction. p values are indicated in the graphs. (F) Representative image of HLA-DR-DP-DQ staining; the epithelial compartment border is indicated with a purple outline. Scale bars represent 50 μm. See also Tables S2 and S3 and Figure S2.
Figure 3
Figure 3
Lamina propria cells display elevated expression of immune checkpoints, cytokines and active signaling in inflammation, and early dysplasia (A) Hierarchical clustering of median expression data of all cells in the lamina propria compartment per biopsy. Disease states and individual patients are color coded. Expression level is indicated by color intensity in the heatmap. (B–D) Boxplots showing median expression of proteins on lamina propria cells in tissues annotated as different disease states (uninflamed, inflamed, and dysplastic). Median expression is displayed for (B) checkpoint molecules CTLA-4, ICOS, PD-1, (C) HLA-DR-DP-DQ, (D) phosphorylated S6 (P-S6), and STAT3 (P-STAT3). Kruskal-Wallis statistical test was performed, with Dunn’s post-test and Bonferroni multiple testing correction. p values are indicated in the graphs. Black dots indicate the median expression per biopsy. Colored points represent the mean expression of all biopsies included for each individual patient. (E) Boxplot of the median nuclear/cellular localization ratio of NF-κB in lamina propria cells. ANOVA statistical test was performed, with Tukey HSD post-test. p values are indicated in the graphs. (F) Median expression of granzyme B, Interferon gamma (IFNγ), interleukin-10 (IL-10), and IL-17A. Kruskal-Wallis statistical test was performed, with Dunn’s post-test and Bonferroni multiple testing correction. p values are indicated in the graphs. Black dots indicate the median expression per biopsy. Colored points represent the mean expression of all biopsies included for each individual patient. (G) Representative IMC images are shown of granzyme B, and IL-17A in uninflamed, inflamed, and dysplastic tissue. Scale bar represents 50 μm. (H) Percentage of cells in lamina propria with more than 5 IL-17A mRNA counts per cell. Healthy colon value was obtained from a tissue microarray (TMA) of healthy colon tissue. two-way ANOVA with main effects only was performed, with Tukey HSD post-test. Colored points represent the percentage of cells per tissue biopsy. (I) Representative images of IL-17A mRNA expression in uninflamed, inflamed, and dysplastic tissue are shown. Scale bars represent 200 μm. See also Figure S3.
Figure 4
Figure 4
Changed cellular composition of the tissue during dysplasia development (A) UMAP displaying all identified cells clustered into cell subsets using Rphenograph. (B) Bar graph showing cellular proportions of each cell type cluster. (C) Boxplots showing proportions of cell types per tissue biopsy analyzed in the annotated disease states. Each dot represents the result of individual biopsies. ANOVA statistical test was performed, with Tukey HSD post-test. p values were adjusted for multiple comparisons with Bonferroni and indicated in the graphs. (D) Representative images displaying localization of cells, colored by cluster. See also Figure S4.
Figure 5
Figure 5
Inflamed mucosa shows elevated Th17 and cytotoxic T cells, which avoid epithelium in dysplasia (A) Proportions of CD4+ T helper cells, CD4+CD8+ (DP) T cells, and CD8+ cytotoxic T cells per patient. ANOVA statistical test was performed, with Tukey HSD post-test. p values are indicated in the graphs. (B) Expression of checkpoint molecules in T helper cells (CD4+ T cells). Individual datapoints represent median expression of all cells, and colored dots represent mean of all biopsies included per patient. Kruskal-Wallis statistical test was performed, with Dunn’s post-test and Bonferroni multiple testing correction. p values are indicated in the graphs. (C) Production of cytokines in T helper cells. Kruskal-Wallis statistical test was performed, with Dunn’s post-test and Bonferroni multiple testing correction. p values are indicated in the graphs. (D) Granzyme B expression in DP T cells and cytotoxic T cells. Kruskal-Wallis statistical test was performed, with Dunn’s post-test and Bonferroni multiple testing correction. p values are indicated in the graphs. (E) Median epithelial distance (μm) of CD8+ cytotoxic T cells per disease state. Distance was clipped to 75 μm. Kruskal-Wallis statistical test was performed, with Dunn’s post-test and Bonferroni multiple testing correction. p values are indicated in the graphs. (F) Analysis of localization of CD8+ cytotoxic T cells in the tissue, quantified as distance from the epithelium. Bins indicate “intra-epithelial” (≤0 μm), “proximal” (1–25 μm), and “distal” (>25 μm). Distance was clipped to 75 μm. ANOVA statistical test was performed, with Tukey HSD post-test. p values are indicated in the graphs. See also Figure S5.
Figure 6
Figure 6
Elevated IL-17A and P-STAT3 in inflamed mucosa associates with dysplasia development (A) Representative images of P-STAT3 expression in uninflamed and inflamed tissues of controls (no dysplasia), and dysplasia cases (dysplasia). Scale bars represent 50 μm. (B) Single-cell analysis of P-STAT3 expression, displayed as the proportion of P-STAT3+ cells in the epithelium in uninflamed and inflamed tissues of dysplasia cases and controls. Paired t test was performed. p values are indicated in the graphs. (C) Single-cell analysis of P-STAT3 expression, displayed as the proportion of P-STAT3+ cells in the lamina propria in uninflamed and inflamed tissues of dysplasia cases and controls. Paired t test was performed. p values are indicated in the graphs. (D) Representative images of CD8a expression in uninflamed and inflamed tissues of dysplasia cases and controls. Scale bars represent 50 μm. (E) Single-cell analysis of CD8a expression, depicted as proportion of CD8a+ cells in the epithelium in uninflamed and inflamed tissues of dysplasia cases and controls. Paired t test was performed. p values are indicated in the graphs. (F) Single-cell analysis of CD8a expression, depicted as proportion of CD8a+ cells in the lamina propria in uninflamed and inflamed tissues of dysplasia cases and controls. Paired t test was performed. p values are indicated in the graphs. (G) Single-cell analysis of CD8a expression, depicted as proportion of CD8a+ cells in uninflamed, inflamed, and dysplastic epithelium of dysplasia cases. Kruskal-Wallis statistical test was performed, with Dunn’s post-test. p values are indicated in the graphs. A representative image of CD8a expression in dysplastic tissue is shown. Scale bar represents 50 μm. (H) Single-cell analysis of IL-17A expression, depicted as proportion of IL-17A+ cells in uninflamed and inflamed lamina propria of dysplasia cases and controls. Paired t test was performed. p values are indicated in the graphs. See also Tables S4 and S5 and Figure S6.

References

    1. Beaugerie L., Itzkowitz S.H. Cancers Complicating Inflammatory Bowel Disease. N. Engl. J. Med. 2015;372:1441–1452. doi: 10.1056/NEJMra1403718. - DOI - PubMed
    1. Lutgens M.W.M.D., van Oijen M.G.H., van der Heijden G.J.M.G., Vleggaar F.P., Siersema P.D., Oldenburg B. Declining Risk of Colorectal Cancer in Inflammatory Bowel Disease. Inflamm. Bowel Dis. 2013;19:789–799. doi: 10.1097/MIB.0b013e31828029c0. - DOI - PubMed
    1. Grivennikov S., Karin E., Terzic J., Mucida D., Yu G.-Y., Vallabhapurapu S., Scheller J., Rose-John S., Cheroutre H., Eckmann L., Karin M. IL-6 and Stat3 Are Required for Survival of Intestinal Epithelial Cells and Development of Colitis-Associated Cancer. Cancer Cell. 2009;15:103–113. doi: 10.1016/j.ccr.2009.01.001. - DOI - PMC - PubMed
    1. Grivennikov S.I., Wang K., Mucida D., Stewart C.A., Schnabl B., Jauch D., Taniguchi K., Yu G.-Y., Österreicher C.H., Hung K.E., et al. Adenoma-linked barrier defects and microbial products drive IL-23/IL-17-mediated tumour growth. Nature. 2012;491:254–258. doi: 10.1038/nature11465. - DOI - PMC - PubMed
    1. Greten F.R., Eckmann L., Greten T.F., Park J.M., Li Z.-W., Egan L.J., Kagnoff M.F., Karin M. IKKβ Links Inflammation and Tumorigenesis in a Mouse Model of Colitis-Associated Cancer. Cell. 2004;118:285–296. doi: 10.1016/j.cell.2004.07.013. - DOI - PubMed

LinkOut - more resources