. 2024 Aug;11(31):e2308307.
doi: 10.1002/advs.202308307. Epub 2024 Jun 21.

Aloperine Suppresses Cancer Progression by Interacting with VPS4A to Inhibit Autophagosome-lysosome Fusion in NSCLC

Affiliations

Aloperine Suppresses Cancer Progression by Interacting with VPS4A to Inhibit Autophagosome-lysosome Fusion in NSCLC

Weina Guo et al. Adv Sci (Weinh). 2024 Aug.

Abstract

Aloperine (ALO), a quinolizidine-type alkaloid isolated from a natural Chinese herb, has shown promising antitumor effects. Nevertheless, its common mechanism of action and specific target remain elusive. Here, it is demonstrated that ALO inhibits the proliferation and migration of non-small cell lung cancer cell lines in vitro and the tumor development in several mouse tumor models in vivo. Mechanistically, ALO inhibits the fusion of autophagosomes with lysosomes and the autophagic flux, leading to the accumulation of sequestosome-1 (SQSTM1) and production of reactive oxygen species (ROS), thereby inducing tumor cell apoptosis and preventing tumor growth. Knockdown of SQSTM1 in cells inhibits ROS production and reverses ALO-induced cell apoptosis. Furthermore, VPS4A is identified as a direct target of ALO, and the amino acids F153 and D263 of VPS4A are confirmed as the binding sites for ALO. Knockout of VPS4A in H1299 cells demonstrates a similar biological effect as ALO treatment. Additionally, ALO enhances the efficacy of the anti-PD-L1/TGF-β bispecific antibody in inhibiting LLC-derived subcutaneous tumor models. Thus, ALO is first identified as a novel late-stage autophagy inhibitor that triggers tumor cell death by targeting VPS4A.

Keywords: VPS4A; apoptosis; autophagy inhibition; non‐small cell lung cancer; sequestosome‐1.


Conflict of interest statement

The authors declare that there are no conflicts of interest.

Figures
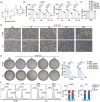
Figure 1
Figure 1
ALO inhibits cell proliferation in NSCLC cells. A) The chemical structure of ALO with a molecular weight of 232.365 g mol−1. B) Cell viability of H1299 and LLC cells treated with ALO (0–200 µм) for indicated time periods was determined by the CCK‐8 assay (n = 3). C) Cell viability of normal human bronchial epithelioid (HBE) cells treated with the ALO (0–200 µм) for 24 h was determined by the CCK‐8 assay. D) Microscopy images of H1299 and LLC cells treated with the ALO (0–200 µм) for 24 h. Scale bar: 100 µm. E) The macrographs and quantitative analyses of clone formation of H1299 and LLC cells (n = 3). F) Representative results of cell cycle analysis and quantitative analyses after treatment with ALO (200 µм) for 24 h (n = 3). Data in B–E) are presented as mean ± SD, and p values were calculated using one‐way ANOVA. Data in F) are presented as mean ± SD, and p values were determined by two‐tailed unpaired Student's t‐test. ns, not significant; *p < 0.05, **p < 0.01, ***p < 0.001.
Figure 2
Figure 2
ALO exerts antitumor efficacy in vivo. A) C57BL/6J mice with LLC‐derived subcutaneous tumors were administered with low‐dose ALO (10 mg kg−1, ALO‐L) or high‐dose ALO (50 mg kg−1, ALO‐H) or PBS (Control, CT) every 2 days (n = 5). B) Images of LLC‐derived subcutaneous tumors and tumor growth curves revealed a significant inhibitory effect of ALO on the growth of the LLC‐derived subcutaneous tumors. C) Schematic diagram of injection protocol in Kras G12D; Trp53fl/fl mice (n = 5). D) Images and weights of tumors in Kras G12D; Trp53−/− mice. E) H&E staining and histopathological analysis of lungs collected from the Kras G12D; Trp53−/− mice (n = 5). Scale bar: 50 µm. F) Immunohistochemistry analysis of Ki67 in tumor sections from the Kras G12D; Trp53−/− mice (n = 5). Scale bar: 50 µm. G) Schematic diagram of injection protocol in mice with LLC‐derived lung metastasis tumors (n = 5). H) Images and weights of tumors in mice with LLC‐derived lung metastasis tumors (n = 5). I) Computed Tomography analysis of LLC‐derived lung metastasis tumors (n = 5). J) H&E staining and histopathological analysis of liver, kidney and lung collected from the control (CT) and high‐dose ALO‐treated group (n = 5). Scale bar: 100 µm. Data in B–I) are presented as mean ± SD, and p values were calculated using one‐way ANOVA. Data in J) are presented as mean ± SD, and p values were determined by two‐tailed unpaired Student's t‐test. ns, not significant; *p < 0.05, **p < 0.01, ***p < 0.001.
Figure 3
Figure 3
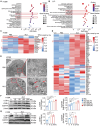
Identification of ALO as an autophagy modulator. A,B) The Kyoto Encyclopedia of Genes and Genomes bubble map of differentially enriched genes in H1299 A) and LLC cells B) treated with the PBS or ALO (200 µм) for 12 h (n = 3). C,D) Heatmaps of differentially expressed genes in the autophagy pathways of ALO‐treated and untreated H1299 C) and LLC cells D). E) Transmission electron micrographs of H1299 cells treated with PBS or ALO (200 µм) for 24 h. The right pictures are the enlarged representations of the boxed regions of the left pictures. Scale bar: 1 µm. F) Immunoblotting assays were performed to assess LC3B‐II and SQSTM1 levels in H1299 cells treated with ALO (0–200 µм) for 24 h and quantified by gray scale analysis (n = 3). G) Immunoblotting assays were performed to assess LC3B‐II and SQSTM1 levels in H1299 cells treated with ALO (200 µм) for indicated time periods and quantified by gray scale analysis (n = 3). β‐Actin was used as a loading control. Data in F,G) are presented as mean ± SD, and p values were calculated using one‐way ANOVA. ns, not significant; *p < 0.05, **p < 0.01, ***p < 0.001.
Figure 4
Figure 4
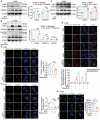
ALO functions as a late‐stage autophagy inhibitor. A) Immunoblotting assays were performed to assess LC3B‐II and SQSTM1 levels in H1299 cells treated with PBS or ALO (200 µм) in the absence or presence of SAR405 (10 µм) for 2 h and quantified by gray scale analysis (n = 3). B) Immunoblotting assays were performed to assess LC3B‐II, SQSTM1 and procathepsin D (pro‐CTSD), preprocathepsin D (pre‐CTSD) and mature CTSD (mCTSD) in H1299 cells treated with PBS or ALO (200 µм) in the absence or presence of rapamycin (250 nм, 24 h) for 2 h and quantified by gray scale analysis (n = 3). C) Immunoblotting assays were performed to assess LC3B‐II and SQSTM1 levels in H1299 cells treated with PBS or ALO (200 µм) in the absence or presence of 1 µм Bafilomycin A1 (BafA1) for 2 h and quantified by gray scale analysis (n = 3). D) Fluorescence images of H1299 cells transfected with RFP‐GFP‐LC3B reporter and analysis of the number of autophagosomes and autolysosomes. Cells were treated with PBS or ALO (200 µм) in complete medium for 2 h. 1 µм BafA1‐treated cells were used as positive controls (n = 3). Scale bar: 10 µm. E) Fluorescence images and analysis of the colocalization of GFP‐LC3B and LysoTracker Red in H1299 cells cultured in complete medium in the absence or presence of ALO (200 µм) for 2 h (n = 3). Scale bar: 10 µm. F) Immunofluorescence images and analysis of the colocalization of LC3 (green) and LAMP1 (red) in H1299 cells treated with PBS or ALO (200 µм) for 2 h (n = 3). Scale bar: 10 µm. G) H1299 cells were treated with PBS or ALO (200 µм) for 2 h. Representative images of H1299 cells stained with LysoSensor Green and quantification of fluorescence intensity (n = 3). 1 µм BafA1‐treated cells were used as positive controls. Scale bar: 10 µm. Data in A–G) are presented as mean ± SD, and p values were calculated using one‐way ANOVA. ns, not significant; *p < 0.05, **p < 0.01, ***p < 0.001.
Figure 5
Figure 5
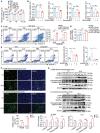
ALO‐mediated cell apoptosis is mainly induced by SQSTM1 accumulation‐mediated excessive reactive oxygen species (ROS) production. A) The cytotoxicity of ALO on H1299 cells was measured using the LDH releasing assay (n = 3). B) Modulatory profiling of known small‐molecule cell death inhibitors in H1299 cells treated with ALO (200 µм, 24 h) (n = 3). C) Representative results of annexin V/7‐AAD staining in H1299 cells treated with ALO (0–200 µм) for 48 h (n = 3). D) The intracellular ROS level was measured in H1299 cells treated with ALO (200 µм) for 24 h (n = 3). E) Annexin V/7‐AAD staining was performed to estimate the ratio of cellular apoptosis in ALO‐treated H1299 cells transfected with SQSTM1 siRNA (siSQSTM1) or negative control siRNA (siNC) (n = 3). F) Representative images and statistical analysis of TUNEL staining (green) in tumor sections from H1299‐derived subcutaneous tumor models and LLC‐derived subcutaneous tumor models in the ALO group and control (CT) group (n = 5). Scale bar: 50 µm. G) Immunoblotting assays were performed to assess LC3B‐II, SQSTM1, Bax and PARP levels in tumor tissues collected from H1299‐derived subcutaneous tumor models (n = 4) and LLC‐derived subcutaneous tumor models in the ALO group and CT group (n = 3). Data in A–E) are presented as mean ± SD, and p values were calculated using one‐way ANOVA. Data in F,G) are presented as mean ± SD, and p values were determined by two‐tailed unpaired Student's t‐test. ns, not significant; *p < 0.05, **p < 0.01, ***p < 0.001.
Figure 6
Figure 6
Identifying VPS4A as the direct target of ALO. A) Schematic diagram of drug affinity responsive target stability (DARTS) technology. B) The cellular target of ALO was identified using DARTS technology coupled with LC–MS/MS in H1299 and LLC cells. M, marker. C) VPS4A protein stability was increased upon ALO treatment in H1299 cell lysates. D,E) Cellular thermal shift assay (CETSA) assays confirmed the binding of ALO to VPS4A in H1299 cells, with β‐Actin serving as the internal control (n = 3). F) The binding of ALO to VPS4A was depicted through a surface plasmon resonance (SPR) sensorgram. The start of dissociation is indicated by the black arrow. G) Immunoblotting assays were performed to assess EGFR level in H1299 cells treated with ALO (200 µм, 48 h). H) Docking analysis of ALO covalent binding mode to yeast VPS4. I,J) VPS4A knockout (KO) H1299 cells were transfected with wild‐type (WT) and mutant VPS4A expressing plasmids, namely pENTER‐VPS4AF153A; D263A (Mut1) and pENTER‐VPS4AN262Y; G264F (Mut2). After 48 h, the cells were harvested, lysed, followed by treatment with ALO (200 µм) to assess the stability of VPS4A against pronase. H1299 cells served as the negative control (NC). The binding sites of VPS4A to ALO in H1299 cells were confirmed through DARTS assays I) and CETSA assays J). Data in E) are presented as mean ± SD, and p values were determined by two‐tailed unpaired Student's t‐test. *p < 0.05, **p < 0.01, ***p < 0.001.
Figure 7
Figure 7
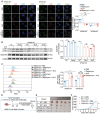
ALO exerts antitumor efficacy by targeting VPS4A. A) Fluorescence images of the colocalization of GFP‐STX17 and LC3 (red) in wild‐type (WT) H1299 and VPS4A knockout (KO) H1299 cells cultured in complete medium in the absence or presence of ALO (200 µм) for 2 h (n = 3). Scale bar: 10 µm. B) Immunoblotting assays were performed to assess LC3B‐II and SQSTM1 levels in H1299 and VPS4A KO H1299 cells treated with ALO (200 µм) for 2 h. Prior to ALO treatment, VPS4A KO H1299 cells were transfected with WT and mutant VPS4A expressing plasmids, pENTER‐VPS4AF153A; D263A (Mut1) and pENTER‐VPS4AN262Y; G264F (Mut2) and quantified by gray scale analysis (n = 3). H1299 cells were used as negative control (NC). C) The intracellular reactive oxygen species (ROS) level was determined in H1299 and VPS4A KO H1299 cells treated with ALO (200 µм) for 24 h in the absence or presence of 250 nм rapamycin (n = 3). D) Schematic diagram of tumor inoculation and injection protocol in H1299‐derived subcutaneous tumor mouse models. E) Images of tumors in WT and VPS4A KO H1299‐derived subcutaneous tumor mouse models (n = 5). F) Tumor growth curves of WT and VPS4A KO H1299‐derived subcutaneous tumor mouse models (n = 5). Data in A–F) are presented as mean ± SD, and p values were calculated using one‐way ANOVA. ns, not significant; *p < 0.05, **p < 0.01, ***p < 0.001.
Figure 8
Figure 8
Evaluate the therapeutic efficacy of combination of ALO and YM101. A) H1299 cells were exposed to ALO (200 µм) in combination with NK‐92MI cells (Effector ‐to‐ target cell ratio = 5:1). Cell death was determined by propidium iodide (PI) staining. Cells were gated on FSC/SSC‐viability‐CD56‐negative (n = 3). B) Intracellular Granzyme B in H1299 cells was determined by flow cytometry. Cells were gated on FSC/SSC‐viability‐CD56‐negative (n = 4). C) Analysis of Granzyme B+ NK cells and Perforin+ NK cells in tumors and spleens of LLC‐derived subcutaneous tumor mouse models from each group was conducted by flow cytometry (n = 5). D) Schematic diagram of tumor inoculation and injection protocol in LLC‐derived subcutaneous tumor mouse models (n = 5). E) Image of LLC‐derived subcutaneous tumors. F) Weights of tumors in LLC‐derived subcutaneous tumor mouse models (n = 5). Data in A,B) and F) are presented as mean ± SD, and p values were calculated using one‐way ANOVA. Data in C) are presented as mean ± SD, and p values were determined by two‐tailed unpaired Student's t‐test. ns, not significant; *p < 0.05, **p < 0.01, ***p < 0.001.
Figure 9
Figure 9
Schematic depiction about the antitumor effects of ALO in NSCLC.

References

    1. Guo W., Du K., Luo S., Hu D., Front. Oncol. 2022, 12, 861959. - PMC - PubMed
    1. Bagherniya M., Butler A. E., Barreto G. E., Sahebkar A., Ageing Res. Rev. 2018, 47, 183. - PubMed
    1. Takamura A., Komatsu M., Hara T., Sakamoto A., Kishi C., Waguri S., Eishi Y., Hino O., Tanaka K., Mizushima N., Genes Dev. 2011, 25, 795. - PMC - PubMed
    1. Malhotra J., Jabbour S., Orlick M., Riedlinger G., Guo Y., White E., Aisner J., Cancer Treat. Resear. Communicat. 2019, 21, 100158. - PubMed
    1. Vietri M., Radulovic M., Stenmark H., Nat. Rev. Mol. Cell Bio. 2020, 21, 25. - PubMed

MeSH terms