. 2024 Oct 14;52(18):11301-11316.
doi: 10.1093/nar/gkae703.

Structural basis for difunctional mechanism of m-AMSA against African swine fever virus pP1192R

Affiliations

Structural basis for difunctional mechanism of m-AMSA against African swine fever virus pP1192R

Ruili Liu et al. Nucleic Acids Res. .

Erratum in

Abstract

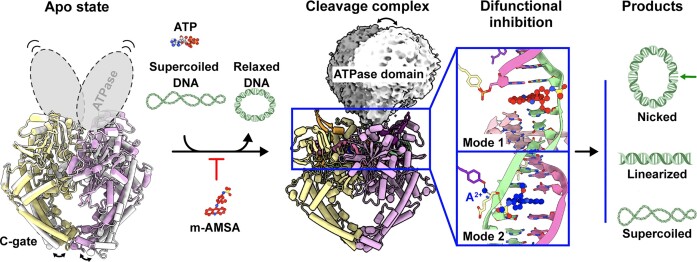
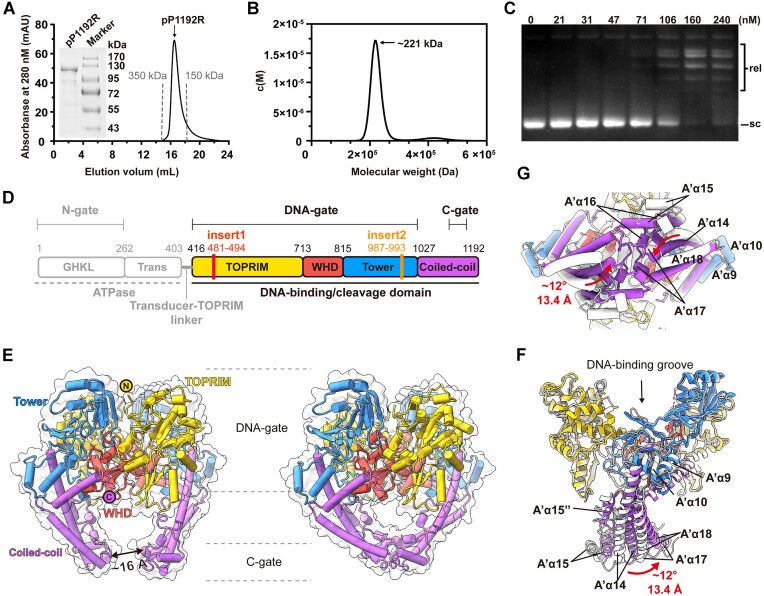
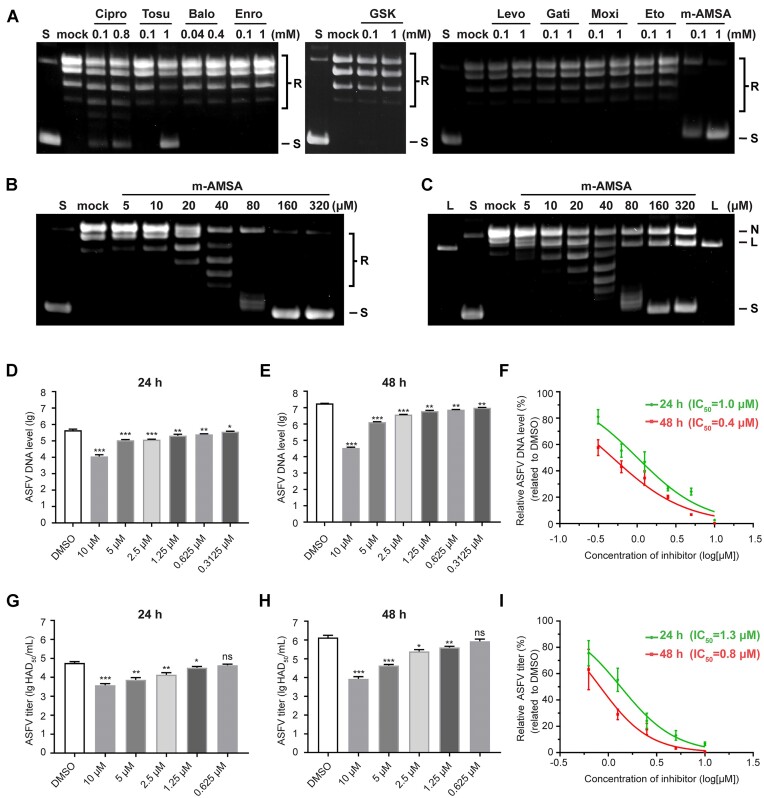
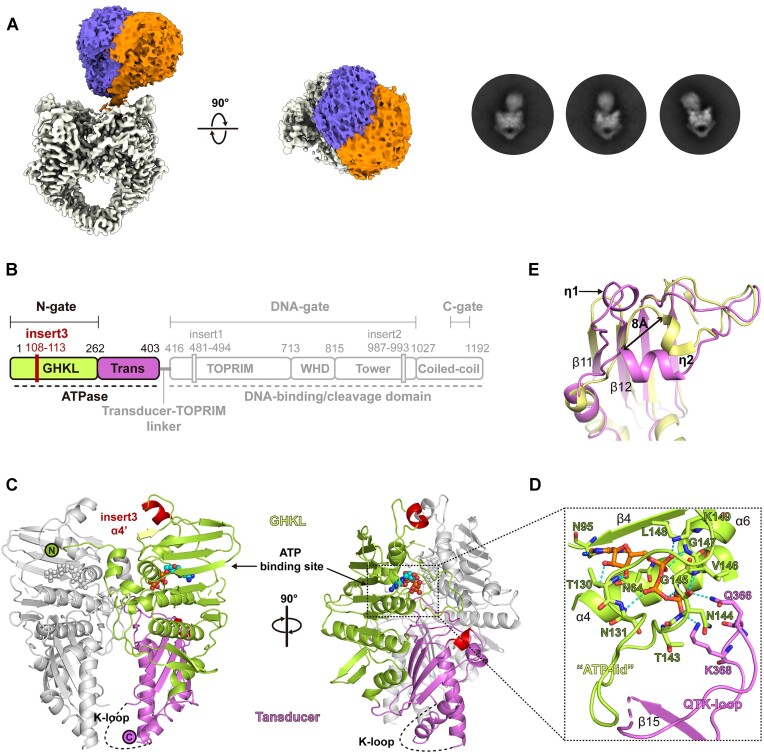
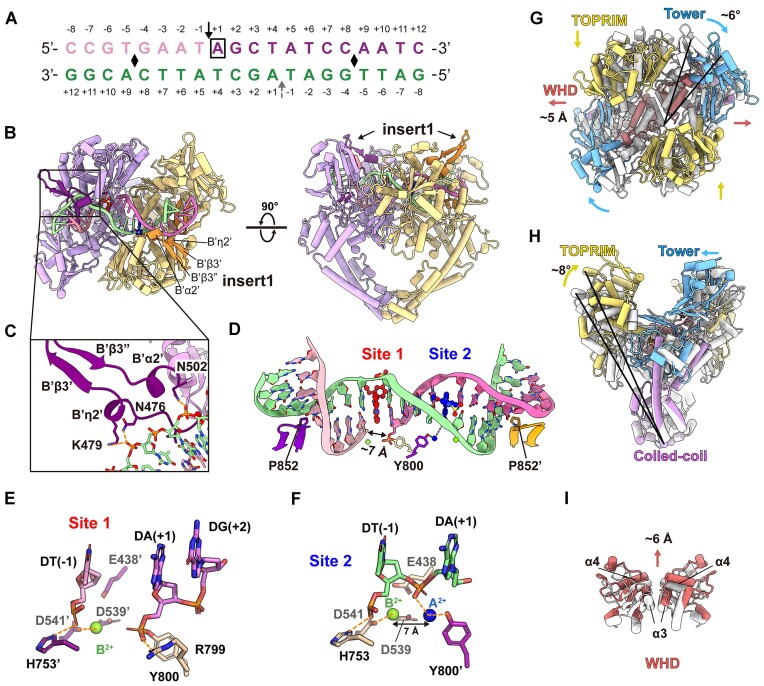
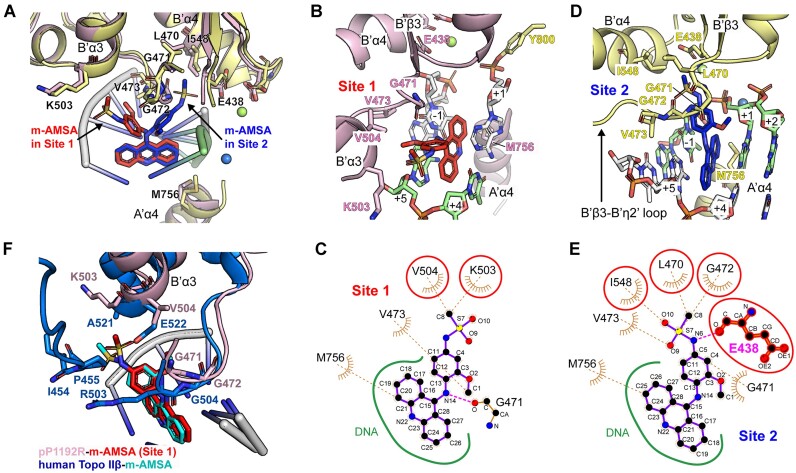
The African swine fever virus (ASFV) type II topoisomerase (Topo II), pP1192R, is the only known Topo II expressed by mammalian viruses and is essential for ASFV replication in the host cytoplasm. Herein, we report the structures of pP1192R in various enzymatic stages using both X-ray crystallography and single-particle cryo-electron microscopy. Our data structurally define the pP1192R-modulated DNA topology changes. By presenting the A2+-like metal ion at the pre-cleavage site, the pP1192R-DNA-m-AMSA complex structure provides support for the classical two-metal mechanism in Topo II-mediated DNA cleavage and a better explanation for nucleophile formation. The unique inhibitor selectivity of pP1192R and the difunctional mechanism of pP1192R inhibition by m-AMSA highlight the specificity of viral Topo II in the poison binding site. Altogether, this study provides the information applicable to the development of a pP1192R-targeting anti-ASFV strategy.


Figures

Graphical Abstract
Graphical Abstract
Figure 1.
Figure 1.
Biochemical characteristics and overall architectures of ASFV pP1192R in the apo state. (A) The gel filtration profile of pP1192R protein is shown in black, with gray dotted lines marking the elution peaks of two standard proteins. (B) Sedimentation velocity profile of pP1192R. Sedimentation coefficient distributions c(M) calculated from the sedimentation velocity profile with the calculated molecular weight shown. (C) Relaxation assays catalyzed by pP1192R. pP1192R was tested at increasing concentrations as indicated above each lane. Relaxed (rel) and supercoiled (sc) forms of DNA are indicated. (D) The schematic representation of pP1192R. Functional domains, dimerization gates, and sequence insertions are labeled. The domain organization of the DNA binding/cleavage domain is highlighted. (E) The overall structures of dimeric pP1192R DNA binding/cleavage domain, featuring its C-gate in either the open (left) or closed (right) state. Each domain shown in the cartoon representation is colored as in (D) and the surface representation is colored white. (F and G) Conformational changes of the pP1192R C-gate between open (white) and closed (colored as shown in (D)). The secondary structural elements are labelled according to Supplementary Figure 2C.
Figure 2.
Figure 2.
Evaluation of representative Topo II poisons in pP1192R inhibition and the effect of m-AMSA on ASFV replication. (A and B) Evaluation of representative Topo II inhibitors in pP1192R blockade by relaxation assays. The final concentrations of drugs are shown. For the initial experiment (A), certain drugs were not evaluated at 1 mM due to solubility constraints and were instead tested at their highest concentration without drug precipitation. Fluoroquinolones are all abbreviated by omitting the suffix ‘floxacin’. The complete designations for GSK and Eto are GSK299423 and etoposide, respectively. S and R, supercoiled and relaxed DNA gel markers, respectively. Mock represents the control experiments containing the same volume of DMSO instead of drugs. (C) The formation of the cleaved complex induced by m-AMSA is assessed by the cleavage assay. The final concentrations of drugs are shown. Linear (L), nicked (N) and supercoiled (S) forms of DNA are labelled. Mock represents the control experiments containing the same volume of DMSO instead of drugs. (D–F) Effect of m-AMSA on virus replication evaluated by ASFV DNA levels. The p72 gene level (n = 6) after 24 h (D) or 48 h (E) treatment with m-AMSA is assessed by qPCR and the IC50s are calculated (F). Data were compared to DMSO. (G–I) Effect of m-AMSA on infectious virion yield evaluated by HAD assays. The yield of infectious virions (n = 3) after 24 h (G) or 48 h (H) treatment with m-AMSA is evaluated by HAD assays and the HAD50s are calculated (I). Data were compared to DMSO. Data indicate the mean ± s.d. P values were analyzed with two-tailed unpaired t test (NS, not significant, P > 0.05; ∗, P< 0.05; ∗∗, P < 0.01; ∗∗∗, P < 0.001).
Figure 3.
Figure 3.
Structure of the pP1192R ATPase domain. (A) 3D and 2D classification demonstrates the flexibility of the ATPase domain relative to the DNA-binding/cleavage domain. (B) The schematic representation of pP1192R. Functional domains, dimerization gates and sequence insertions are labeled. The domain organization of the ATPase domain is highlighted. (C) The dimeric structure of the ATPase domain of pP1192R. The domains in one protomer are colored as in (B), while the other protomer is colored gray. The α4’ helix (insert3) and η1 helix are highlighted in red. The ATP binding site is indicated by a dashed square. (D) Close-up view of the ATP binding site. Amino acids involved in hydrogen bonds and salt bridges with the AMP-PNP are shown as sticks and labelled. (E) Structural superimposition of the ATPase domains in pP1192R (yellow) and S. cerevisiae Topo II (purple) reveals the distinct conformation of the η2 helix in pP1192R ATPase domain.
Figure 4.
Figure 4.
Structure of the pP1192R–DNA–m-AMSA complex. (A) DNA substrate used for structural study. The cleavage sites are indicated by solid black arrow (at Site 1) and dashed grey arrow (at Site 2), respectively. Positive and negative numbers (+1 to +12 and –1 to –8) designate nucleotides downstream and upstream of the scissile phosphate, respectively, with the +1 nucleotide (boxed) at Site 1 forming a phosphotyrosyl linkage with Y800. Black diamonds indicate DNA bend points. (B) Orthogonal views of the pP1192R–DNA–m-AMSA complex. One protomer is shown in purple and the other in yellow. The two insert1 regions and the DNA duplex are highlighted. (C) Close-up views of the β-hairpin. Key amino acid side chains interacting with DNA are shown as sticks and labeled. Orange dashed lines depict hydrogen bonds. (D) Zoomed-in view of the DNA duplex configuration bent by pP1192R. The P852 inserted into the DNA minor groove is shown in stick and the DNA duplex is color as in (A). Two m-AMSA molecules are shown in red (at Site 1) and blue (at Site 1), respectively. Mg2+ ions are indicated by green spheres. (E and F) The positions of Mg2+ ions at post- (E) and pre-cleavage (F) sites, illustrating DNA (colored as in (D)), Mg2+ ions, catalytic amino acids (E…DxD) and metal coordination (indicated by orange dashed lines). (G–I) Structural superimposition of the pP1192R–DNA–m-AMSA complex and the apo structure (the C-gate closed state) reveals the conformational changes in DNA-contacting regions. The individual domains in the pP1192R–DNA–m-AMSA complex structure are colored as in Figure 1, while the apo structure is colored white.
Figure 5.
Figure 5.
Structural basis for dual modes of pP1192R inhibition by m-AMSA. (A) Structural superimposition of Site 1 and Site 2. The two protomers are pink and yellow, with m-AMSA red in Site 1 and blue in Site 2. The key residues involved in m-AMSA–pP1192R interaction are shown as sticks. (B and D) Detailed view of drug-protein interaction at Site 1 (B) and Site 2 (D). Key residues involved in m-AMSA-pP1192R interaction are shown and labelled. Mg2+ ions are depicted as spheres. (C and E) LigPlot analysis of drug-protein interaction at Site 1 (C) and Site 2 (E). The residue E438, which is involved in hydrogen bonding, is shown as a sphere and a stick, and the amino acids that differ at the two interaction sites are circled in red. (F) Structural superimposition of m-AMSA-binding sites in human Topo IIβ (PDB code: 4G0U) and pP1192R (Site 1).

References

    1. Zheng Y., Li S., Li S.H., Yu S., Wang Q., Zhang K., Qu L., Sun Y., Bi Y., Tang F.et al. .. Transcriptome profiling in swine macrophages infected with African swine fever virus at single-cell resolution. Proc. Natl. Acad. Sci. U.S.A. 2022; 119:e2201288119. - PMC - PubMed
    1. Gaudreault N.N., Madden D.W., Wilson W.C., Trujillo J.D., Richt J.A.. African swine fever virus: an emerging DNA arbovirus. Front. Vet. Sci. 2020; 7:215. - PMC - PubMed
    1. Alonso C., Borca M., Dixon L., Revilla Y., Rodriguez F., Escribano J.M., Ictv Report Consortium. ICTV virus taxonomy profile: asfarviridae. J. Gen. Virol. 2018; 99:613–614. - PubMed
    1. Liu S., Luo Y., Wang Y., Li S., Zhao Z., Bi Y., Sun J., Peng R., Song H., Zhu D.et al. .. Cryo-EM structure of the African swine fever virus. Cell Host Microbe. 2019; 26:836–843. - PubMed
    1. Alonso C., Galindo I., Cuesta-Geijo M.A., Cabezas M., Hernaez B., Munoz-Moreno R.. African swine fever virus-cell interactions: from virus entry to cell survival. Virus Res. 2013; 173:42–57. - PMC - PubMed

LinkOut - more resources