

Primary Sulfate Is the Dominant Source of Particulate Sulfate during Winter in Fairbanks, Alaska
- PMID: 39166537
- PMCID: PMC10928653
- DOI: 10.1021/acsestair.3c00023
Primary Sulfate Is the Dominant Source of Particulate Sulfate during Winter in Fairbanks, Alaska
Abstract
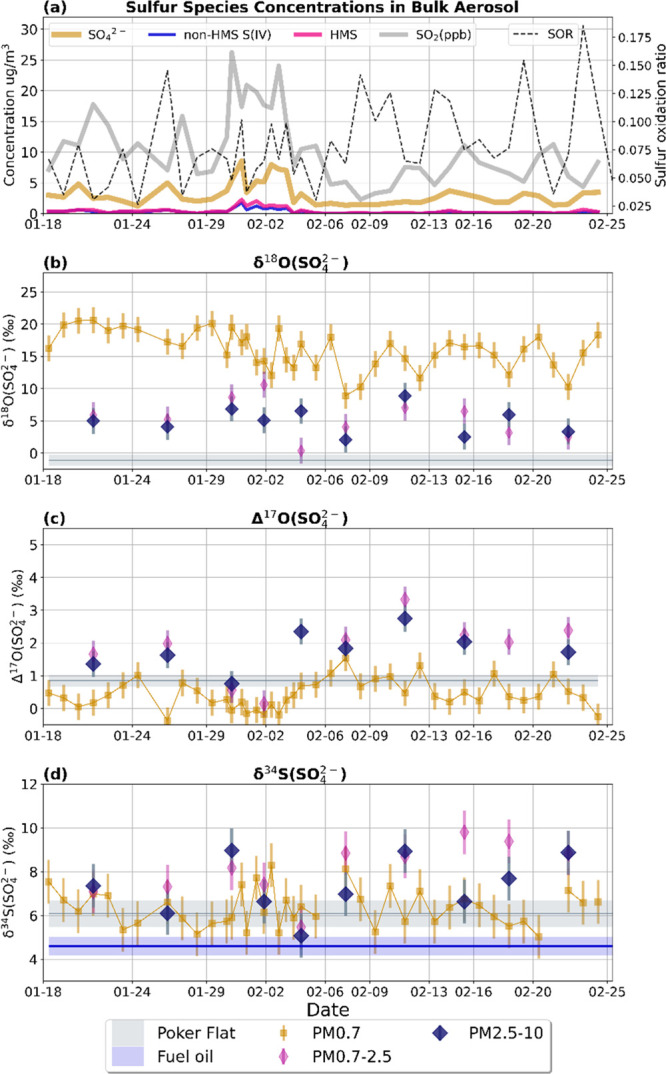
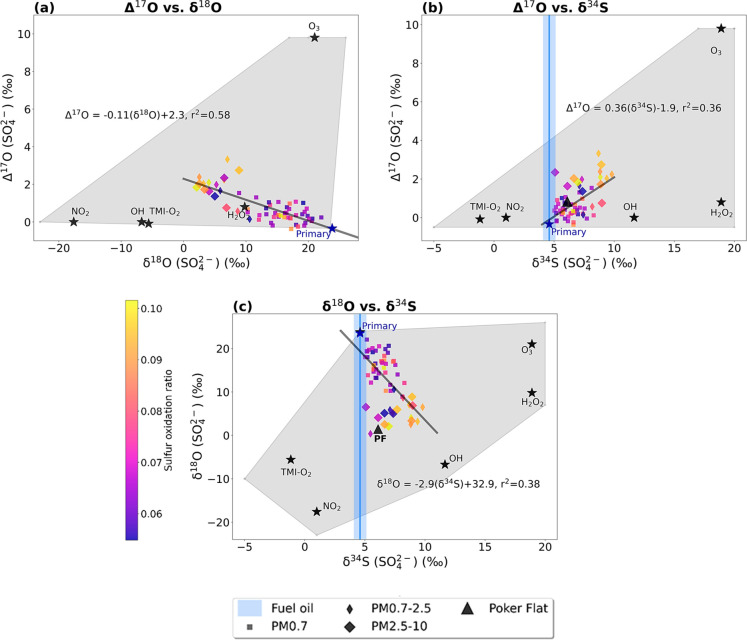
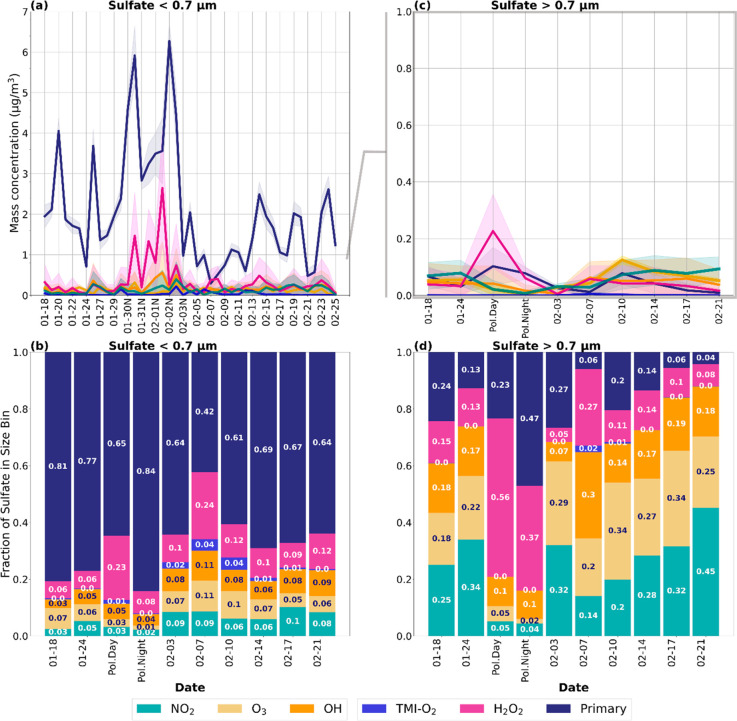
Within and surrounding high-latitude cities, poor air quality disturbs Arctic ecosystems, influences the climate, and harms human health. The Fairbanks North Star Borough has wintertime particulate matter (PM) concentrations that exceed the Environmental Protection Agency's (EPA) threshold for public health. Particulate sulfate (SO4 2-) is the most abundant inorganic species and contributes approximately 20% of the total PM mass in Fairbanks, but air quality models underestimate observed sulfate concentrations. Here we quantify sulfate sources using size-resolved δ34S(SO4 2-), δ18O(SO4 2-), and Δ17O(SO4 2-) of particulate sulfate in Fairbanks from January 18th to February 25th, 2022 using a Bayesian isotope mixing model. Primary sulfate contributes 62 ± 12% of the total sulfate mass on average. Most primary sulfate is found in the size bin with a particle diameter < 0.7 μm, which contains 90 ±5% of total sulfate mass and poses the greatest risk to human health. Oxidation by all secondary formation pathways combined contributes 38 ± 12% of total sulfate mass on average, indicating that secondary sulfate formation is inefficient in this cold, dark environment. On average, the dominant secondary sulfate formation pathways are oxidation by H2O2 (13 ± 6%), O3 (8 ± 4%), and NO2 (8 ± 3%). These findings will inform mitigation strategies to improve air quality and public health in Fairbanks and possibly other high-latitude urban areas during winter.
© 2023 The Authors. Published by American Chemical Society.
Conflict of interest statement
The authors declare no competing financial interest.
Figures
References
-
- Beelen R.; Hoek G.; Raaschou-Nielsen O.; Stafoggia M.; Andersen Z. J.; Weinmayr G.; Hoffmann B.; Wolf K.; Samoli E.; Fischer P. H.; Nieuwenhuijsen M. J.; Xun W. W.; Katsouyanni K.; Dimakopoulou K.; Marcon A.; Vartiainen E.; Lanki T.; Yli-Tuomi T.; Oftedal B.; Schwarze P. E.; Nafstad P.; De Faire U.; Pedersen N. L.; Östenson C.-G.; Fratiglioni L.; Penell J.; Korek M.; Pershagen G.; Eriksen K. T.; Overvad K.; Sørensen M.; Eeftens M.; Peeters P. H.; Meliefste K.; Wang M.; Bueno-de-Mesquita H. B.; Sugiri D.; Krämer U.; Heinrich J.; de Hoogh K.; Key T.; Peters A.; Hampel R.; Concin H.; Nagel G.; Jaensch A.; Ineichen A.; Tsai M.-Y.; Schaffner E.; Probst-Hensch N. M.; Schindler C.; Ragettli M. S.; Vilier A.; Clavel-Chapelon F.; Declercq C.; Ricceri F.; Sacerdote C.; Galassi C.; Migliore E.; Ranzi A.; Cesaroni G.; Badaloni C.; Forastiere F.; Katsoulis M.; Trichopoulou A.; Keuken M.; Jedynska A.; Kooter I. M.; Kukkonen J.; Sokhi R. S.; Vineis P.; Brunekreef B. Natural-Cause Mortality and Long-Term Exposure to Particle Components: An Analysis of 19 European Cohorts within the Multi-Center ESCAPE Project. Environ. Health Perspect. 2015, 123 (6), 525–533. 10.1289/ehp.1408095. - DOI - PMC - PubMed
-
- Philip S.; Martin R. V.; van Donkelaar A.; Lo J. W.-H.; Wang Y.; Chen D.; Zhang L.; Kasibhatla P. S.; Wang S.; Zhang Q.; Lu Z.; Streets D. G.; Bittman S.; Macdonald D. J. Global Chemical Composition of Ambient Fine Particulate Matter for Exposure Assessment. Environ. Sci. Technol. 2014, 48 (22), 13060–13068. 10.1021/es502965b. - DOI - PMC - PubMed
LinkOut - more resources
Full Text Sources
Research Materials