. 2024 Sep 17;9(9):e0084924.
doi: 10.1128/msystems.00849-24. Epub 2024 Aug 21.

Pangenomic landscapes shape performances of a synthetic genetic circuit across Stutzerimonas species

Affiliations

Pangenomic landscapes shape performances of a synthetic genetic circuit across Stutzerimonas species

Dennis Tin Chat Chan et al. mSystems. .

Abstract

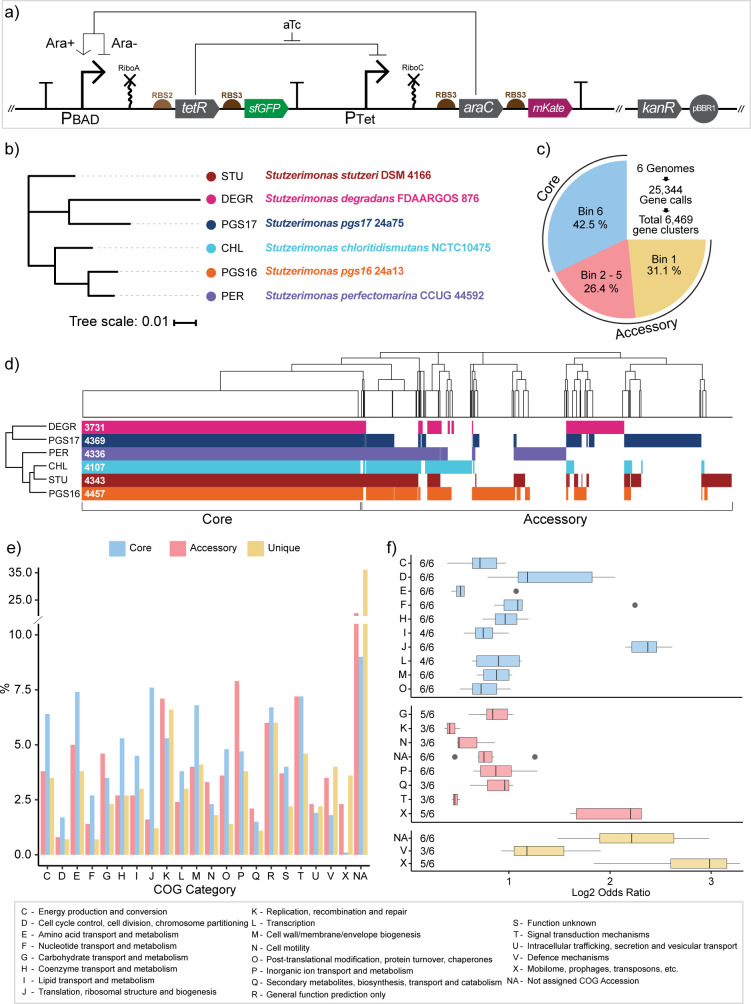
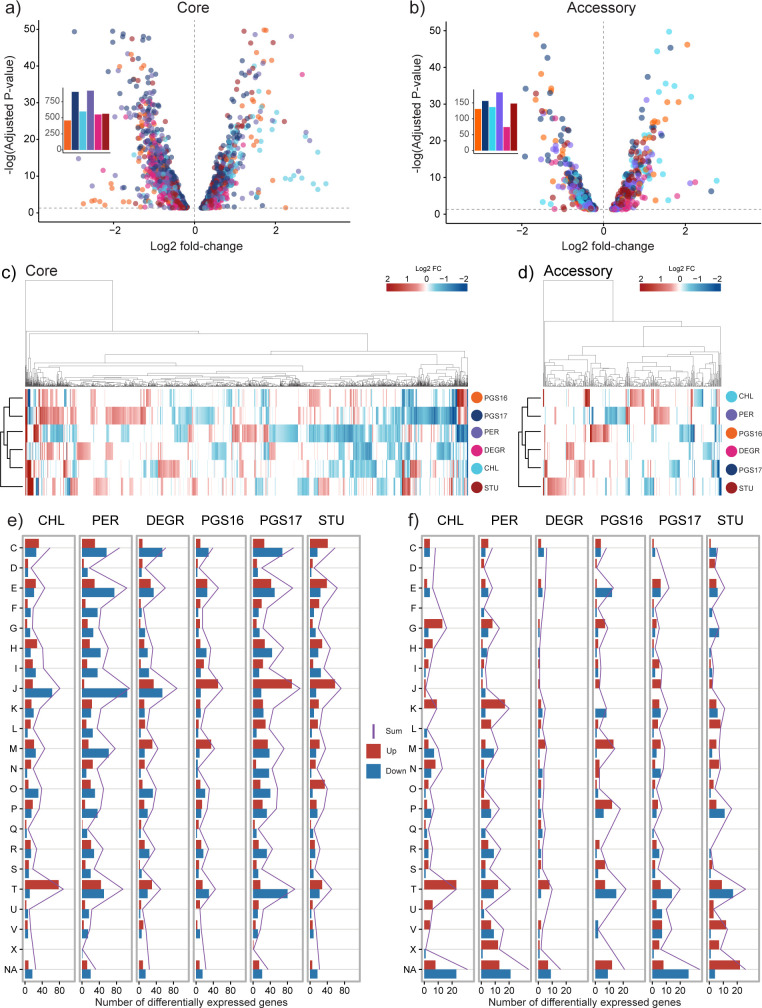
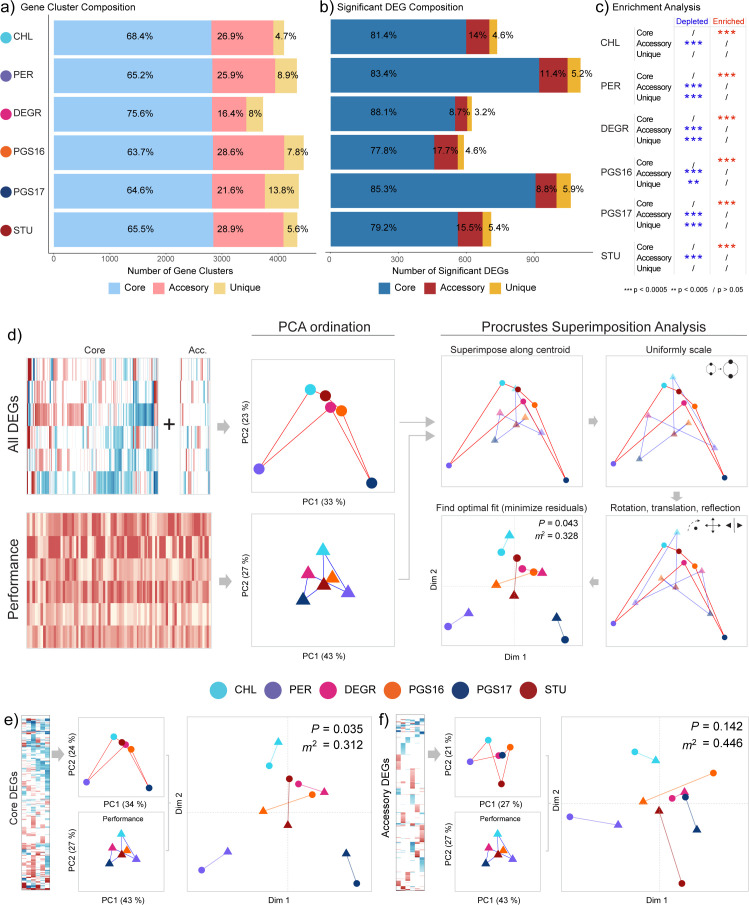
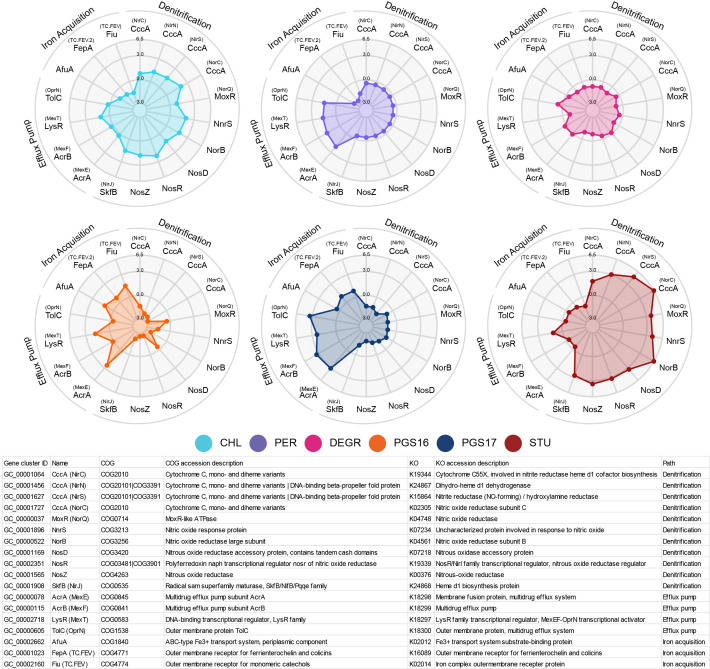
Engineering identical genetic circuits into different species typically results in large differences in performance due to the unique cellular environmental context of each host, a phenomenon known as the "chassis-effect" or "context-dependency". A better understanding of how genomic and physiological contexts underpin the chassis-effect will improve biodesign strategies across diverse microorganisms. Here, we combined a pangenomic-based gene expression analysis with quantitative measurements of performance from an engineered genetic inverter device to uncover how genome structure and function relate to the observed chassis-effect across six closely related Stutzerimonas hosts. Our results reveal that genome architecture underpins divergent responses between our chosen non-model bacterial hosts to the engineered device. Specifically, differential expression of the core genome, gene clusters shared between all hosts, was found to be the main source of significant concordance to the observed differential genetic device performance, whereas specialty genes from respective accessory genomes were not significant. A data-driven investigation revealed that genes involved in denitrification and components of trans-membrane transporter proteins were among the most differentially expressed gene clusters between hosts in response to the genetic device. Our results show that the chassis-effect can be traced along differences among the most conserved genome-encoded functions and that these differences create a unique biodesign space among closely related species.IMPORTANCEContemporary synthetic biology endeavors often default to a handful of model organisms to host their engineered systems. Model organisms such as Escherichia coli serve as attractive hosts due to their tractability but do not necessarily provide the ideal environment to optimize performance. As more novel microbes are domesticated for use as biotechnology platforms, synthetic biologists are urged to explore the chassis-design space to optimize their systems and deliver on the promises of synthetic biology. The consequences of the chassis-effect will therefore only become more relevant as the field of biodesign grows. In our work, we demonstrate that the performance of a genetic device is highly dependent on the host environment it operates within, promoting the notion that the chassis can be considered a design variable to tune circuit function. Importantly, our results unveil that the chassis-effect can be traced along similarities in genome architecture, specifically the shared core genome. Our study advocates for the exploration of the chassis-design space and is a step forward to empowering synthetic biologists with knowledge for more efficient exploration of the chassis-design space to enable the next generation of broad-host-range synthetic biology.

Keywords: biodesign; broad-host-range; chassis-effect; context dependence; genetic inverter; host-circuit interactions; non-model organism; procrustean superimposition; synthetic biology; transcriptomics.


Conflict of interest statement

The authors declare no conflict of interest.

Figures

Fig 1
Fig 1
The genetic inverter and pangenome of selected Stutzerimonas hosts. (a) Schematic representation of Ara-aTc genetic inverter design. In the presence of Ara (Ara+), Ara-bound AraC upregulates its cognate promoter (PBAD), leading to sfGFP and TetR expression and, in turn, creates a distinct measurable fluorescent state and leads to the downregulation of the PTet promoter. In the absence of Ara (Ara-), AraC functions as a repressor. The presence of aTc leads to mKate and AraC production. The two promoters thereby act antagonistically, where the upregulation of one leads to the downregulation of the other. (b) Inferred phylogenomic tree of the six Stutzerimonas hosts. The scale bar is in units of the number of amino acid substitutions per site between two sequences. (c) Composition of core, accessory, and unique gene clusters from pangenome analysis (Anvi’o) of our six Stutzerimonas species. Bin 6 means all six hosts contribute with at least one gene call to the gene cluster and Bin 5 means any combination of five hosts contribute with at least one gene call and so on. Bin 5 to Bin 1 are grouped as the accessory genome, with gene clusters belonging to Bin 1 further distinguished as unique. Percentages indicate the portion of the 6,469 gene clusters assigned to the three frequency groups (core, accessory, and unique). (d) Clustered presence/absence matrix of the 6,469 orthologous gene clusters with columns representing gene clusters. The number indicates the number of gene calls for each host. (e) Percentage composition of cluster of orthologous genes (COG) categories of core, accessory, and unique group. (f) Enrichment analysis of COG categories within each frequency group by Fisher exact test. “n/6” indicates the number of hosts in which COG category was found significantly (P-value < 0.05, Bonferroni correction) enriched within the group. Only COG categories enriched in three or more hosts are shown. Gray points represent outliers. COG category description is provided at the bottom of the figure. CHL = Stutzerimonas chloritidismutans NCTC10475; PER = Stutzerimonas perfectomarina CCUG 44592; DEGR = Stutzerimonas degradans FDAARGOS 876; PGS16 = Stutzerimonas pgs16 24a13, PGS17 = Stutzerimonas pgs17 24a75; STU = Stutzerimonas stutzeri DSM 4166.
Fig 2
Fig 2
The chassis-effect is observed through the measurable performance of the genetic inverter between closely related Stutzerimonas hosts. (a) aTc induction curves, the left-most plot shows all induction curves overlaid up to a given inducer concentration. All induction curves to the right show individual curves with scaled axes. Hosts are color-coded, error bars indicate standard error of the mean, n = 8. (b) Estimated Hill parameters from aTc induction curves. Color scale relative to each column. (c) Ara induction curves and (d) estimated Hill parameters. (e) OD600 normalized fluorescence dynamics of one of three toggle assays with induction scheme 0.75 mM Ara and 20 nM aTc. Initial OFF cells were diluted to respective induction states. (f) Estimated fluorescence metrics from fluorescence in (e) across induction state and fluorescence output type. (g) Fluorescence dynamics of toggled cells diluted to respective opposite inducer and (h) estimated fluorescence metrics. DR = dynamic range; NI = no induction; Fss = late phase steady-state fluorescence; Rate = max specific rate; DRs = specific dynamic range.
Fig 3
Fig 3
The growth dynamics are uniquely affected as a result of the host-specific operation of the genetic inverter. (a) Growth curves of initial OFF cells diluted to respective induction states. Hosts are color-coded. (b) Estimated growth metrics for each host from growth curves in (a). The color scale is relative to each column, as for all subsequent subpanels. (c) Growth curves of toggled cells diluted to respective opposite inducer to toggle induction state and (d) corresponding estimated growth metrics. (e) Boxplots of growth difference between host genotypes and/or induction state captured by the Δµ metric, defined as a relative percentage change in growth rate. Whiskers indicate minimum and maximum values. (f) Table overview of metrics from (e). WT = wild type, BB23 = pBBR1, and KanR cloning vector. pS5NI = pS5 plasmid in the absence of an inducer. pS5Ara = pS5 plasmid in the presence of Ara (0.75 mM), pS5aTc = pS5 plasmid in the presence of aTc (20 nM). NI = no induction; µ = max specific growth rate; A = carrying capacity; λ = lag time.
Fig 4
Fig 4
The chassis-effect is measurable in the differential response of genes designed into the engineered genetic inverter. Log2 fold-change values of the six genes encoded in the pS5 plasmid between hosts comparing Ara against aTc-induced cells. An empty position indicates a non-significant differential expression.
Fig 5
Fig 5
Global differential gene expression analysis of Ara against aTc-induced cells reveals diverse transcriptional profiles as a result of inverter operation. Volcano plots visualizing log2 fold-change distribution of significant DEGs in (a) core genome and (b) accessory genome. Inset bar charts show the number of differentially expressed genes for each host. Clustered heatmap of log2 fold-change values of (c) core and (d) accessory gene clusters significantly expressed by at least one host (P-value < 0.05, Benjamini and Hochberg adjusted). White bars indicates non-significant expression in the host. For the accessory genome, white bars indicates either non-significance or the gene cluster has no hits for that host. The distribution of DEGs across COG categories and hosts is shown for both (e) core and (f) accessory. DEGs are further grouped into upregulated (red bars) and downregulated (blue bar) gene clusters within each COG category. The purple line denotes the sum of the number of DEGs.
Fig 6
Fig 6
Procrustes analysis reveals significant concordance between similarity in inverter performance and similarity in core genome response between hosts. (a) Composition of each host’s genome in terms of core, accessory, and unique gene clusters. (b) Composition of significantly differentially expressed gene clusters in terms of core, accessory, and unique gene clusters. (c) Enrichment analysis results by Fisher exact test, testing for depletion (underrepresentation) and enrichment (overrepresentation) for the three frequency groups for each host. (d) Procrustes superimposition analysis comparing hosts in terms of all significant differential gene expression responses against inverter device performance metrics. For the accessory genome, unique gene clusters were omitted to reduce artificial inflation of distance. The key steps in PS analysis are schematically illustrated. Performance metric data set and differential gene expression data set are first projected onto ordinate space via PCA, then the configurations are compared through PS analysis, which involves centering, scaling, and transforming the two projections to minimize the sum of squared vector residuals (the m2 statistic) between each respective point (host). The significance of the obtained statistic is determined through a permutation method. Colored lines between points have been added to visualize an arbitrary “configuration” formed by each data set, which connects each point in the following arbitrary order “-CHL-PER-DEGR-PGS16-PGS17-STU-.” PS analysis comparing inverter performance against significantly differentially expressed (e) core and (f) accessory gene clusters. P = P-value, m2 = Gower statistic.
Fig 7
Fig 7
Gene clusters containing the most highly differentially expressed genes between hosts. Spider plots showing log2 fold-change data of most highly differentially expressed gene clusters between the hosts. Gene names in parentheses are names provided by KO annotation, all other gene names are provided by the annotated COG accession. In cases where the gene name provided by COG and KO match, only one gene name is shown.

Similar articles

Cited by

References

    1. McBride CD, Del Vecchio D. 2021. Predicting composition of genetic circuits with resource competition: demand and sensitivity. ACS Synth Biol 10:3330–3342. doi:10.1021/acssynbio.1c00281 - DOI - PubMed
    1. Adams BL. 2016. The next generation of synthetic biology chassis: moving synthetic biology from the laboratory to the field. ACS Synth Biol 5:1328–1330. doi:10.1021/acssynbio.6b00256 - DOI - PubMed
    1. Khan N, Yeung E, Farris Y, Fansler SJ, Bernstein HC. 2020. A broad-host-range event detector: expanding and quantifying performance between Escherichia coli and Pseudomonas species. Synth Biol 5:ysaa002. doi:10.1093/synbio/ysaa002 - DOI
    1. Ke J, Yoshikuni Y. 2020. Multi-chassis engineering for heterologous production of microbial natural products. Curr Opin Biotechnol 62:88–97. doi:10.1016/j.copbio.2019.09.005 - DOI - PubMed
    1. Calero P, Nikel PI. 2019. Chasing bacterial chassis for metabolic engineering: a perspective review from classical to non-traditional microorganisms. Microb Biotechnol 12:98–124. doi:10.1111/1751-7915.13292 - DOI - PMC - PubMed

MeSH terms

LinkOut - more resources