. 2024 Nov 1;110(11):6883-6897.
doi: 10.1097/JS9.0000000000002031.

Genomic landscape of gallbladder cancer: insights from whole exome sequencing

Affiliations

Genomic landscape of gallbladder cancer: insights from whole exome sequencing

Supriya Awasthi et al. Int J Surg. .

Abstract

Background: Gallbladder cancer (GBC) is a common gastrointestinal malignancy noted for its aggressive characteristics and poor prognosis, which is mostly caused by delayed detection. However, the scarcity of information regarding somatic mutations in Indian patients with GBC has hampered the development of efficient therapeutic options. In the present study, the authors attempted to bridge this gap by revealing the mutational profile of GBC.

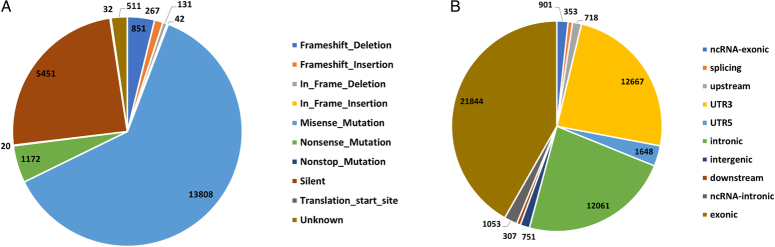
Materials and methods: To evaluate the somatic mutation profile, whole exome sequencing (WES) was performed on 66 tumor and matched blood samples from individuals with GBC. Somatic variant calling was performed using GATK pipeline. Variants were annotated at pathogenic and oncogenic levels, using ANNOVAR, VEP tools and the OncoKB database. Mutational signature analysis, oncogenic pathway analysis and cancer driver genes identification were performed at the functional level by using the maftools package.

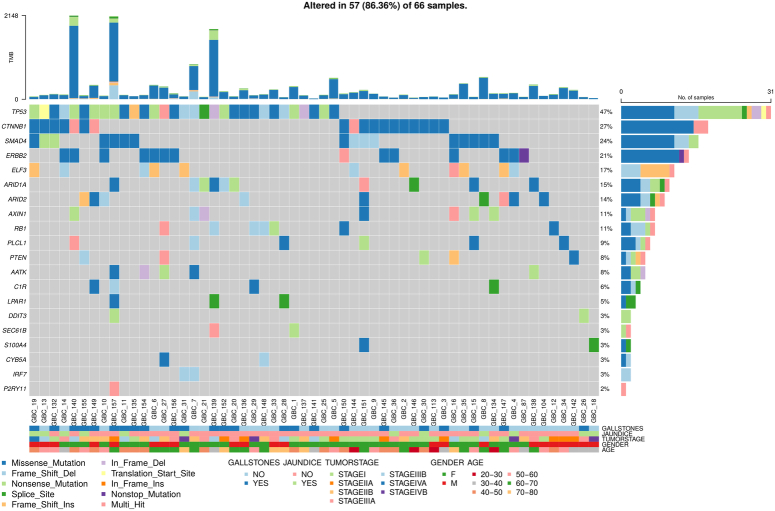
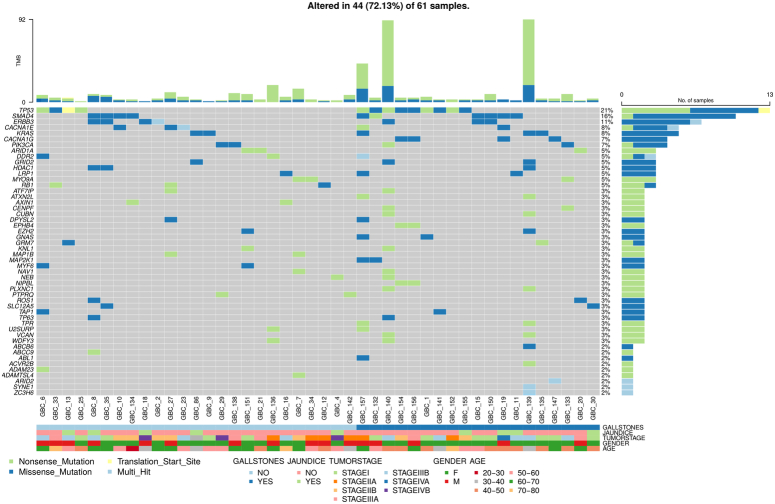
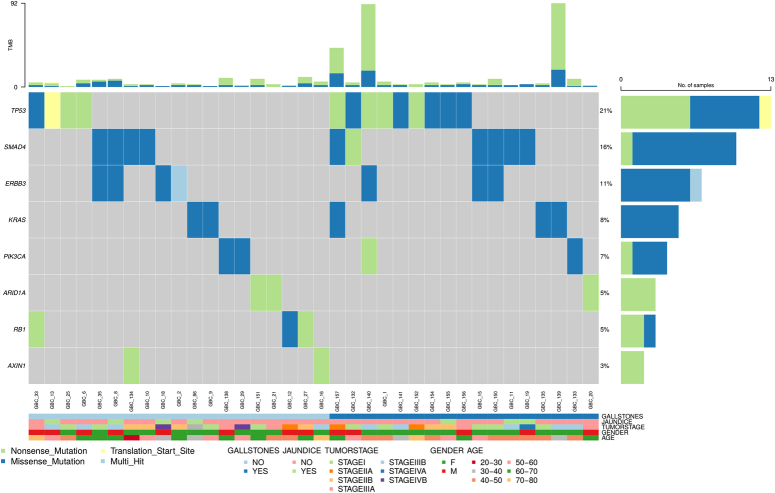
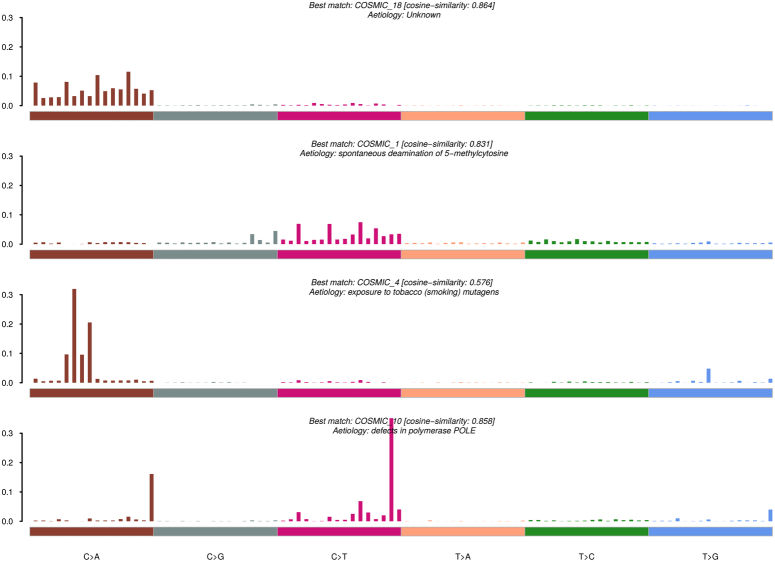
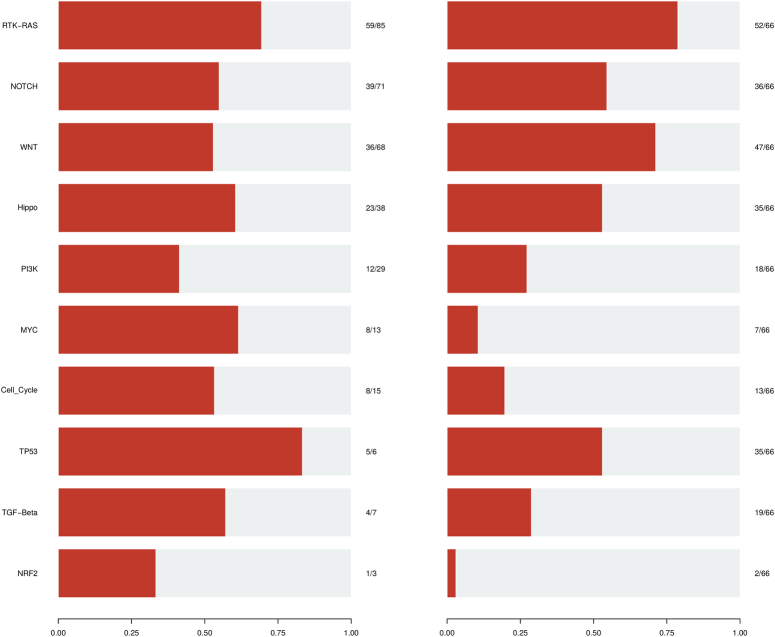
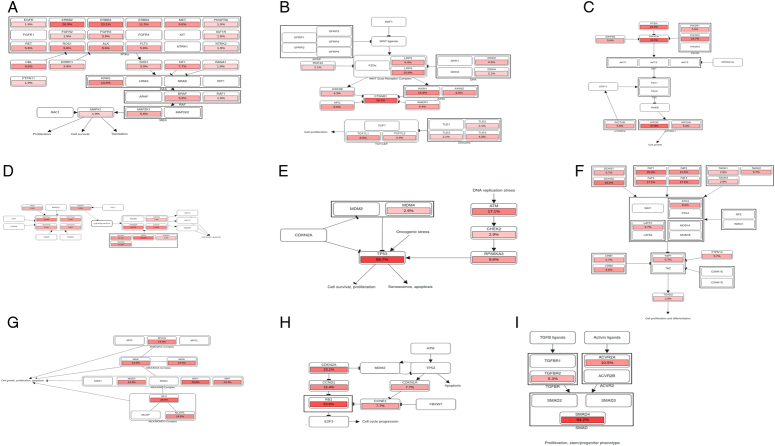
Results: Our findings focused on the eight most altered genes with pathogenic and oncogenic mutations: TP53, SMAD4, ERBB3, KRAS, ARID1A, PIK3CA, RB1, and AXIN1. Genes with pathogenic single nucleotide variations (SNVs) were enriched in oncogenic signaling pathways, particularly RTK-RAS, WNT, and TP53 pathways. Furthermore, our research related certain mutational signatures, such as cosmic 1, cosmic 6, and cosmic 18, 29, to known characteristics including patient age and tobacco smoking, providing important insights into disease etiology.

Conclusions: Given the scarcity of exome-based sequencing studies focusing on the Indian population, this study represents a significant step forward in providing a framework for additional in-depth mutational analysis. Genes with substantial oncogenic and pathogenic mutations are promising candidates for developing targeted mutation panels, particularly for GBC detection.


Conflict of interest statement

The authors declare that they have no financial conflict of interest with regard to the content of this report.

Figures

Figure 1
Figure 1
Distribution of Somatic variants in 66 GBC Samples. (A) Types of mutations identified in GBC cohort. Highest occurence of Missense mutation is observed. (B) Classification of overall variants observed in GBC samples. Exonic variants are highest in number followed by the UTR3 regions and intronic regions.
Figure 2
Figure 2
Oncoplot illustrating the top genes with potential driver variants, correlated with sample, age, sex, tumor stage, gallstone presence, and jaundice status in 57 GBC samples. Each column represents a distinct GBC sample, while each row denotes a specific gene. Colored squares indicate altered genes, whereas grey squares signify non-mutated genes. Variants are color-coded according to their mutation types. Genes marked as "Multi_Hit" denote those with multiple mutations within the same sample. The barplot at the top shows the tumor mutation burden (TMB), with colors representing different mutation types.
Figure 3
Figure 3
Oncoplot showing pathogenic gene variants and their distribution among 44 out of 61 gallbladder cancer (GBC) samples. These genes were selected based on ACMG classification, highlighting pathogenic and likely pathogenic variants. The gene variants are correlated with clinical features, including age, sex, tumor stage, gallstone, and jaundice status. Each column represents a GBC sample, and each row corresponds to a specific gene. Colored squares indicate mutated genes, while grey squares represent non-mutated genes. Different mutation types are distinguished by various colors. Genes marked as "Multi_Hit" contain more than one mutation in the same sample. The barplot at the top displays tumor mutation burden (TMB), color-coded by mutation type, while the barplot on the right shows the number of patients with mutations in each gene.
Figure 4
Figure 4
Oncoplot depicting the distribution of eight prevalent genes—TP53, SMAD4, ERBB3, KRAS, PIK3CA, ARID1A, RB1, and AXIN1—within the GBC cohort. These genes, mutated in at least two GBC samples, are noted for their oncogenic mutations which have implications for therapy, diagnosis, and prognosis. Gene variants are correlated with sample, age, sex, tumor stage, and status of gallstones and jaundice. Each column represents a distinct GBC sample, and each row corresponds to a specific gene. Colored squares indicate altered genes, while grey squares denote non-mutated genes.
Figure 5
Figure 5
Mutational signatures identified in GBC cohort. The y-axis represents the exposure of 96 trinucleotide motifs to overall signatures. The plot information indicates the best match against validated COSMIC signatures, and cosine similarity value along with proposed aetiology.
Figure 6
Figure 6
Prevalence of Somatic mutation burden in our population(GBC, n=66- highlighted in red color) compared to 33 TCGA cohorts. Each dot represents a single patient sample. The horizontal grey lines indicate the median number of mutations in each cancer category. Vertical axes (log scaled) showed the number of mutations per megabase.
Figure 7
Figure 7
Overview of known altered oncogenic signaling pathways in GBC cohort. (Left) plot represents the fraction of oncogenic pathway affected and (Right) plot represents the fraction of GBC samples affected.
Figure 8
Figure 8
(A) Alteration of RTK-RAS pathway in GBC cohort. (B) Alteration of WNT pathway in GBC cohort. (C) Alteration of PI3K pathway in GBC cohort. (D) Alteration of NOTCH pathway in GBC cohort. (E) Alteration of TP53 pathway in GBC cohort. (F) Alteration of Hippo pathway in GBC cohort. (G) Alteration of MYC pathway in GBC cohort. (H) Alteration of Cell_Cycle pathway in GBC cohort. (I) Alteration of TGF-Beta pathway in GBC cohort. The color intensity represented the alteration frequency of pathway members. An arrow indicated an activation; without an arrow represented the binding activity; a bar at the end of an edge indicated an inhibitory interaction.

References

    1. Ghidini M, Pizzo C, Botticelli A, et al. . Biliary tract cancer: current challenges and future prospects. Cancer Manag Res 2019;11:379–388. - PMC - PubMed
    1. Valle J, Wasan H, Palmer DH, et al. . Cisplatin plus gemcitabine versus gemcitabine for biliary tract cancer. N Engl J Med 2010;362:1273–1281. - PubMed
    1. Koshiol J, Bellolio E, Vivallo C, et al. . Distribution of dysplasia and cancer in the gallbladder: an analysis from a high cancer-risk population. Hum Pathol 2018;82:87–94. - PMC - PubMed
    1. Mondaca S, Schultz N, Roa JC, et al. . Clinical and genomic characterization of ERBB2-altered gallbladder cancer. J Clin Oncol 2022;40:4114. - PMC - PubMed
    1. Butti AK, Yadav SK, Verma A, et al. . Chronic calculus cholecystitis: is histopathology essential post-cholecystectomy? Indian J Cancer 2020;57:89–92. - PubMed