Review
. 2024 Oct 7;221(10):e20230893.
doi: 10.1084/jem.20230893. Epub 2024 Aug 21.

Transcriptional network dynamics in early T cell development

Affiliations
Review

Transcriptional network dynamics in early T cell development

Boyoung Shin et al. J Exp Med. .

Abstract

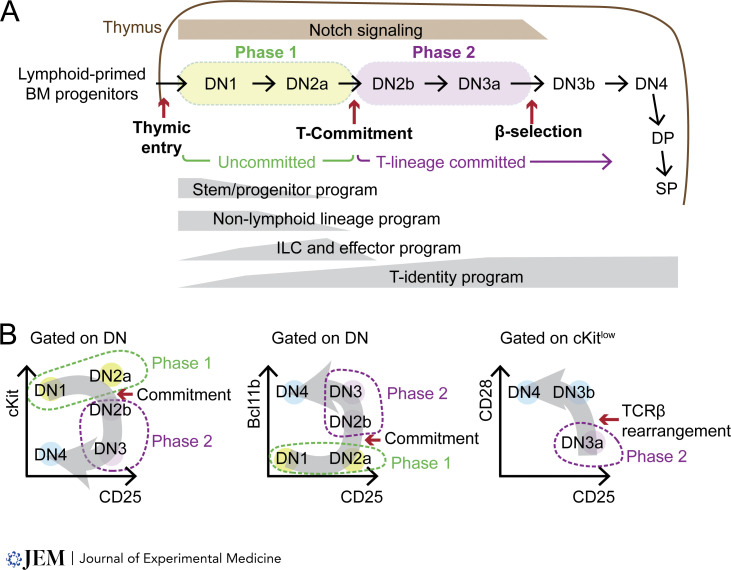
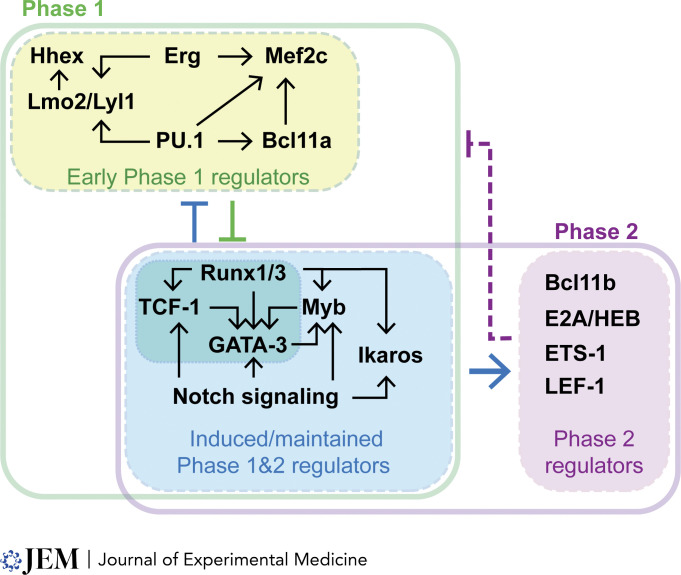
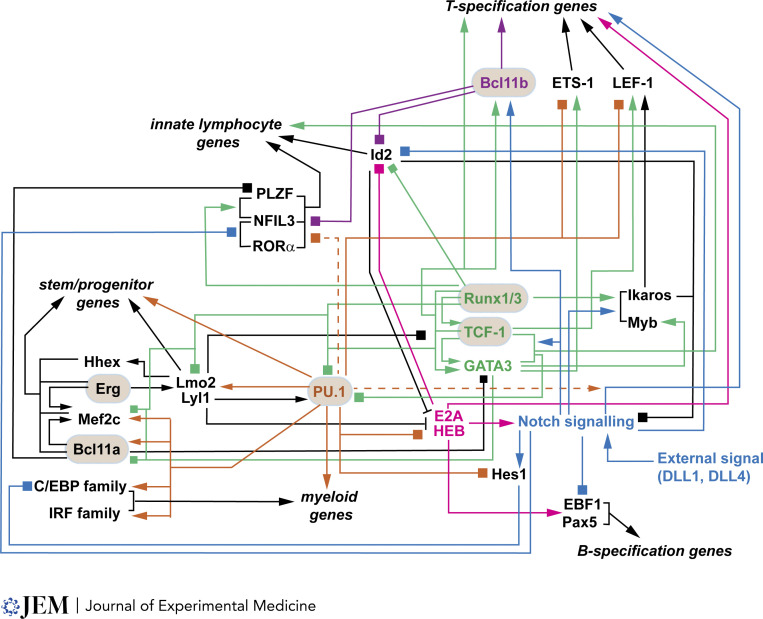
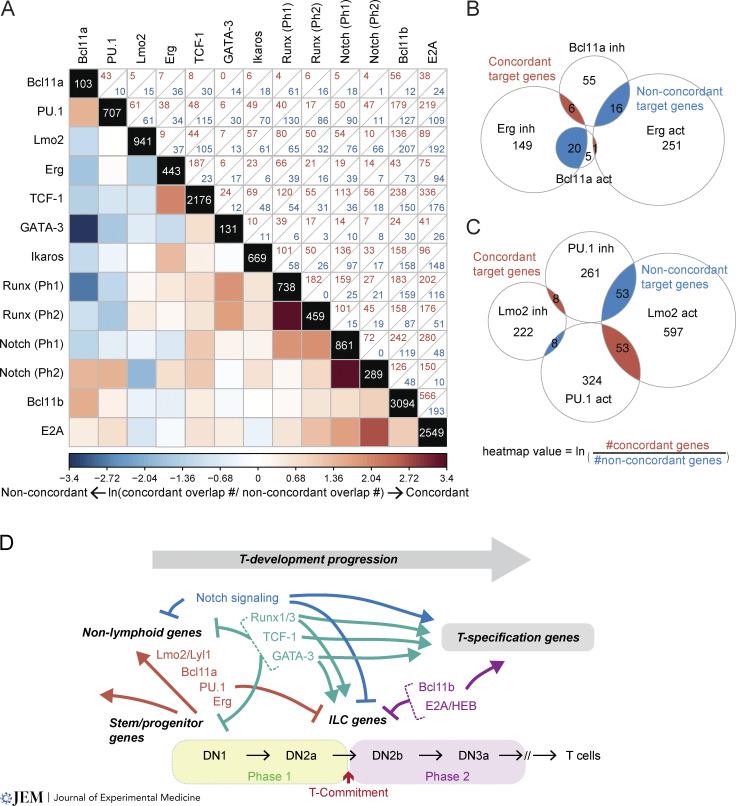
The rate at which cells enter the T cell pathway depends not only on the immigration of hematopoietic precursors into the strong Notch signaling environment of the thymus but also on the kinetics with which each individual precursor cell reaches T-lineage commitment once it arrives. Notch triggers a complex, multistep gene regulatory network in the cells in which the steps are stereotyped but the transition speeds between steps are variable. Progenitor-associated transcription factors delay T-lineage differentiation even while Notch-induced transcription factors within the same cells push differentiation forward. Progress depends on regulator cross-repression, on breaching chromatin barriers, and on shifting, competitive collaborations between stage-specific and stably expressed transcription factors, as reviewed here.


Conflict of interest statement

Disclosures: E.V. Rothenberg was on the Scientific Advisory Board for Century Therapeutics, Inc. until January 2023. The advisory work that she did for them does not have any overlap with material in the present article. The other authors have no disclosures to report.

Figures

Figure 1.
Figure 1.
Early thymic T cell development stages and gene expression programs. (A) The diagram shows different T cell developmental stages from bone marrow (BM) progenitors entering the thymus and progressing through DN, double positive (DP), and single positive (SP) stages. The focus of this review, Phase 1 (uncommitted) and Phase 2 (T-lineage committed but not yet assembled TCR β) are shown in green and purple bubbles. The instructive Notch signaling strengths are shown in light brown color. The kinetics and amplitude of different gene expression programs are represented in gray boxes at the bottom. (B) The informative protein markers utilized to identify different DN stages are shown with flow cytometry plot diagrams. The gray arrows represent developmental progression directions. Critical checkpoints (e.g., T-lineage commitment, β-selection) are also shown.
Figure 2.
Figure 2.
Distinct groups of TFs shaping the Phase 1 and Phase 2 gene networks. TFs critically regulating Phase 1 (green) and Phase 2 (purple) transcriptional states are shown in the overview; for detailed relationships, see Fig. 3. TFs with similar expression kinetics are displayed in the same-colored box (green, early Phase 1-expressed TFs; blue, TFs present in both Phase 1 and Phase 2; purple, TFs show high activities in Phase 2). Thin arrows indicate positive (→) or negative () regulatory inputs between the TFs. Thick arrows represent broad regulatory effects by the sum of TFs’ activities. The dashed purple arrow shows negative inputs toward the early Phase 1 program (green).
Figure 3.
Figure 3.
Gene regulatory network connections within cells transitioning from the uncommitted, thymic precursor stage to a committed T cell stage. Displayed connections reflect interactions between early Phase 1 regulators (Hhex, Erg, Mef2c, Lmo2/Lyl1, PU.1, Bcl11a), induced/maintained Phase 1 and 2 regulators (Runx1/3, TCF-1, GATA3, Myb, Ikaros, Notch signaling), and Phase 2 regulators (Bcl11b, E2A/HEB, ETS-1, LEF-1), under conditions of Notch signaling. All relationships shown represent functional gene expression impacts of perturbations of individual regulators; curated data from Shin and Rothenberg (2023). Arrows: positive regulation; boxes: negative regulation; bar end: inhibition of DNA binding; broken lines: weaker effects. Colors highlight core subsets of interactions centered around PU.1 (orange), E proteins (magenta), Notch signaling (blue), Runx/TCF-1/GATA3 (green), and Bcl11b (purple). “Speed regulators” discussed in this review are in tan bubbles: Bcl11b, Runx1/3, and TCF-1 have network contributions to both the innate lymphocyte program and the T-specification program, while PU.1 network contributions reach the stem/progenitor, myeloid, T cell specification, and innate lymphocyte programs. PU.1 has additional repressive effects when Notch signaling is reduced. Erg and Bcl11a are related to the PU.1 network, but less is known about their contributions to the other programs.
Figure 4.
Figure 4.
Converging and opposing actions of TF pairs on shared target genes. (A) The heatmap illustrates converging (more red) or opposing (more blue) activities of two TFs on their common targets as a natural log of the ratio between numbers of genes that are regulated concordantly (both TFs activate or both inhibit) versus non-concordantly (one activates and the other inhibits). Zero counts were replaced with 0.5 for logarithmic transformation, and natural log ratio values are shown from −3.4 to 3.4. Numbers in diagonal boxes display the total numbers of target genes for each TF. Upper right boxes enumerate joint targets with concordant (red) or non-concordant (blue) effects. Targets were determined in these studies: Zhou et al., (2022) for Bcl11a, PU.1, Erg, TCF-1, GATA-3; Ungerbäck et al. (2018) for PU.1; Hirano et al. (2021) for Lmo2; Arenzana et al. (2015) for Ikaros; Shin et al. (2021) and Shin et al. (2023) for Runx1 and Runx3 (Phase 1 DEGs include both gain-of-function and loss-of-function targets); Romero-Wolf et al. (2020) for Notch; Hosokawa et al. (2018b) for Bcl11b; and Miyazaki et al. (2017) and Xu et al. (2013) for E2A. (B and C) Area-proportional Venn diagrams provide examples of how TFs converge or oppose each other’s gene regulation and how the heatmap values are calculated. (B) Erg and Bcl11a: non-concordant target genes include Lmo2, Mef2c, Dntt, Egfl7 (Erg-inhibited, Bcl11a-activated), Nrgn, Gzmb, Thy1, and Cdkn1a (Erg-activated, Bcl11a-inhibited). (C) PU.1 and Lmo2: non-concordant target genes include T- and ILC-associated genes such as Tcf7, Zbtb16, Pou2af1, Gzma, Cxcr5 (PU.1-inhibited, Lmo2-activated), and Cd24a (PU.1-activated, Lmo2-inhibited). (D) Summary: T cell program emerges from a balance between T-specification and progenitor factors; roles of specific regulators distinguish between T and ILC programs.

References

    1. Alonzo, E.S., Gottschalk R.A., Das J., Egawa T., Hobbs R.M., Pandolfi P.P., Pereira P., Nichols K.E., Koretzky G.A., Jordan M.S., et al. 2010. Development of promyelocytic zinc finger and ThPOK-expressing innate γδ T cells is controlled by strength of TCR signaling and Id3. J. Immunol. 184:1268–1279. 10.4049/jimmunol.0903218 - DOI - PMC - PubMed
    1. Anderson, G., Jenkinson W.E., Jones T., Parnell S.M., Kinsella F.A., White A.J., Pongrac’z J.E., Rossi S.W., and Jenkinson E.J.. 2006. Establishment and functioning of intrathymic microenvironments. Immunol. Rev. 209:10–27. 10.1111/j.0105-2896.2006.00347.x - DOI - PubMed
    1. Anderson, M.K., Hernandez-Hoyos G., Diamond R.A., and Rothenberg E.V.. 1999. Precise developmental regulation of Ets family transcription factors during specification and commitment to the T cell lineage. Development. 126:3131–3148. 10.1242/dev.126.14.3131 - DOI - PubMed
    1. Arenzana, T.L., Schjerven H., and Smale S.T.. 2015. Regulation of gene expression dynamics during developmental transitions by the Ikaros transcription factor. Genes Dev. 29:1801–1816. 10.1101/gad.266999.115 - DOI - PMC - PubMed
    1. Aster, J.C., Blacklow S.C., and Pear W.S.. 2011. Notch signalling in T-cell lymphoblastic leukaemia/lymphoma and other haematological malignancies. J. Pathol. 223:262–273. 10.1002/path.2789 - DOI - PMC - PubMed

LinkOut - more resources