. 2024 Oct 15;150(16):1268-1287.
doi: 10.1161/CIRCULATIONAHA.124.069864. Epub 2024 Aug 21.

Integrative Multiomics in the Lung Reveals a Protective Role of Asporin in Pulmonary Arterial Hypertension

Affiliations

Integrative Multiomics in the Lung Reveals a Protective Role of Asporin in Pulmonary Arterial Hypertension

Jason Hong et al. Circulation. .

Erratum in

  • Correction to: Integrative Multiomics in the Lung Reveals a Protective Role of Asporin in Pulmonary Arterial Hypertension.
    Hong J, Medzikovic L, Sun W, Wong B, Ruffenach G, Rhodes CJ, Brownstein A, Liang LL, Aryan L, Li M, Vadgama A, Kurt Z, Schwantes-An TH, Mickler EA, Gräf S, Eyries M, Lutz KA, Pauciulo MW, Trembath RC, Perros F, Montani D, Morrell NW, Soubrier F, Wilkins MR, Nichols WC, Aldred MA, Desai AA, Trégouët DA, Umar S, Saggar R, Channick R, Tuder RM, Geraci MW, Stearman RS, Yang X, Eghbali M. Hong J, et al. Circulation. 2025 Apr 8;151(14):e921. doi: 10.1161/CIR.0000000000001331. Epub 2025 Apr 7. Circulation. 2025. PMID: 40193543 No abstract available.

Abstract

Background: Integrative multiomics can elucidate pulmonary arterial hypertension (PAH) pathobiology, but procuring human PAH lung samples is rare.

Methods: We leveraged transcriptomic profiling and deep phenotyping of the largest multicenter PAH lung biobank to date (96 disease and 52 control) by integration with clinicopathologic data, genome-wide association studies, Bayesian regulatory networks, single-cell transcriptomics, and pharmacotranscriptomics.

Results: We identified 2 potentially protective gene network modules associated with vascular cells, and we validated ASPN, coding for asporin, as a key hub gene that is upregulated as a compensatory response to counteract PAH. We found that asporin is upregulated in lungs and plasma of multiple independent PAH cohorts and correlates with reduced PAH severity. We show that asporin inhibits proliferation and transforming growth factor-β/phosphorylated SMAD2/3 signaling in pulmonary artery smooth muscle cells from PAH lungs. We demonstrate in Sugen-hypoxia rats that ASPN knockdown exacerbated PAH and recombinant asporin attenuated PAH.

Conclusions: Our integrative systems biology approach to dissect the PAH lung transcriptome uncovered asporin as a novel protective target with therapeutic potential in PAH.

Keywords: gene expression profiling; multiomics; pulmonary arterial hypertension.


Conflict of interest statement

Drs Hong, Medzikovic, and Eghbali are coinventors of US provisional patent application 63/544,027, “Asporin in Pulmonary Hypertension.”

Figures
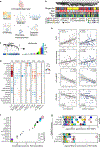
Fig. 1:
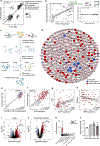
Fig. 1:. Co-expression network analysis reveals modules associated with PAH severity and genetic risk.
a, Schematic of integrative analytical strategy centered around co-expression modules. b, Unsupervised hierarchical clustering of PHBI lung transcriptomes: 17,567 genes after filtering the bottom 25% of genes with the least variation across samples. Samples are annotated by age, sex, race, and diagnosis. c, Gene clustering dendrogram on the left as determined by WGCNA with color module assignments shown at the bottom. Bar plot on the right showing number of genes in each module. d, Heatmap showing significant (P < 0.05) Pearson correlations of module eigengenes with clinical and pathologic characteristics where red and blue indicate positive and negative correlation, respectively. Module eigengenes were directionally aligned to average expression of module genes prior to correlation analysis. Larger size dots indicate stronger correlation. No. hospitalizations indicates number of hospitalizations due to PAH between the time of diagnostic RHC and lung transplantation. R heart failure signs indicate signs of right heart failure such as ascites or leg swelling. Intima and intima plus media thickness were determined by morphometric analysis of volume density of pulmonary arteries in histological lung sections. e, Scatter plots showing PAH lung samples plotted by the pink (left) or royalblue (right) module eigengene on the x-axis and select clinicopathologic characteristics on the y-axis: PVR (Wood units), intimal thickness, NT-proBNP (pg/ml), and REVEAL mortality risk score. P values refer to Pearson correlation. f, Dot plot showing the normalized enrichment score (NES) of modules for the PAH lung differential transcriptome as determined by GSEA. Larger size dots indicate stronger FDR value. g, Dot plots showing enrichment of modules for PAH GWAS SNPs using two distinct computational methods, MAGMA (top), and GSA-SNP2 (bottom), across four independent PAH GWAS cohorts on the y-axis. Vertical red dotted lines indicate significance threshold. SNPs were mapped to genes by chromosomal proximity (within 20 kilobases from the 5’ or 3’ ends of a gene) and genes were scored for association with PAH based on disease-SNP P-value associations from GWAS summary statistics. Gene scores were then used in competitive gene-set analyses to identify module enrichment for PAH common genetic variation. To aggregate genetic variants into a gene score, the mean χ2 statistic and the log-minimum GWAS P value for all SNPs localizing to a gene were used in MAGMA and GSA-SNP2, respectively. To determine significance, MAGMA uses a linear mixed model whereas GSA-SNP2 uses a standard normal distribution. Both methods adjust for gene size and gene density (the number of SNPs assigned to a given gene). IPAH = idiopathic PAH; APAH = associated PAH; HPAH = hereditary PAH; PVOD = pulmonary veno-occlusive disease; WHO4 = WHO Group 4; WGCNA = weighted gene co-expression network analysis; GWAS = genome-wide association study; scRNAseq = single-cell RNA sequencing; Dx = diagnosis; PFT = pulmonary function test; RHC = right heart catheterization; Histo = histology; DLCO = diffusing capacity for carbon monoxide; FVC/DLCO = ratio of forced vital capacity to DLCO; mPAP = mean pulmonary artery pressure; PVR = pulmonary vascular resistance; REVEAL = Registry to Evaluate Early and Long-Term PAH Disease Management; cor = correlation; PAHB = US PAH Biobank; PHAAR = French Pulmonary Hypertension Allele-Associated Risk; BHFPAH = British Heart Foundation Pulmonary Arterial Hypertension; UK = UK National Institute for Health Research BioResource (NIHRBR); MAGMA = Multi-marker Analysis of GenoMic Annotation; FDR = false discovery rate.
Fig. 2:
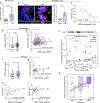
Fig. 2:. Pink and royalblue modules associate with vascular cell types.
a, Schematic of deconvolution analysis. To serve as a cell type reference for deconvolution, seven publicly available human lung single-cell RNAseq datasets were integrated and reclustered in Seurat with cell-type clusters identified using known marker genes from the literature. Within each cell-type cluster, the average expression of gene counts was calculated across cells within each individual sample. These sample-specific averages were preserved to create cell-type signatures for each sample. These signatures were then used as biological replicates in CIBERSORTx for each of the seven datasets. PHBI bulk transcriptomes were then deconvoluted with CIBERSORTx with cell-type signatures from each of the seven datasets as a reference. The resulting cell fractions using each of the seven dataset-specific reference signatures served as technical replicates. These technical replicates were then averaged to determine the final estimated cell fractions for each lung sample. b, Uniform Manifold Approximation and Projection (UMAP) plot showing a custom integrated lung cell atlas totaling 559,511 cells and 37 cell types from 154 human lungs. c, Heatmap showing scaled expression of cell-type specific marker genes on the x-axis across all cell types in (b) on the y-axis. Larger size dots indicate higher fraction of cells expressing a given gene. d, Heatmap showing estimated cell fractions of PHBI lung samples by deconvolution. Dendrogram is shown at the top representing hierarchical clustering of lung samples (columns). Lung samples are annotated at the top to indicate PAH in red or control in grey. Cell types are annotated on the left corresponding to the colors in (b). e, PCA plot showing clustering of estimated cell fractions with lung samples colored to indicate PAH in red or control in grey. f, Heatmap showing Pearson correlation of deconvoluted cell fractions (columns) and module eigengenes (rows). Only correlations with P < 0.05 are shown. Larger size dots indicate higher absolute correlation. g, Scatter plots showing PHBI lung samples plotted by cell fractions of select vascular cell types on the y-axis and the pink (top) or royalblue (bottom) module eigengene on the x-axis. h, Heatmap showing GSEA normalized enrichment score (NES) of pink (left) or royalblue (right) signatures representing degree of enrichment in known gene signatures of 773 cell types across 23 tissues from the HubMAP Consortium. HubMAP signatures are annotated by endothelial cell (EC), smooth muscle cell (SMC), fibroblast (FB), pericyte, or “merged” which indicates all vascular cell types combined. HubMAP signatures are also annotated by whether the signature comes from lung tissue and whether the enrichment score was less than false discovery rate (FDR) of 0.05. AbbBasaloid = aberrant basaloid; AlvProgen = alveolar progenitor; AM = alveolar macrophage; AT1 = alveolar type 1; AT2 = alveolar type 2, cDC = conventional dendritic cell; cMono = classical monocyte; EndoArt = endothelial arterial; EndoBronch = endothelial bronchial; EndoCap1 = endothelial capillary 1; EndoCap2 = endothelial capillary 2; EndoLymph = endothelial lymphatic; EndoVein = endothelial vein; Fb = fibroblast; IM = interstitial macrophage; MacProlif = macrophage proliferating; MyoFb = myofibroblast; ncMono = nonclassical monocyte; NK = natural killer; pDC = plasmacytoid dendritic cell; PNEC = pulmonary neuroendocrine cell; SMC = smooth muscle cell; Tcd8 = CD8+ T cell; Tprolif = proliferating T cell; Treg = regulatory T cell; scRNAseq = single-cell RNA sequencing; qPCR = quantitative polymerase chain reaction. a, g, P values refer to Pearson correlation.
Fig. 3:
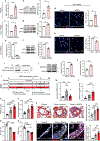
Fig. 3:. Pink and royalblue modules share PAH-relevant pathways, drug profiles and hub gene ASPN.
a, Scatter plot showing GSEA normalized enrichment score (NES) of pink (x-axis) and royalblue (y-axis) signatures using 320 annotated pathways from the Kyoto Encyclopedia of Genes and Genomes (KEGG) database. Larger size and lighter color dots indicate stronger statistical significance. Select pathways are labeled. b, Scatter plot showing Connectivity Map (CMap) scores of CMap drug classes against the query signature of PAH lung DEGs from the pink module on the x-axis and from either the royalblue module (left) or greenyellow module (right) on the y-axis. CMap classes group the perturbation profiles of 2,429 drugs based on shared mechanism of action. Scores approaching 100 or −100 indicate drugs predicted to mimic or reverse the query signature, respectively. Larger size dots indicate higher absolute mean score between pink and royalblue (left) or between pink and greenyellow (right). c, Schematic of Bayesian gene regulatory network (GRN) analysis workflow to construct a gene regulatory network of the human lung. GRNs were constructed using Reconstructing Integrative Molecular Bayesian Network (RIMBANet). 1000 networks were generated from different random seed genes using continuous and discrete expression data derived from transcriptomes from either GSE23546 (n = 1343), PHBI (n = 146), or GTEx v8 (n = 577). Whole lung-specific cis eQTLs from GTEx v8 and transcription factor-target gene data from HTRI, TRRUST, and PAZAR databases were used as priors. Then, the final network for each of the 3 datasets was obtained by taking a consensus network from the 1000 randomly generated networks whereby only edges that passed a probability of >30% across the 1000 GRNs were kept. Finally, the union of the 3 networks was taken to create a combined GRN derived from a total of 2,066 human lungs. d, Pink subnetwork of the lung GRN described in (c) where pink module genes and genes previously implicated in PAH are shown in pink and red, respectively. Known PAH genes were curated from disease-gene databases (Comparative Toxicogenomics Database and DisGeNET). Royalblue genes colocalizing within the pink subnetwork are also shown. Larger size nodes represent genes whose neighboring nodes are enriched for genes in the gene set of interest (i.e. pink gene set) as determined by Key Driver Analysis (KDA),,. Node size is proportional to -log10(FDR) as determined by KDA. Light grey nodes represent genes of the pink subnetwork that are neither pink, red, nor royalblue genes. e, Scatter plot showing pink module genes and royalblue module genes that colocalized in the pink subnetwork in (d) plotted by the Pearson correlation of their expression with PAH diagnosis (vs control) on the y-axis and the pink module eigengene on the x-axis. The top royalblue gene ASPN is labelled. f, Scatter plot showing PHBI lung samples plotted by expression of ASPN on the y-axis and pink module eigengene on the x-axis. Red triangles and grey squares represent PAH and control lungs, respectively. g,h, Scatter plots showing PAH lung samples plotted by PVR (Wood units) (g) or REVEAL mortality risk score (h) on the y-axis and ASPN expression on the x-axis. i,j, Volcano plots showing differential gene expression of PAH vs control in either PHBI lung samples (95 PAH and 51 control) (i) or laser micro-dissected pulmonary arteries (j) from a public microarray dataset derived from 6 IPAH and 6 donor lungs (GSE10704). Red and blue dots indicate up- or down-regulated genes, respectively, meeting a threshold of FDR < 0.05 (i) or unadjusted P value < 0.05 (j). k, Box plot showing expression of ASPN across cell types from the Tabula Sapiens single-cell lung reference atlas. Cell types are ordered by scaled expression of ASPN as shown in the heatmap below the box plot. l, ASPN mRNA levels as assessed by qPCR 6 hours after treatment of PAH PASMCs with increasing doses of bisindolylmaleimide IX, the top CDK inhibitor predicted from the CMap analysis in (b). a, b, e, f-h P values refer to Pearson correlation.
Fig. 4:
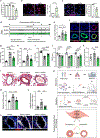
Fig. 4:. ASPN is upregulated in multiple PAH cohorts, correlates with favorable clinical characteristics, and may be under similar genetic regulation with a known PAH risk gene.
a, Upregulated ASPN mRNA expression in whole lung tissue of 34 PAH patients vs. 14 controls from the UCLA, Paris and PHBI cohorts, as detected by qPCR. b, Upregulated asporin immunofluorescence intensity colocalizing with SMA+ cells in the medial layer of distal pulmonary arteries in lung tissue sections of 9 PAH patients vs 9 controls from the PHBI cohort. Scale bars, 20μm. c, Correlation of asporin fluorescence intensity from (c) with mean pulmonary arterial pressure (mPAP). d, Elevated ASPN mRNA in whole blood of 359 WHO Group 1 PAH patients vs 72 age- and sex-matched healthy volunteers in a cohort from London. e, Correlation of ASPN mRNA in whole blood with cardiac output. f, Elevated asporin expression in the plasma of 51 PAH patients vs 23 controls from a second UCLA cohort. g-i, Correlations of plasma asporin levels from (f) with cardiac output, right ventricular fractional area change (RV FAC), and tricuspid annular plane systolic excursion (TAPSE). j, Dot plot showing correlation, i.e. linkage disequilibrium (LD), between previously reported SNP-trait associations and the top ASPN plasma pQTL reported in the literature, rs2761681 (-log10(P) = 490.7), which derived from the deCODE cohort of 35,559 Icelanders. A total of 552,116 SNP-trait associations curated in the NHGRI-EBI GWAS Catalog representing >20,000 traits from 5,750 published GWAS studies were filtered for associations with rs2761681 or with associated SNPs using default settings in LDlinkR R package (r2 > 0.1 within 500,000 base pairs of rs2761681) and the European population of the 1000 Genomes Project. Diamond shape indicates rs2761681. Square shape indicates other reported ASPN pQTLs: rs7848055 (P = 5×10−261), rs2516568 (P = 2×10−79), rs10820965 (P = 6×10−66). GDF2 plasma pQTL, rs7042335 (P = 1×10⁻²⁹), is labelled. SNP positions on chromosome 9 are shown on the x-axis. Gene locations are shown at the bottom. Dots are colored by strength of r2 with rs2761681. k, Overlay of scatter and box plots showing pulmonary arterial wall density as measured by morphometric analysis of PHBI lung tissue sections on the y-axis and the corresponding rs2761681 genotype on the x-axis. Genotypes homozygous for G were coded as 2, heterozygous for G coded as 1, and homozygous for the major allele A coded as 0. ASPN = asporin; PASMC = pulmonary artery smooth muscle cells; SMA = smooth muscle actin; TPM = transcript per million; LD = linkage disequilibrium; Chr = chromosome; pQTL = protein quantitative trait locus; Mbp = megabase pairs. Data presented as median±range (a,d,f), mean±SEM (b). Tested with Mann-Whitney test (a,d,f), student’s t-test (b), Pearson (c,f-i) and Spearman (e) correlation, and one-way ANOVA (k). *P < 0.05, **P < 0.01, ***P < 0.001, ****P < 0.0001.
Fig. 5.
Fig. 5.. ASPN is upregulated by PAH triggers and ASPN deficiency promotes PASMC proliferation, TGF-β signaling, and PAH in SuHx rats.
a,b, ASPN mRNA and protein are upregulated in PASMCs isolated from PAH vs donor lungs as detected by qPCR and Western blot. c,d, Hypoxia-induced upregulation of ASPN mRNA and protein in donor PASMCs as detected by qPCR and Western Blot. e,f, ASPN siRNA decreases ASPN mRNA and protein expression in PAH PASMCs as detected by qPCR and Western Blot. g, Enhanced proliferation in siASPN-treated PAH PASMCs as detected by Ki67 immunofluorescence staining. Scale bars, 10μm. h, Reduced apoptosis in siASPN-treated PAH PASMCs as detected by cleaved caspase 3 immunofluorescence staining. Scale bars, 10μm. i, Co-immunoprecipitation showing that asporin binds to TGF-β1 in PAH PASMCs. Representative results of three independent experiments. j, ASPN deficiency in PAH PASMCs promotes expression of TGF-β downstream effectors pSMAD2/3 as detected by Western Blot. k, Aspn mRNA is upregulated in whole lungs from SuHx (n = 4) vs control (n = 5) rats by qPCR. l, Experimental timeline of siASPN administration in the SuHx rat model. m, Aspn is upregulated in the lungs of siScrm-treated SuHx rats whereas siASPN-treated SuHx rats have similar Aspn expression to healthy control rats as detected by qPCR. n-q, siASPN-treated SuHx rats exhibit worsened RVSP as measured by right heart catheterization, RV hypertrophy as measured by Fulton index, RV FAC and PAAT as measured by echocardiography. r, In SuHx rat lungs, ELISA measurements showed an upregulation of TGF-β protein in siScramble-treated animals compared to controls, with levels further increasing after siASPN treatment. s, Enhanced thickening of the medial layer of distal pulmonary arteries in siASPN-treated SuHx rats, as assessed by Masson Trichrome histological staining. Scale bars, 20μm. t, Enhanced expression of TGF-β downstream effector pSMAD3 in SMA+ cells in distal pulmonary arteries of siASPN-treated SuHx rats, as assessed by immunofluorescence. Scale bars, 10μm. SMA = alpha smooth muscle actin; CC3 = cleaved caspase 3; PAAT = pulmonary arterial acceleration time; PASMC = pulmonary arterial smooth muscle cells; RHC = right heart catheterization; RVFAC = right ventricular fractional area change; RVSP = right ventricular systolic pressure; siASPN = ASPN silencing RNA; siScrm = scrambled silencing RNA; SuHx = Sugen-hypoxia. Data presented as mean±SEM, n=3–4 for in vitro experiments, n=8/group for in vivo experiments. Tested with student’s t-test or one-way ANOVA with Holm-Bonferroni posthoc correction. *P < 0.05, **P < 0.01, ***P < 0.001.
Fig. 6:
Fig. 6:. Recombinant asporin attenuates PASMC proliferation, TGF-β signaling, and PAH in SuHx rats.
a, rASPN induces dose-dependent inhibition of proliferation in PAH PASMCs in vitro as detected by CCK8 assay. b, Enhanced apoptosis in rASPN-treated PAH PASMCs as detected by cleaved caspase 3 (CC3) immunofluorescence staining. Scale bars, 10μm. c, Reduced expression of TGF-β downstream effectors pSMAD2/3 in rASPN-treated PAH PASMCs. Scale bars, 10μm. d, Experimental timeline of rASPN administration in the SuHx rat model. e, Upregulation of Aspn mRNA as measured by qPCR in saline-treated SuHx vs control lungs but no significant difference between rASPN-treated and saline-treated SuHx. Colors correspond to groups in (d). f, Validation of rASPN delivery into the lung vasculature as detected by immunofluorescence of the His tag that is fused to rASPN. His tag is expressed in the medial layer of distal pulmonary arteries in rASPN-treated, but not saline-treated or control rats. Representative images of all animals. g-j, rASPN-treated SuHx rats showed improved RVSP as measured by right heart catheterization, RV hypertrophy as measured by Fulton index, RV FAC and PAAT as measured by echocardiography. The horizontal dotted line in (j) represents the average PAAT of all rats in all three groups at baseline (prior to receiving Sugen and hypoxia). k, In SuHx rat lungs, ELISA measurements showed an upregulation of TGF-β protein in saline-treated animals compared to controls, with levels normalized after rASPN treatment. l,m, rASPN attenuated the medial thickening of distal pulmonary arteries in SuHx rats, as assessed by Masson Trichrome histological staining. Scale bars, 20μm. n,o, rASPN attenuated expression of TGF-β downstream effector pSMAD3 in SMA+ cells of distal pulmonary arteries, as assessed by immunofluorescence. Scale bars, 10μm. p, Schematic representation of the study and results. Figure was created in part using BioRender.com. aSMA = alpha smooth muscle actin; cc3 = cleaved caspase 3; PAAT = pulmonary arterial acceleration time; PASMC = pulmonary arterial smooth muscle cells; rAspn = recombinant asporin; RHC = right heart catheterization; RVFAC = right ventricular fractional area change; RVSP = right ventricular systolic pressure; SuHx = Sugen-hypoxia. Data presented as mean±SEM, n=3–4 for in vitro experiments, n=9–10/group for in vivo experiments. Tested with student’s t-test or one-way ANOVA with Holm-Bonferroni posthoc correction. *P < 0.05, **P < 0.01, ***P < 0.001.

References

    1. Stearman RS, Bui QM, Speyer G, Handen A, Cornelius AR, Graham BB, Kim S, Mickler EA, Tuder RM, Chan SY, Geraci MW. Systems Analysis of the Human Pulmonary Arterial Hypertension Lung Transcriptome. Am J Respir Cell Mol Biol. 2019. Jun;60(6):637–649. - PMC - PubMed
    1. Hoffmann J, Wilhelm J, Olschewski A, Kwapiszewska G. Microarray analysis in pulmonary hypertension. European Respiratory Journal. 2016. Jul;48(1):229–241. - PMC - PubMed
    1. Porcu E, Sadler MC, Lepik K, Auwerx C, Wood AR, Weihs A, Sleiman MSB, Ribeiro DM, Bandinelli S, Tanaka T, Nauck M, Völker U, Delaneau O, Metspalu A, Teumer A, Frayling T, Santoni FA, Reymond A, Kutalik Z. Differentially expressed genes reflect disease-induced rather than disease-causing changes in the transcriptome. Nat Commun. Nature Publishing Group; 2021. Sep 24;12(1):5647. - PMC - PubMed
    1. Shu L, Zhao Y, Kurt Z, Byars SG, Tukiainen T, Kettunen J, Orozco LD, Pellegrini M, Lusis AJ, Ripatti S, Zhang B, Inouye M, Mäkinen VP, Yang X. Mergeomics: multidimensional data integration to identify pathogenic perturbations to biological systems. BMC Genomics. 2016. Nov 4;17(1):874. - PMC - PubMed
    1. Stacher E, Graham BB, Hunt JM, Gandjeva A, Groshong SD, McLaughlin VV, Jessup M, Grizzle WE, Aldred MA, Cool CD, Tuder RM. Modern Age Pathology of Pulmonary Arterial Hypertension. American Journal of Respiratory and Critical Care Medicine. 2012. Aug;186(3):261–272. - PMC - PubMed

MeSH terms