. 2024 Aug 27;121(35):e2320189121.
doi: 10.1073/pnas.2320189121. Epub 2024 Aug 21.

Somatic mutations in tumor-infiltrating lymphocytes impact on antitumor immunity

Affiliations

Somatic mutations in tumor-infiltrating lymphocytes impact on antitumor immunity

Fumiaki Mukohara et al. Proc Natl Acad Sci U S A. .

Abstract

Immune checkpoint inhibitors (ICIs) exert clinical efficacy against various types of cancers by reinvigorating exhausted CD8+ T cells that can expand and directly attack cancer cells (cancer-specific T cells) among tumor-infiltrating lymphocytes (TILs). Although some reports have identified somatic mutations in TILs, their effect on antitumor immunity remains unclear. In this study, we successfully established 18 cancer-specific T cell clones, which have an exhaustion phenotype, from the TILs of four patients with melanoma. We conducted whole-genome sequencing for these T cell clones and identified various somatic mutations in them with high clonality. Among the somatic mutations, an SH2D2A loss-of-function frameshift mutation and TNFAIP3 deletion could activate T cell effector functions in vitro. Furthermore, we generated CD8+ T cell-specific Tnfaip3 knockout mice and showed that Tnfaip3 function loss in CD8+ T cell increased antitumor immunity, leading to remarkable response to PD-1 blockade in vivo. In addition, we analyzed bulk CD3+ T cells from TILs in additional 12 patients and identified an SH2D2A mutation in one patient through amplicon sequencing. These findings suggest that somatic mutations in TILs can affect antitumor immunity and suggest unique biomarkers and therapeutic targets.

Keywords: T cell; cancer immunology; somatic mutation; tumor-infiltrating lymphocytes.


Conflict of interest statement

Competing interests statement:K. Yamashita is an employee of KOTAI Biotechnologies. T. Inozume received honoraria from Ono Pharmaceutical, Bristol-Myers Squibb, and MSD outside of this study. H. Mano is a board member of CureGene; and received honoraria from Konica Minolta outside of this study. S. Toyooka received honoraria from TAIHO PHARMA, Eli Lilly, Chugai Pharmaceutical, GUARDANT, AstraZeneca, Illumina, MERCK, CSL Behring, Johnson & Johnson, Nippon Kayaku, INTUITIVE, Daiichi-Sankyo, ONO PHARMACEUTICAL, Medtronic, Ziosoft, NOVARTIS, Sysmex, and Riken Genesis outside of this study. Y. Togashi received honoraria from Ono Pharmaceutical and Bristol-Myers Squibb, AstraZeneca, Chugai Pharmaceutical, and MSD outside of this study. H. Mano received research grants from Daiichi Sankyo, Konica Minolta, Ambry Genetics, Ono Pharmaceutical and PFDeNA outside of this study. S. Toyooka received research grants from TAIHO PHARMA, Eli Lilly, Chugai Pharmaceutical, and Astellas Pharma outside of this study. Y. Togashi received research grants from Ono Pharmaceutical, Bristol-Myers Squibb, Daiichi-Sankyo, Janssen Pharmaceutical, AstraZeneca, KOTAI, and KORTUC outside of this study. The other authors declare that they have no research support relevant to financial competing interests.

Figures
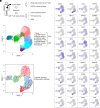
Fig. 1.
Fig. 1.
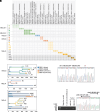
The study schema and single-cell sequencing data. (A) Study schema. We obtained five tumor samples from four melanoma patients who received surgical resection, from which we established digested tumor-infiltrating lymphocytes (TILs) and paired autologous cancer cell lines. We conducted single-cell RNA/T cell receptor (TCR) sequencing (scRNA/TCR-seq) for T cells from these TILs before expansion and whole-exome sequencing for cancer cell lines. In addition, we established several CD8+ T cell single clones from expanded TILs and evaluated cancer-specificity using autologous cancer cells. Their TCRs were subsequently sequenced with the 5’ RACE method and whole-genome sequencing (WGS) was also conducted. (B) Clustering for tumor-infiltrating T cells. Tumor-infiltrating T cells from digested TILs before expansion were sequenced and classified into eight clusters. The UMAP figure is shown. (C) Representative gene expression in each cluster. Representative genes that are frequently used for annotation are shown. (D) Distribution of the cancer-specific or nonspecific clonotypes. The TCRα and TCRβ chains of enriched clones were analyzed with the 5’ RACE method, and the clonotypes are highlighted in the UMAP figure. Red, specific; blue nonspecific.
Fig. 2.
Fig. 2.
Mutational analysis of tumor-infiltrating T cell clones. (A) Mutations and structural variations detected in tumor-infiltrating T cell clones. Representative mutations and structural variants detected in the T cell clones are shown. (B) Clonal analysis of TILs clones and their mutational signatures. The lineage relationship of the clones was inferred using the maximum parsimony method with MPboot and visualized using Phylo module of BioPython. Mutational signatures of single nucleotide variants were analyzed using SigProfiler. The length of the branches in the lineage is proportional to the number of somatic mutations. The colors of the upper branches represent the mutational signatures. The colors of the clone’s name in panel (A) correspond to the colors of the lower branches in panel (B). SBS, single base substitution. (C) Validation of an SH2D2A frameshift mutation in T cell clone from MEL02-1. PCR amplicons were cloned and subjected to Sanger sequencing analysis. The sequencing electrophoretograms are shown (Left, wild-type allele; Right, mutant allele). (D) Validation of a TNFAIP3 large deletion in T cell clone and frozen tumor tissues from MEL02. PCR amplicons were also subjected to Sanger sequencing analysis. Agarose gel electrophoresis of PCR amplicons (Left) and the sequencing electrophoretogram (Right) are shown.
Fig. 3.
Fig. 3.
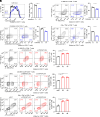
Impact of TNFAIP3 on TILs and Jurkat cells. (AC) Cytokine production in cancer-specific T cell clones from MEL02-2. After coculture with the autologous cancer cells, interferon (IFN)-γ (A), tumor necrosis factor (TNF)-α (B), and IL-2 (C) concentrations in the supernatants were analyzed with enzyme-linked immunosorbent assay. For the negative control, an anti-major histocompatibility complex-I monoclonal antibody (mAb, W6/32) was added. (D) Western blotting. After Jurkat cells were treated with phorbol 12-myristate 13-acetate/ionomycin, the cell lysates were subjected to immunoblot analysis with a specific antibody to A20, phosphorylated (p) IκBα, total IκBα, or actin (loading control). The band densities were quantified using ImageJ software and normalized with actin. The fold change of each molecule to shNT are described below each band. (E) IL-2 production in Jurkat cells. Twelve hours after Jurkat cells were treated with or without anti-CD3/CD28 mAbs, IL-2 concentrations in the supernatants were analyzed with ELISA. (F) CD69 expression in Jurkat cells. Twelve hours after Jurkat cells were treated with or without anti-CD3/CD28 mAbs, cells were analyzed with flow cytometry. Representative flow cytometry staining (Left) and the summary (Right) are shown. All in vitro experiments were performed in triplicates. One-way ANOVA with Bonferroni correction was used in (AC), (E) and (F) for statistical analyses. shNT, nontargeting short hairpin RNA; shTNFAIP3, TNFAIP3 short hairpin RNA; *P < 0.05; **P < 0.01; ****P < 0.0001; NS, not significant; bars, mean; error bars, SEM.
Fig. 4.
Fig. 4.
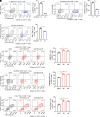
Impact of TNFAIP3 on peripheral blood mononuclear cells (PBMCs). (A) Rapid dividing CD8+ T cells. Cell trace violet (CTV)-labeled TNFAIP3-overexpressing lentivirus-transduced CD8+ T cells from PBMCs were cultured in the presence of IL-2 and anti-CD3/CD28 monoclonal antibodies (mAbs). Dividing cells were assessed seven days later by the dilution of CTV-labeled cells using flow cytometry. Rapidly dividing cells were counted after the third division. Representative flow cytometry staining (Left) and the summary (Right) are shown. (BD) 4-1BB+PD-1+ fraction (B), CD45RACCR7 effector memory fraction (C), and cytokine production (D) in TNFAIP3-overexpressing CD8+ T cells. TNFAIP3-overexpressing lentivirus-transduced PBMCs from healthy donors were cultured with anti-CD3/CD28 mAbs and IL-2 for 24 h and were subjected to flow cytometry. Representative flow cytometry staining (Left) and the summaries (Right) are shown. (EG) 4-1BB+PD-1+ fraction (E), CD45RACCR7 effector memory fraction (F), and cytokine production (G) in TNFAIP3-knockdown CD8+ T cells. TNFAIP3-knockdown lentivirus-transduced PBMCs from healthy donors were cultured with anti-CD3/CD28 mAbs and IL-2 for 24 h after selection with puromycin and were subjected to flow cytometry. Representative flow cytometry staining (Left) and the summaries (Right) are shown. All in vitro experiments were performed in triplicates. T tests were used in (AD), and one-way ANOVA with Bonferroni correction was used in (EG) for statistical analyses. IFN, interferon; TNF, tumor necrosis factor; shNT, nontargeting short hairpin RNA; shTNFAIP3, TNFAIP3 short hairpin RNA; *P < 0.05; **P < 0.01; ***P < 0.001; ****P < 0.0001; bars, mean; error bars, SEM.
Fig. 5.
Fig. 5.
SH2D2A and T cell activation. (AC) 4-1BB+PD-1+ fraction (A), CD45RACCR7 effector memory fraction (B), and cytokine production (C) in SH2D2A-overexpressing CD8+ T cells. SH2D2A-overexpressing lentivirus-transduced peripheral blood mononuclear cells (PBMCs) from healthy donors were cultured with anti-CD3/CD28 mAbs and IL-2 for 24 h and were subjected to flow cytometry. Representative flow cytometry staining (Left) and the summaries (Right) are shown. (DF) 4-1BB+PD-1+ fraction (D), CD45RACCR7 effector memory fraction (E), and cytokine production (F) in SH2D2A-knockdown CD8+ T cells. SH2D2A-knockdown lentivirus-transduced PBMCs from healthy donors were cultured with anti-CD3/CD28 mAbs and IL-2 for 24 h after selection with puromycin and were subjected to flow cytometry. Representative flow cytometry staining (Left) and the summaries (Right) are shown. All in vitro experiments were performed in triplicates. T tests were used in (AC) and one-way ANOVA with Bonferroni correction was used in (DF) for statistical analyses. shNT, nontargeting short hairpin RNA; shSH2D2A, SH2D2A short hairpin RNA; IFN, interferon; TNF, tumor necrosis factor. *P < 0.05; **P < 0.01; ***P < 0.001; ****P < 0.0001; bars, mean; error bars, SEM.
Fig. 6.
Fig. 6.
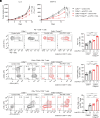
Antitumor immunity in CD8+ T cell–specific Tnfaip3-knockdown mice. (A) Tumor growth treated with anti-PD-1 or control monoclonal antibody (mAb) in Cd8acre or Cd8acreTnfaip3fl/fl mice. LL/2 or B16F10 cells (1 × 10⁶) were injected subcutaneously, and the tumor volume was monitored every 3 d. When tumor volume reached around 100 mm3 (day 0), anti-PD-1 or control mAb was administered intraperitoneally three times every three days. Tumor growth curves (Left, LL/2; Right, B16F10) are shown. (BD) The frequencies of PD-1+CD8+ T cells (B), CD44+CD62LCD8+ effector memory T cells (C), and cytokine-producing CD8+ T cells (D) in TILs. In vivo experiments were performed using LL/2 tumors as described in (A), and tumors were harvested on day 7 to collect TILs for flow cytometric evaluation. For intracellular cytokine assays, cells were stimulated for 5 h with phorbol 12-myristate 13-acetate/ionomycin. Representative flow cytometry staining (Left) and the summaries (Right) are shown. All in vivo experiments were performed in duplicate, with similar results. Two-way ANOVA with Bonferroni corrections was used in (A), one-way ANOVA with Bonferroni corrections was used in (BD) for statistical analyses. The mean and SEMs are shown. IFN, interferon; TNF, tumor necrosis factor; *P < 0.05; **P < 0.01; ****P < 0.0001, NS, not significant.

References

    1. Zou W., Wolchok J. D., Chen L., PD-L1 (B7–H1) and PD-1 pathway blockade for cancer therapy: Mechanisms, response biomarkers, and combinations. Sci. Transl. Med. 8, 328rv324 (2016). - PMC - PubMed
    1. Topalian S. L., Drake C. G., Pardoll D. M., Immune checkpoint blockade: A common denominator approach to cancer therapy. Cancer Cell 27, 450–461 (2015). - PMC - PubMed
    1. Brahmer J. R., et al. , Safety and activity of anti-PD-L1 antibody in patients with advanced cancer. N Engl. J. Med. 366, 2455–2465 (2012). - PMC - PubMed
    1. Topalian S. L., et al. , Safety, activity, and immune correlates of anti-PD-1 antibody in cancer. N Engl. J. Med. 366, 2443–2454 (2012). - PMC - PubMed
    1. Nagasaki J., et al. , PD-1 blockade therapy promotes infiltration of tumor-attacking exhausted T cell clonotypes. Cell Rep. 38, 110331 (2022). - PubMed

Substances

Grants and funding

LinkOut - more resources