. 2024 Aug 27;121(35):e2400385121.
doi: 10.1073/pnas.2400385121. Epub 2024 Aug 21.

The microbiota-dependent tryptophan metabolite alleviates high-fat diet-induced insulin resistance through the hepatic AhR/TSC2/mTORC1 axis

Affiliations

The microbiota-dependent tryptophan metabolite alleviates high-fat diet-induced insulin resistance through the hepatic AhR/TSC2/mTORC1 axis

Wei Du et al. Proc Natl Acad Sci U S A. .

Abstract

Type 2 diabetes (T2D) is potentially linked to disordered tryptophan metabolism that attributes to the intricate interplay among diet, gut microbiota, and host physiology. However, underlying mechanisms are substantially unknown. Comparing the gut microbiome and metabolome differences in mice fed a normal diet (ND) and high-fat diet (HFD), we uncover that the gut microbiota-dependent tryptophan metabolite 5-hydroxyindole-3-acetic acid (5-HIAA) is present at lower concentrations in mice with versus without insulin resistance. We further demonstrate that the microbial transformation of tryptophan into 5-HIAA is mediated by Burkholderia spp. Additionally, we show that the administration of 5-HIAA improves glucose intolerance and obesity in HFD-fed mice, while preserving hepatic insulin sensitivity. Mechanistically, 5-HIAA promotes hepatic insulin signaling by directly activating AhR, which stimulates TSC2 transcription and thus inhibits mTORC1 signaling. Moreover, T2D patients exhibit decreased fecal levels of 5-HIAA. Our findings identify a noncanonical pathway of microbially producing 5-HIAA from tryptophan and indicate that 5-HIAA might alleviate the pathogenesis of T2D.

Keywords: gut microbiota; insulin signaling; tryptophan metabolism; type 2 diabetes.


Conflict of interest statement

Competing interests statement:The authors declare no competing interest.

Figures
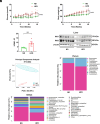
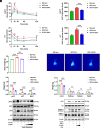
Fig. 1.
Fig. 1.
HFD feeding induces IR and causes alterations of the gut microbiome in mice. Male C57BL/6J mice (4 wk old) were fed a HFD (n = 6) or ND (n = 6) for 15 wk. See also SI Appendix, Fig. S1C. (A) Blood glucose curves. (B) Body weight curves. (C) Homeostasis Model Assessment of IR (HOMA-IR) at the end point. (D) Immunoblotting analysis of IRS1 and IRS2 protein levels in liver tissues. (E) Two-dimensional principal coordinates analysis (PCA) plot of the gut microbiota composition. Scores are based on the relative abundance of operational taxonomic units (OTUs). Each symbol represents an individual mouse. See also SI Appendix, Fig. S2A. (F) Barplot analysis of the phylum level of the gut microbial community. (G) Barplot analysis of the genus level of the gut microbial community. Data are shown as mean ± SEM. (A-C; n = 6) or are representative of three independent experiments with similar results (D). *P < 0.05, **P < 0.01, and ***P < 0.005. Statistical analysis was performed using unpaired two-tailed Student’s t test (AC).
Fig. 2.
Fig. 2.
HFD-fed mice exhibit altered gut metabolome and decreased 5-HIAA concentrations. Metabolomic analysis of samples collected from HFD mice and ND mice (n = 6 per group) as in Fig. 1. See also SI Appendix, Fig. S1. (A) The PLS-DA plot of differential metabolites from fecal samples. Each symbol represents an individual mouse. (B) Permutation test of CK-P1 showing the robustness of the PLS-DA model. (C) Volcano plots of differential metabolites that were up-regulated (red) or down-regulated (green) in fecal samples (HFD group vs. ND group). The broken line denotes a cutoff q value < 0.05 (Student’s t test). (D) Overview of enriched KEGG pathways of metabolites. (E) Untargeted metabolomic profiling was performed using the same fecal samples of HFD mice and ND mice as in Fig. 1. The intensity of 5-HIAA in the feces of HFD mice and ND mice. (F) Targeted HPLC-MS/MS analysis determining the fecal and serum levels of 5-HIAA. Each symbol represents an individual mouse. See also SI Appendix, Figs. S3 and S4. Data are shown as mean ± SEM. (n = 6). *P < 0.05 and **P < 0.01. Statistical analysis was performed using unpaired two-tailed Student’s t test (E and F).
Fig. 3.
Fig. 3.
Burkholderia spp. are responsible for microbially producing 5-HIAA from Trp in the 5-HT-independent pathway. (A) Overview of the metabolic pathway transforming Trp into 5-HIAA. (B) Microbial transformation of Trp, 5-HTP, and 5-HT into 5-HIAA in vitro. Fecal bacteria suspensions (FB) were obtained from 8-wk-old C57BL/6 mice and were then incubated with (blue) or without (green) Trp (10 mM, Left), 5-HTP (10 mM, Middle), or 5HT (10 mM, Right) for 24 h. The concentration of 5-HIAA was measured by LC–MS analysis. PBS (red) and antibiotic cocktails (Abx) treated 6 h (FB+Abx, purple) as negative control. (C) A proposed pathway for transforming Trp into 5-HIAA in the gut. (D) UV–Visible spectra showing the activity of purified TDO2 from Burkholderia cenocepacia in vitro. Purified TDO2 was incubated with Trp (1 mg/mL) for 1 h. (E) Extracted LC–MS/MS ion chromatograms showing the activity of TMO and IaaH purified from Burkholderia pyrrocinia in vitro. Purified TMO and IaaH were incubated with 5-HTP (1 mg/mL) for 2 h. The reaction mixture was analyzed by LC–MS. (F) Apparent kinetic analysis of TMO-IaaH mixed enzyme catalyzes 5-HTP to 5-HIAA. Rate (μM 5-HTP/min) vs. substrate concentration (mM 5-HTP) curve for 5-HTP metabolism by TMO and IaaH. Enzymes were incubated with concentrations of 5-HTP that varied from 0.5 to 30 mM. GraphPad was used to fit the Michaelis–Menten curve. See also (SI Appendix, Fig. S7 BD). (G) Extracted LC–MS/MS ion chromatograms showing the conversion of 5-HTP to 5-HIAA by engineered E. coli. Engineered E. coli DH5α harboring TMO and IaaH was grown aerobically in LB Broth containing 5-HTP (1 g/L) at 37 °C for 48 h and analyzed using LC–MS. See also SI Appendix, Fig. S6E. (H) Fecal bacteria suspensions were obtained from ND mice (n = 6 per group) and HFD mice (n = 6 per group) as in Fig. 1 and were then incubated with Trp (10 mM) for 24 h. The concentration of 5-HIAA was measured by LC–MS analysis. (I) Impacts of antibiotic cocktails (Abx) on the production of 5-HIAA in vivo. Male C57BL/6J mice (6 wk old; n = 6 per group) were orally administered with vehicle (Veh) and Abx for 14 d. Fecal and serum levels of 5-HIAA were measured by targeted HPLC-MS/MS. Each symbol represents an individual mouse (B, H, and I). Data are shown as mean ± SEM. (B, H, and I, n = 4 or 6) or mean± SD. (F, three independent experiments) or are representative of three independent experiments with similar results (D, E, and G). *P < 0.05, **P < 0.01, and ***P < 0.005; ns, not significant. Statistical analysis was performed using the Bonferroni post hoc test followed by one-way ANOVA (B) or unpaired two-tailed Student’s t test (H and I).
Fig. 4.
Fig. 4.
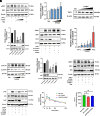
Microbiota-dependent 5-HIAA improves glucose intolerance and obesity in HFD-fed mice, while preserving hepatic insulin sensitivity. (AD) Effects of 5-HIAA on glucose intolerance in vivo. Male C57BL/6J mice (6 wk old; n = 5 per group) were fed a HFD or ND for 6 wk, with oral administration of 5-HIAA or vehicle (Veh) twice a day. After a 12 h (OGTT)/3 h (ITT) fasting at the end point, glucose levels and glucose area under the curve (AUC) were determined using the oral glucose tolerance test (OGTT) (A and B) and insulin tolerance test (ITT) (C and D). (E) Effects of 5-HIAA on body weights in vivo. (F) Effects of 5-HIAA on the distribution of fat mass and lean mass in vivo. (G) Effects of 5-HIAA on adipose tissue weights in vivo. (H) Effects of 5-HIAA on organ weights in vivo. (I) Effect of 5-HIAA on the insulin-stimulated IR in mice primary hepatocytes. Mice primary hepatocytes were treated with an increasing dosage of 5-HIAA (0.5, 1.5, and 4 mM) in the presence of high-concentration insulin (789 mM) for 24 h to induce IR, followed by insulin (5 nM) stimulation for 10 min after PBS washing. The protein levels of phosphorylated IRS1 at tyrosine 621 (pIRS1), IRS1, phosphorylated Akt (pAkt), and Akt were examined by immunoblotting. β-actin was used as a loading control. (J) HepG2 cells were treated with 5-HIAA (2 and 4 mM) and rapamycin (Rap.) for 24 h in the presence of TNF-α (200 ng/mL), followed by insulin (5 nM) stimulation for 10 min after PBS washing. The protein levels of pAkt, Akt, phosphorylated GSK-3 (pGSK-3), and GSK-3 were examined by immunoblotting. Each symbol represents an individual mouse (AH). Data are shown as mean ± SEM. (n = 5) or are representative of three independent experiments with similar results (I and J). *P < 0.05, **P < 0.01, and ***P < 0.005; ns, not significant. Statistical analysis was performed using the Bonferroni post hoc test followed by one-way ANOVA (B, D, E, G, and H) or Tukey’s post hoc test followed by one-way ANOVA (A and C).
Fig. 5.
Fig. 5.
5-HIAA inhibits the TSC2-mTORC1 pathway via direct activation of AhR. (A) Inhibition of the mTORC1-mediated phosphorylation of S6K1 by 5-HIAA. HepG2 cells were mock-stimulated or stimulated with TNF-α (200 ng/mL) as described in Fig. 3 and were then treated with vehicle, the mTORC1 inhibitor rapamycin (Rap.) or a growing concentration of 5-HIAA (1, 2, and 4 mM) for 24 h. Cell lysates were subjected to immunoblotting for examining the protein levels of phosphorylated S6K1 at Thr389 (pS6K1) and S6K1. β-actin was used as a loading control. (B and C) Upregulation of TSC2 expression by 5-HIAA. HepG2 cells were treated with vehicle or an increasing dosage of 5HIAA (1, 2, 4, and 8 mM) for 24 h. The relative mRNA levels (shown fold change) of TSC2 were determined by qPCR, and GAPDH mRNA was used as an internal control (B). The protein levels of TSC2 were examined by immunoblotting (C). (D) siRNA-mediated knockdown of TSC2 expression. HepG2 cells were mock-treated or treated with scrambled siRNA (si-Control) and pairs of siRNA specifically targeting Tsc2 (si-TSC2-1/-2/-3). The protein and mRNA levels of TSC2 were examined by immunoblotting and qPCR, respectively. (E) Impacts of TSC2 knockdown on the inhibition of S6K1 phosphorylation by 5-HIAA. HepG2 cells were transfected with si-Control or si-TSC2 and were then treated with vehicle or 5-HIAA (4 mM) for 24 h in the presence of TNF-α (200 ng/mL). The protein levels of pS6K1, S6K1, and TSC2 were examined by immunoblotting. (F) Induction of the AhR activation biomarker CYP1A1 by 5-HIAA. HepG2 cells were treated with vehicle, the AhR ligand FICZ, or an increasing dosage of 5-HIAA (1, 2, 4, and 8 mM) for 24 h. The relative mRNA levels (shown as fold change) of CYP1A1 were determined by qPCR, and GAPDH mRNA was used as an internal control. (G) Promotion of Suv39h1/H3K9m3 degradation by 5-HIAA. Similar to (F), except that HepG2 cells were first stimulated with TNF-α (200 ng/mL) before the following treatment. The protein levels of CYP1A1 and Suv39h1 were examined by immunoblotting. β-actin was used as a loading control. (H) siRNA-mediated knockdown of AhR expression. HepG2 cells were mock-treated or treated with scrambled siRNA (si-Control) and pairs of siRNA specifically targeting the AhR gene (si-AhR-1/-2/-3). The protein and mRNA levels of AhR were examined by immunoblotting and qPCR, respectively. (I) Impacts of AhR knockdown on the inhibition of S6K1 phosphorylation by 5-HIAA. HepG2 cells were transfected with si-Control or si-AhR-1 and were then treated with vehicle or 5-HIAA (4 mM) for 24 h in the presence of TNF-α (200 ng/mL). Treatment with the mTORC1 inhibitor Rapamycin (Rap.) was a positive control. The protein levels of pS6K1, S6K1, and AhR were examined by immunoblotting. (J) Impacts of AhR knockdown on the upregulation of Akt phosphorylation by 5-HIAA. Similar to (I), except that HepG2 cells were prestimulated with insulin (5 nM). The protein levels of pAkt, Akt, and AhR were examined by immunoblotting. (K and L) Impacts of AhR deficiency on the bioactivity of 5-HIAA in improving glucose intolerance in vivo. Male wild-type (WT) and AhR-KO C57BL/6J mice (6 wk old; n = 5 per group) were treated as described in Fig. 3. Glucose levels and glucose AUC were determined using OGTT. Data are from three independent experiments (B, D, F, and H, mean ± SD.) or five (K and L, mean ± SEM.) biological replicates or are representative of three independent experiments with similar results (A, C, E, G, I, and J). *P < 0.05, **P < 0.01, and ***P < 0.01. Statistical analysis was performed using unpaired two-tailed Student’s t test (B, D, F, and H), Bonferroni post hoc test followed by one-way ANOVA (L), or Tukey’s post hoc test followed by one-way ANOVA (K).
Fig. 6.
Fig. 6.
Levels of 5-HIAA are diminished in subjects with type 2 diabetes. (A) Fecal bacteria suspensions were obtained from subjects without type 2 diabetes (no T2D, n = 21) and with T2D (T2D, n = 15) and were then incubated with Trp (10 mM) for 24 h. The concentration of 5-HIAA was measured by targeted HPLC-MS/MS analysis. (B and C) Serum and urine were collected from subjects without T2D (no T2D, n = 23) and with T2D (T2D, n = 22). Targeted HPLC-MS/MS analysis was conducted to determine the intensity of 5-HIAA in each sample. Each symbol represents an individual subject. Data are shown as median ± 95% CI. *P < 0.05 and **P < 0.01. Statistical analysis was performed using the Mann–Whitney test.
Fig. 7.
Fig. 7.
A model for the promotion of hepatic insulin signaling by 5-HIAA through the AhR/TSC2/mTORC1 axis.

References

    1. Aurelie C., et al. , Dietary intervention impact on gut microbial gene richness. Nature 500, 585–588 (2013). - PubMed
    1. Chatelier E.-L., et al. , Richness of human gut microbiome correlates with metabolic markers. Nature 500, 541–546 (2013). - PubMed
    1. Qin J., et al. , A metagenome-wide association study of gut microbiota in type 2 diabetes. Nature 490, 55–60 (2012). - PubMed
    1. Roager H.-M., Licht T.-R., Microbial tryptophan catabolites in health and disease. Nat. Commun. 9, 3294 (2018). - PMC - PubMed
    1. Brown M.-S., Goldstein J.-L., Selective versus total insulin resistance: A pathogenic paradox. Cell Metab. 7, 95–96 (2008). - PubMed

MeSH terms

Substances

LinkOut - more resources