. 2024 Aug;14(8):e1798.
doi: 10.1002/ctm2.1798.

Single-nucleus and spatial transcriptome reveal adrenal homeostasis in normal and tumoural adrenal glands

Affiliations

Single-nucleus and spatial transcriptome reveal adrenal homeostasis in normal and tumoural adrenal glands

Barbara Altieri et al. Clin Transl Med. 2024 Aug.

Abstract

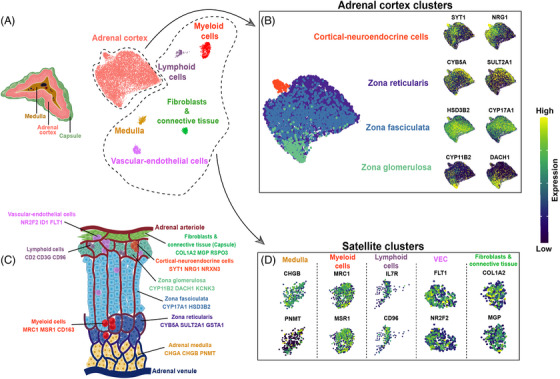
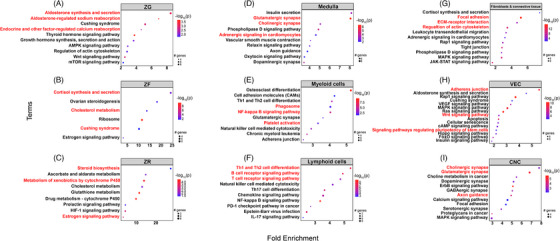
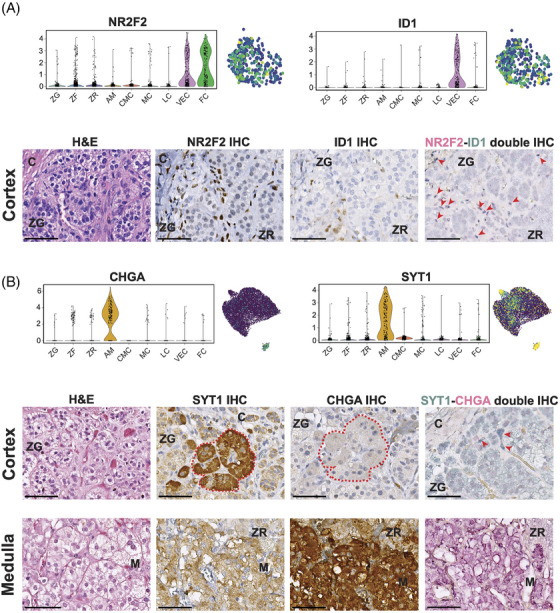
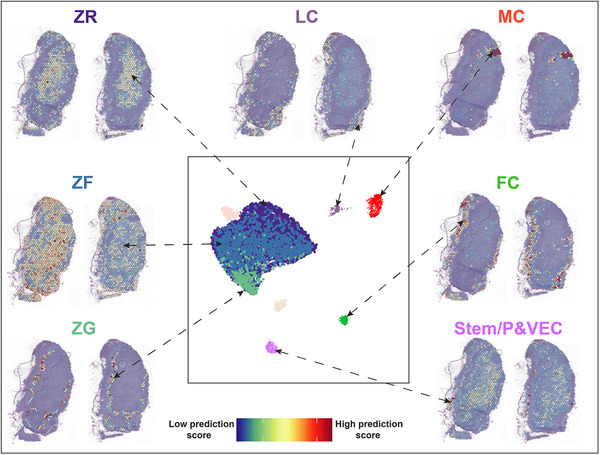
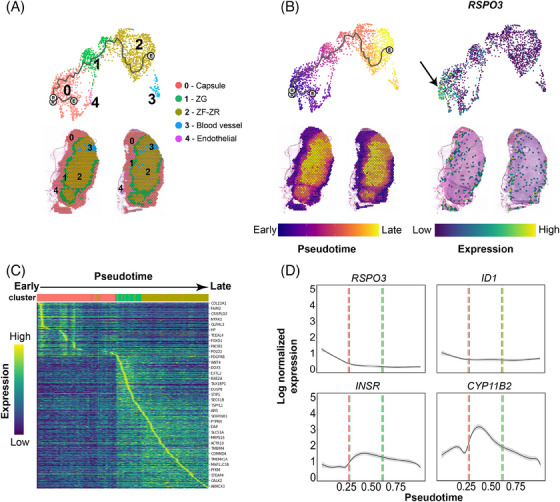
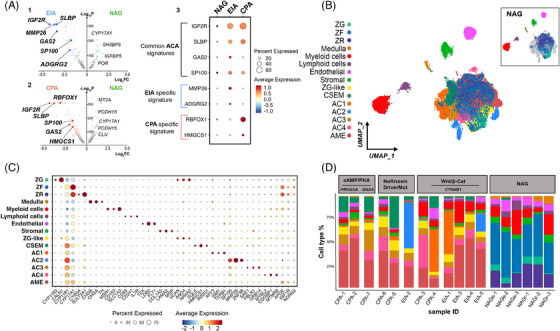
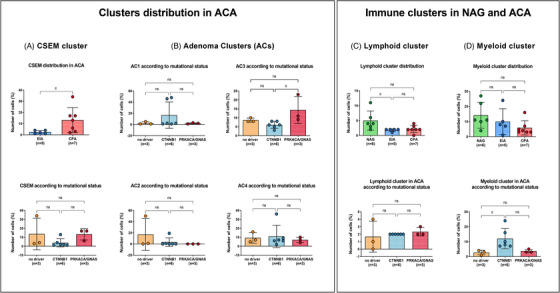
The human adrenal gland is a complex endocrine tissue. Studies on adrenal renewal have been limited to animal models or human foetuses. Enhancing our understanding of adult human adrenal homeostasis is crucial for gaining insights into the pathogenesis of adrenal diseases, such as adrenocortical tumours. Here, we present a comprehensive cellular genomics analysis of the adult human normal adrenal gland, combining single-nuclei RNA sequencing and spatial transcriptome data to reconstruct adrenal gland homeostasis. As expected, we identified primary cells of the various zones of the adrenal cortex and medulla, but we also uncovered additional cell types. They constitute the adrenal microenvironment, including immune cells, mostly composed of a large population of M2 macrophages, and new cell populations, including different subpopulations of vascular-endothelial cells and cortical-neuroendocrine cells. Utilizing spatial transcriptome and pseudotime trajectory analysis, we support evidence of the centripetal dynamics of adrenocortical cell maintenance and the essential role played by Wnt/β-catenin, sonic hedgehog, and fibroblast growth factor pathways in the adult adrenocortical homeostasis. Furthermore, we compared single-nuclei transcriptional profiles obtained from six healthy adrenal glands and twelve adrenocortical adenomas. This analysis unveiled a notable heterogeneity in cell populations within the adenoma samples. In addition, we identified six distinct adenoma-specific clusters, each with varying distributions based on steroid profiles and tumour mutational status. Overall, our results provide novel insights into adrenal homeostasis and molecular mechanisms potentially underlying early adrenocortical tumorigenesis and/or autonomous steroid secretion. Our cell atlas represents a powerful resource to investigate other adrenal-related pathologies.

Keywords: CTNNB1; adenoma; adrenal homeostasis; adrenocortical tumour; cortisol secretion; heterogeneity; microenvironment; spatial transcriptome; tumorigenesis.


Conflict of interest statement

The authors declare no conflict of interest.

Figures

FIGURE 1
FIGURE 1
Single‐nucleus analysis of the adult human normal adrenal gland. (A) Left: Transverse section depicting the three major adrenal zones (capsule, adrenal cortex, and medulla). Right: UMAP (Uniform Manifold Approximation and Projection) representation of the six integrated single‐nuclei transcriptomic datasets (clusters were annotated by using known marker genes and DEG analysis). (B) Adrenal cortex clusters: left: UMAP representation of the adrenal cortex clusters with complete zonation inferred by module scoring (see Methods); right: feature expression plots representing genes specific for zonae reticularis, fasciculata, glomerulosa and cortical‐neuroendocrine cells (scale represents log normalized expression values). (C) Anatomical sketch of the adult human normal adrenal gland: the displayed markers for each identified cell type are based on DGE analysis in single‐cell transcriptome data, available literature (see text for references) and in‐situ validations by immunohistochemistry. The image was created with BioRender. (D) Satellite clusters. Feature expression plots representing genes used in the annotation of the following clusters: medulla, myeloid cells, lymphoid cells, vascular‐endothelial cells (VEC), and fibroblasts & connective tissue (scale represents log normalized expression values).
FIGURE 2
FIGURE 2
Gene set enrichment analysis of single‐nuclei transcriptome in adult human normal adrenal glands. Gene set enrichment analysis was performed using pathfindR (KEGG) and results for each cluster are represented separately. The dot size varies with the quantity of observed significant genes that constitute their representative enriched term. The colour scale represents the –log10(p) value. The x‐axis indicates fold enrichment, while the y‐axis covers the enriched terms within the representative clusters. Abbreviations: CNC, cortical‐neuroendocrine cells; VEC, vascular‐endothelial cells; ZF, zona fasciculata; ZG, zona glomerulosa; ZR, zona reticularis.
FIGURE 3
FIGURE 3
New cell populations in adult human normal adrenal glands. (A) Expression of NR2F2 and ID1 in the vascular‐endothelial cells (VEC) population at single‐nuclei transcriptomic level reported as a violin plot comparing the different clusters of the normal adrenal gland and as UMAP (Uniform Manifold Approximation and Projection). Immunohistochemistry (IHC) analysis revealed sparse cells with positive nuclear staining of NR2F2 or ID1, where ID1+ cells were rarer than NR2F2+ cells. These cells – although rare – were mostly located at the subcapsular level, while sparse cells were also found in the inner cortex. Nuclei of cells NR2F2+‐ID1+ were stained in dark blue at double immunostaining (sum of fuchsin‐red + blue‐green colours, indicated by red arrows) and were mostly located under the capsule. NR2F2+‐ID1+ nuclei are indicated with arrows. (B) Expression of SYT1 and CHGA in the cortical‐neuroendocrine cells (CNC) at single‐nuclei transcriptomic level reported as a violin plot comparing the different clusters of the normal adrenal gland and as UMAP. In IHC, SYT1+ cells were grouped, forming a cluster in the subcapsular region (highlighted in red dashed line) in some of the evaluated samples. These cells were negative for CHGA, as confirmed also by the double immunostaining, where SYT1 strong positive cells (starker green‐blue colour, indicated by arrows) are found. On the contrary, medullary cells showed a strong staining for the CHGA and only a low staining for SYT1. Pictures of the same area of FFPE slides belonging to the same tissue were reevaluated for the different staining for each cell population. All images were acquired by Leica Aperio Versa brightfield scanning microscope (Leica, Germany). Scale bar: 100 µm. Abbreviation: C, capsule; H&E, haematoxylin and eosin staining; M, medulla; ZF, zona fasciculata; ZG, zona glomerulosa; ZR, zona reticularis.
FIGURE 4
FIGURE 4
Validation of adrenal zonation by spatial transcriptomics in adult human normal adrenal glands. A pairwise (cell‐to‐spot) score is calculated within the label transfer framework in Seurat (V3) and projected onto sections. Two sections are represented for each mapped cluster. Medulla and cortical‐neuroendocrine cells (CNC) were rendered transparent as the label transfer did not detect the presence of these cell types in the Visium assay. Abbreviations: FC, fibroblasts & connective tissue; LC, lymphoid cells; MC, myeloid cells; VEC, vascular‐endothelial cells; ZF, zona fasciculata; ZG, zona glomerulosa; ZR, zona reticularis.
FIGURE 5
FIGURE 5
Trajectory analysis of spatial transcriptomics data in adult human normal adrenal glands. (A) Top: Integrated UMAP (Uniform Manifold Approximation and Projection) from both tissue sections analysed using the Visium assay (10x Genomics). The trajectory was visualised as a black line. Bottom: clusters identified in the integrated object transferred to the tissue (Visium) sections. (B) Pseudotime estimation both for the UMAP and the tissue sections: white circles represent the root node (chosen based on RSPO3 expression, indicated with a black arrow (right panel)). (C) Heatmap of 829 differentially expressed genes across pseudotime: cells were ordered by pseudotime (columns), and genes were ordered by expression and pseudotime (rows). The top genes are highlighted. (D) Expression variation of RSPO3, ID1, INSR and CYP11B2 over pseudotime: smoothed lines were generated based on the scatter profile of each gene (95% confidence interval displayed in grey around the line). Vertical lines represent the transition zones from 0‐Capsule (red) to 1‐ZG (green) and 1‐ZG to 2‐ZF‐ZR (ochre).
FIGURE 6
FIGURE 6
Identification of adenoma‐specific clusters in adrenocortical adenoma. (A) 1. Volcano plot depicting differentially expressed genes between normal adrenal glands (NAG) and endocrine‐inactive adenomas (EIA). Genes characteristic of the EIA subtype are written in bold. The x‐axis represents fold change (Log2FC) and the y‐axis represents P values (‐Log10P). 2. Volcano plot depicting differentially expressed genes between NAG and cortisol‐producing adenomas (CPA). Genes characteristic of the CPA subtype are written in bold. 3. Dot plots showing log normalized expression values of common signatures across the three subtypes (NAG, EIA, CPA). (B) UMAP (Uniform Manifold Approximation and Projection) representation of the 18 integrated samples (NAG, n = 6; CPA, n = 7; EIA, n = 5) coloured by cluster identity. The UMAP could be divided into two groups: the “central cluster” containing previously identified cortex cell types (ZG, ZF and ZR) as well as ZG‐like, adenoma‐specific clusters (AC1, AC2, AC3 and AC4), Cholesterol‐and steroid‐enriched metabolism (CSEM), and adenoma microenvironment (AME) clusters, and the “satellite” populations, which are medulla, myeloid cells, lymphoid cells, endothelial and stromal. NAG cell type distribution in the UMAP is represented within the top right box. C. Scaled average expression of selected markers for each cluster (dot size represents the percentage of cells in each cluster expressing the marker). (D) Subtype and sample‐specific composition coloured by cluster identity: samples (x‐axis) are ordered by mutational signatures.
FIGURE 7
FIGURE 7
Cluster distribution in ACA samples across subtype and mutational status. Distribution of (A) cholesterol‐and steroid‐enriched metabolism (CSEM) cluster in cortisol‐producing adenomas (CPA) versus endocrine‐inactive adenomas (EIA; upper panel) and across mutational status (lower panel); (B) Adenoma clusters (AC1‐4) across mutational status; (C) Lymphoid cluster across subtypes (upper panel) and mutational status (lower panel); (D) Myeloid cluster across subtypes (upper panel) and mutational status (lower panel). Significant cluster enrichments are encircled in red.

References

    1. Xing Y, Lerario AM, Rainey W, Hammer GD. Development of adrenal cortex zonation. Endocrinol Metab Clin North Am. 2015;44(2):243‐274. - PMC - PubMed
    1. Abou Nader N, Boyer A. Adrenal cortex development and maintenance: knowledge acquired from mouse models. Endocrinology. 2021;162(12):bqab187. - PubMed
    1. Basham KJ, Rodriguez S, Turcu AF, et al. A ZNRF3‐dependent Wnt/beta‐catenin signaling gradient is required for adrenal homeostasis. Genes Dev. 2019;33(3‐4):209‐220. - PMC - PubMed
    1. Dumontet T, Sahut‐Barnola I, Septier A, et al. PKA signaling drives reticularis differentiation and sexually dimorphic adrenal cortex renewal. JCI Insight. 2018;3(2):e98394. - PMC - PubMed
    1. Freedman BD, Kempna PB, Carlone DL, et al. Adrenocortical zonation results from lineage conversion of differentiated zona glomerulosa cells. Dev Cell. 2013;26(6):666‐673. - PMC - PubMed

MeSH terms

LinkOut - more resources