

KIR2DL2/DL3+NKs and Helios+Tregs in Peripheral Blood Predict Nivolumab Response in Patients with Metastatic Renal Cell Cancer
- PMID: 39167621
- PMCID: PMC11474171
- DOI: 10.1158/1078-0432.CCR-24-0729
KIR2DL2/DL3+NKs and Helios+Tregs in Peripheral Blood Predict Nivolumab Response in Patients with Metastatic Renal Cell Cancer
Abstract
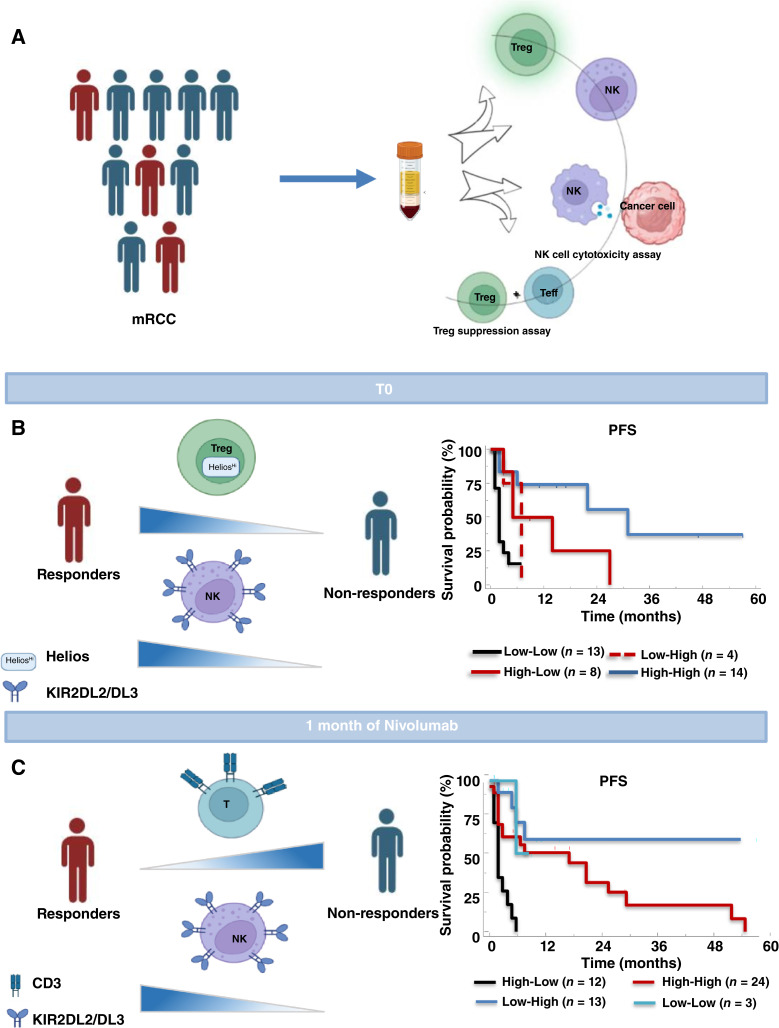
Purpose: To identify predictive factors of nivolumab sensitivity, peripheral blood NKs and regulatory T-cell (Treg) were evaluated in patients with metastatic renal cell carcinoma (mRCC) enrolled in the REVOLUTION trial.
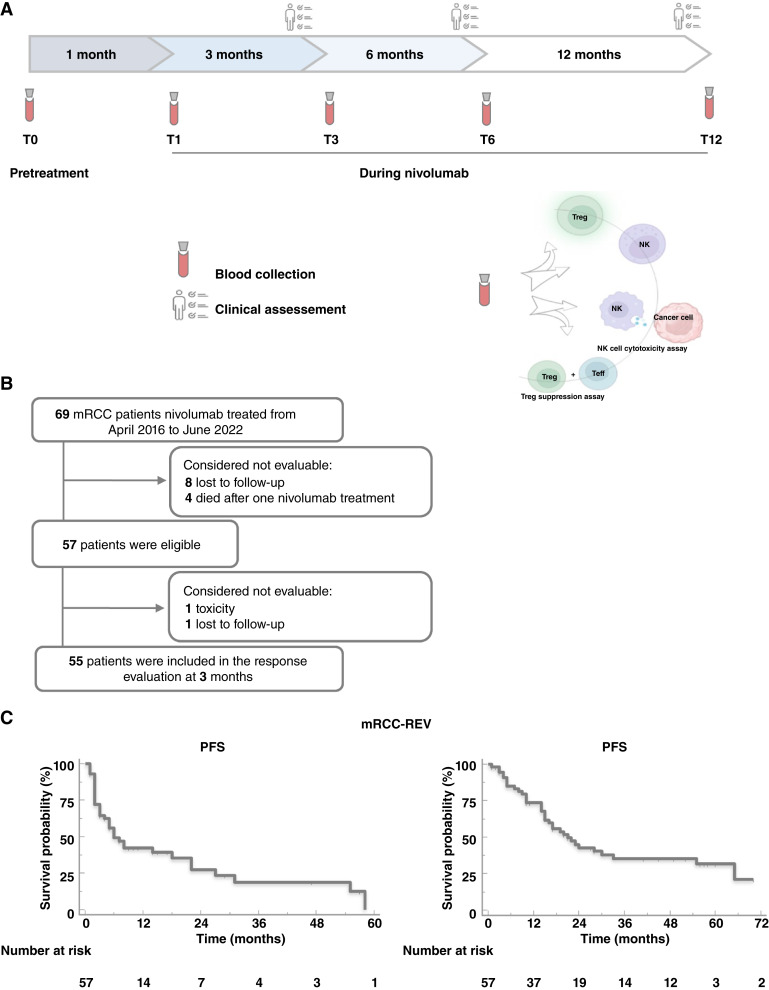
Experimental design: Fifty-seven mRCCs being treated with nivolumab, as at least second-line of therapy, and 62 healthy donors were longitudinally evaluated (0-1-3-6-12 months) for peripheral NKs and Tregs, phenotype, and function. Multivariable logistic regression was conducted to identify the independent predictors. The 0.632+ internal cross-validation was used to avoid overfitting. The best cutoff value based on a 3-month clinical response was applied to progression-free survival (PFS) and overall survival (OS). Kaplan-Meier curves for PFS and OS were produced.
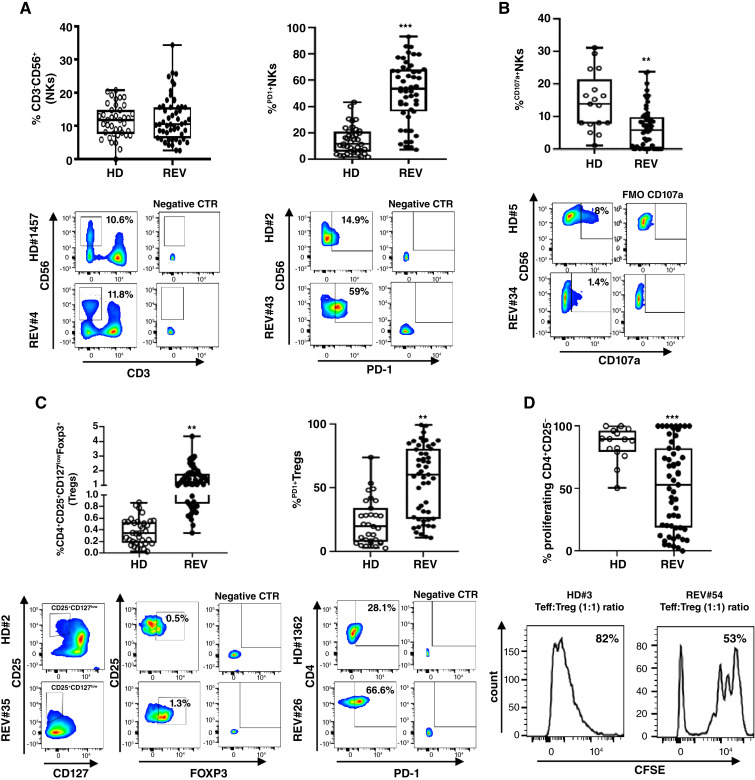
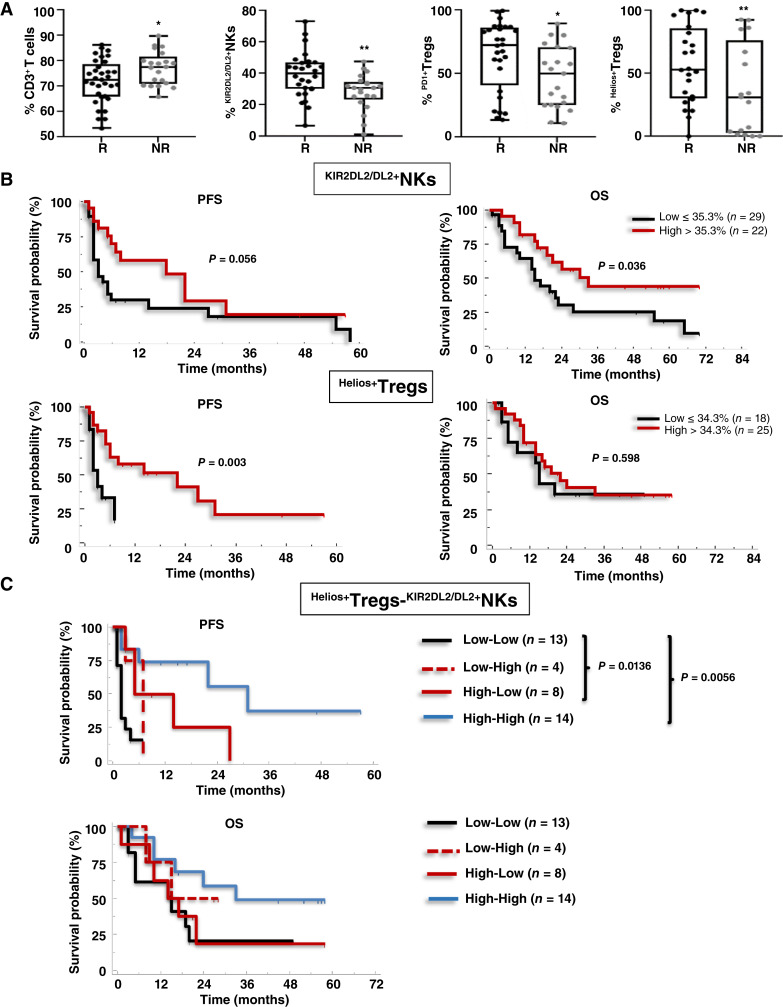
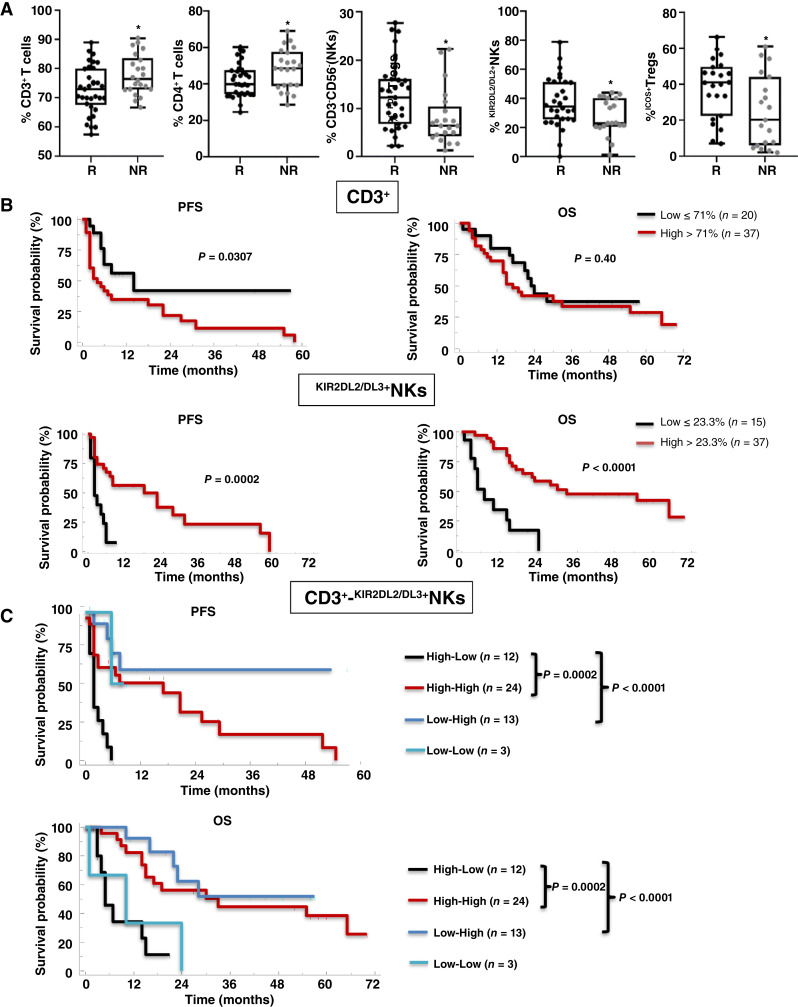
Results: At pretreatment, mRCCs displayed high frequency of NKp46+NKs, NKp30+NKs, KIR2DL1+NKs, KIR2DL2/DL3+NKs, and PD1+NKs with reduced NK degranulation as well as high frequency of Tregs, PD1+Tregs, Helios+Tregs, and ENTPD1+Tregs. Responder patients, identified as a clinical response after 3 months of treatment, presented at pretreatment significantly low CD3+, high KIR2DL2/DL3+NKs, high PD1+Tregs, and high Helios+Tregs. Upon multivariate analysis, only KIR2DL2/DL3NKs and Helios+Tregs held as independent predictors of nivolumab responsiveness. The KIR2DL2/DL3+NKs >35.3% identified patients with longer OS, whereas the Helios+Tregs >34.3% displayed significantly longer PFS. After 1-month of nivolumab, responder patients showed low CD3+, high NKs, KIR2DL2/DL3+NKs, and ICOS+Tregs. Among these subpopulations, CD3+ and KIR2DL2/DL3+NKs held as independent predictors of nivolumab efficacy. Low CD3+ (≤71%) was significantly associated with longer PFS, whereas high KIR2DL2/DL3+NKs (>23.3%) were associated with both PFS and OS.
Conclusions: Pretreatment evaluation of Helios+Tregs/KIR2DL2/DL3+NKs and 1-month posttreatment CD3+/ KIR2DL2/DL3+NKs will predict nivolumab response in mRCCs.
©2024 The Authors; Published by the American Association for Cancer Research.
Conflict of interest statement
H.J. Boyle reports non-financial support from BMS, Pfizer, Ipsen, and Merck outside the submitted work. J. Carles reports personal fees from Astellas Pharma, AstraZeneca, Bayer, Exelixis, Johnson & Johnson, Novartis (AAA), Pfizer, Sanofi, BMS, Ipsen, and Roche and grants from AB Science, Aragon Pharmaceuticals, Arog Pharmaceuticals, Astellas Pharma, AstraZeneca AB, Aveo Pharmaceuticals, Bayer AG, Blueprint Medicines Corporation, BN Immunotherapeutics, Boehringer Ingelheim España SA, Bristol-Myers Squibb International Corporation (BMS), Clovis Oncology, Cougar Biotechnology, Deciphera Pharmaceuticals, Exelixis, F. Hoffmann-La Roche, Genentech, GlaxoSmithKline SA, Incyte Corporation, Janssen-Cilag International NV, Laboratoires Leurquin Mediolanum SAS, Lilly SA, Medimmune, Millennium Pharmaceuticals, Nanobiotix SA, Novartis Farmacéutica SA, Pfizer SLU, Puma Biotechnology, Sanofi-Aventis SA, SFJ Pharma LTD II, and Teva Pharma SLU outside the submitted work. S. Pignata reports grants and personal fees from MSD, GSK, Roche, and AstraZeneca and personal fees from Novartis outside the submitted work. No conflicts of interest were disclosed by the other authors.
Figures
References
-
- Ferlay J, Colombet M, Soerjomataram I, Mathers C, Parkin DM, Piñeros M, et al. . Estimating the global cancer incidence and mortality in 2018: GLOBOCAN sources and methods. Int J Cancer 2019;144:1941–53. - PubMed
-
- Sung H, Ferlay J, Siegel RL, Laversanne M, Soerjomataram I, Jemal A, et al. . Global cancer statistics 2020: GLOBOCAN estimates of incidence and mortality worldwide for 36 cancers in 185 countries. CA Cancer J Clin 2021;71:209–49. - PubMed
-
- Gnarra JR, Tory K, Weng Y, Schmidt L, Wei MH, Li H, et al. . Mutations of the VHL tumour suppressor gene in renal carcinoma. Nat Genet 1994;7:85–90. - PubMed
MeSH terms
Substances
Grants and funding
LinkOut - more resources
Full Text Sources
Medical
Research Materials
