. 2024 Aug 23;10(34):eadp7706.
doi: 10.1126/sciadv.adp7706. Epub 2024 Aug 21.

Global expansion of human-wildlife overlap in the 21st century

Affiliations

Global expansion of human-wildlife overlap in the 21st century

Deqiang Ma et al. Sci Adv. .

Abstract

Understanding the extent to which people and wildlife overlap in space and time is critical for the conservation of biodiversity and ecological services. Yet, how global change will reshape the future of human-wildlife overlap has not been assessed. We show that the potential spatial overlap of global human populations and 22,374 terrestrial vertebrate species will increase across ~56.6% and decrease across only ~11.8% of the Earth's terrestrial surface by 2070. Increases are driven primarily by intensification of human population densities, not change in wildlife distributions caused by climate change. The strong spatial heterogeneity of future human-wildlife overlap found in our study makes it clear that local context is imperative to consider, and more targeted area-based land-use planning should be integrated into systematic conservation planning.


Figures

Fig. 1.
Fig. 1.. Current and projected distributions of human-wildlife overlap by 2070.
(A) Global distribution of human-wildlife overlap in 2015. (B) Global distribution of the human-wildlife overlap in 2070 averaged across 15 different SSP-RCP scenarios. (C) Relative changes in human-wildlife overlap between 2015 and 2070. The scale bars in (A) and (B) represent quintile values of the human-wildlife overlap index in 2015. The five categories of human-wildlife overlap in 2015 and 2070 were determined by quintiles bases on the values of human-wildlife overlap across the Earth’s surface in 2015. The scale bar in (C) represents the proportion of changes in the human-wildlife overlap index, shown as quartiles, among lands with decreases in human-wildlife overlap and lands with increases in human-wildlife overlap.
Fig. 2.
Fig. 2.. Projected changes in human-wildlife overlap for four land-type categories and for each continent.
(A) The proportion of the lands in each continent experiencing increases, decreases, and no changes in human-wildlife overlap. (B) The proportion of each land type with increases and decreases in human-wildlife overlap, and the median value and the 25th and 75th percentiles of the relative changes in human-wildlife overlap across each land type that excludes pixels with zero overlap by 2070. Results of (B) are the average value across three land-type change scenarios of SSP1-RCP 2.6, SSP2-RCP 4.5, and SSP5-RCP 8.5 scenarios, because data for land-type change by 2070 are only available under these three scenarios.
Fig. 3.
Fig. 3.. Changes in human population density and species richness by 2070.
(A) Bivariate map for relative changes in species richness versus relative changes in human population density in areas with projected increases in human-wildlife overlap by 2070 under SSP2-RCP4.5 scenario. (B) Bivariate map for relative changes in species richness with relative changes in human population density across the lands with projected decreases in human-wildlife overlap by 2070 under SSP2-RCP4.5 scenario. Changes in species richness and human population density were the relative changes under RCP-4.5 scenario and the human population density under SSP2 in 2070 relative to 2015. We chose to visualize the SSP2-RCP4.5 scenario, as it is the moderate scenario for human population growth and climate change.
Fig. 4.
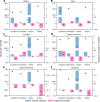
Fig. 4.. Changes in human population density and species richness in 2070 compared to those in 2015 for four land-type categories and for each continent.
(A) Africa, (B) Asia, (C) Europe, (D) North America, (E) South America, and (F) Oceania. Bar charts show absolute (bars) and relative changes (diamonds) in human population density and species richness for each land type. Unlike absolute changes, which are the changes in the index between 2070 and 2015, relative changes indicate how the value in 2070 changed relative to those in 2015 and controls for the global heterogeneity in distributions of human populations and species richness. Values are the average across three land-type change scenarios of SSP1-RCP 2.6, SSP2-RCP 4.5, and SSP5-RCP 8.5 scenarios, because data for land-type change by 2070 are only available under these three scenarios. Absolute changes and relative changes are calculated using the median value across each land type that excludes pixels with zero overlap, respectively.
Fig. 5.
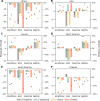
Fig. 5.. Changes in species richness in 2070 compared to those in 2015 in locations with increasing or decreasing human-wildlife overlap.
(A) Africa, (B) Asia, (C) Europe, (D) North America, (E) South America, and (F) Oceania. Bar charts show absolute (bars) and relative changes (diamonds) in species richness by taxa. Results of each plot are the average value across three land-type change scenarios of SSP1-RCP 2.6, SSP2-RCP 4.5, and SSP5-RCP 8.5 scenarios, because data for land-type change by 2070 are only available under these three scenarios. For each land-type change scenario, values of the absolute change and the relative change in species richness are the median value across each land type that excludes pixels with zero overlap, respectively.

References

    1. Barnosky A. D., Hadly E. A., Bascompte J., Berlow E. L., Brown J. H., Fortelius M., Getz W. M., Harte J., Hastings A., Marquet P. A., Martinez N. D., Mooers A., Roopnarine P., Vermeij G., Williams J. W., Gillespie R., Kitzes J., Marshall C., Matzke N., Mindell D. P., Revilla E., Smith A. B., Approaching a state shift in Earth’s biosphere. Nature 486, 52–58 (2012). - PubMed
    1. Carter N. H., Linnell J. D. C., Co-adaptation is key to coexisting with large carnivores. Trends Ecol. Evol. 31, 575–578 (2016). - PubMed
    1. Carter N. H., Linnell J. D. C., Building a resilient coexistence with wildlife in a more crowded world. PNAS Nexus 2, pgad030 (2023). - PMC - PubMed
    1. Carter N. H., Shrestha B. K., Karki J. B., Pradhan N. M. B., Liu J., Coexistence between wildlife and humans at fine spatial scales. Proc. Natl. Acad. Sci. U.S.A. 109, 15360–15365 (2012). - PMC - PubMed
    1. Ceauşu S., Graves R. A., Killion A. K., Svenning J. C., Carter N. H., Governing trade-offs in ecosystem services and disservices to achieve human–wildlife coexistence. Conserv. Biol. 33, 543–553 (2019). - PubMed