. 2024 Aug 23;10(34):eadl3975.
doi: 10.1126/sciadv.adl3975. Epub 2024 Aug 21.

A20 haploinsufficiency disturbs immune homeostasis and drives the transformation of lymphocytes with permissive antigen receptors

Affiliations

A20 haploinsufficiency disturbs immune homeostasis and drives the transformation of lymphocytes with permissive antigen receptors

Christoph Schultheiß et al. Sci Adv. .

Abstract

Genetic TNFAIP3 (A20) inactivation is a classical somatic lymphoma lesion and the genomic trait in haploinsufficiency of A20 (HA20). In a cohort of 34 patients with HA20, we show that heterozygous TNFAIP3 loss skews immune repertoires toward lymphocytes with classical self-reactive antigen receptors typically found in B and T cell lymphomas. This skewing was mediated by a feed-forward tumor necrosis factor (TNF)/A20/nuclear factor κB (NF-κB) loop that shaped pre-lymphoma transcriptome signatures in clonally expanded B (CD81, BACH2, and NEAT1) or T (GATA3, TOX, and PDCD1) cells. The skewing was reversed by anti-TNF treatment but could also progress to overt lymphoma. Analysis of conditional TNFAIP3 knock-out mice reproduced the wiring of the TNF/A20/NF-κB signaling axis with permissive antigen receptors and suggested a distinct regulation in B and T cells. Together, patients with the genetic disorder HA20 provide an exceptional window into A20/TNF/NF-κB-mediated control of immune homeostasis and early steps of lymphomagenesis that remain clinically unrecognized.


Figures
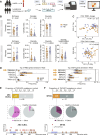
Fig. 1.
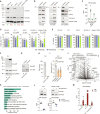
Fig. 1.. B and T cell receptors in blood lymphocytes of patients with HA20 and in lymphoma cohorts.
(A) Schematic representation of sequencing approach. Created with Biorender.com. (B) Mean (±SD) richness, clonality, Shannon diversity, and hypermutation rate for the productive IGH and TRB repertoires from patients with HA20 (n = 34) compared to healthy individuals (HD; n = 36). Statistical analysis: Unpaired two-sided t test. (C) PCA of TRBV and IGHV gene usage in patients with HA20 (n = 34) and HDs (n = 36). Statistical analysis: Pillai-Bartlett test of multivariate analysis of variance (MANOVA) of all principal components. (D) Median frequency of TRBV or IGHV gene usage for the top five V gene families in patients with HA20 (n = 34) and HDs (n = 36). Arrows indicate V genes commonly found in lymphoma clones. The boxes span the 25th to 75th percentiles; whiskers, the 10th to 90th percentile. (E) Proportion of patients with somatic TNFAIP3 mutations in the analyzed cohort of patients with diffuse large B cell lymphoma of activated B cell type (ABC DLBCL) (n = 68) and frequency of lymphoma clones with IGHV4-34 rearranged antigen receptors in TNFAIP3-mutated patients as compared to healthy donor (HD) immune repertoires (n = 36). Moreover, position and number of identified TNFAIP3 mutations in the ABC DLBCL cohort are shown. Red dots indicate missense mutations, dark dots nonsense or frameshifts. The TNFAIP3 OTU (ovarian tumor) domain mediates deubiquitinase activity, and the A20-type zinc fingers (ZF) mediates ubiquitin ligase activity. (F) Proportion of patients with somatic TNFAIP3 mutations in the analyzed MF/SS cohort (n = 27) and frequency of peripheral lymphoma clones with TRBV20-1 rearranged antigen receptors in TNFAIP3-mutated patients as compared to peripheral blood from HDs (n = 36). Position and number of identified TNFAIP3 mutations in the MF/SS cohort are shown. **P < 0.01; ***P < 0.001; ****P < 0.0001.
Fig. 2.
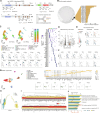
Fig. 2.. The signaling capacity and transcriptome of B cells with IGHV4-34–encoded antigen receptors.
(A) Ca2+ flux measurements in TKO cells transduced with the indicated lymphoma-derived IGHV4-34 or control BCRs after induction with 4-hydroxytamoxifen (4-OHT) and anti-IgM antibody. (B) UMAP projection of scRNA-seq data of IGHV4-34+ and non–IGHV4-34 B cells of a healthy individual. Cell proportions per cluster are shown as stacked bar plot and the top five differentially expressed genes per cluster as dot plot. (C) Proportion of class-switched cells per cluster. (D) TNFAIP3 expression in all IGHV4-34+ and non–IGHV4-34 B cells. Statistics: Mann-Whitney U test. (E) TNFAIP3 expression in IGHV4-34+ and non–IGHV4-34 clusters with at least 200 cells. Statistics: Mann-Whitney U test. (F) Volcano plot showing differential gene expression between IGHV4-34+ and non–IGHV4-34 B cells. Genes were considered differentially expressed with an adjust P < 0.01. (G) Autophagy and cytokine secretion score in IGHV4-34+ and non–IGHV4-34 B cells. (H) Proportion of antigen-experienced and naïve IGHV4-34 B cells. IGHV4-34 encoded BCRs with ≤98% sequence identity to the germline V gene are considered antigen-experienced. (I) Proportion of class-switched IGHV4-34+ B cells dependent on antigen experience. (J) TNFAIP3 expression in all IGHV4-34+ B cells depending on antigen experience. Statistics: Mann-Whitney U test. (K) Heatmap of top 50 differentially expressed genes in all IGHV4-34+ B cells depending on IGHV4-34 germline identity. ****P < 0.0001.
Fig. 3.
Fig. 3.. Effects of TNF antagonism on cytokine dysregulation and immune repertoire skewing in HA20.
(A) Immunoblotting of A20 and NF-κB status in PBMCs from patient HA20-1 and a healthy individual (HD). NF-κB activation was assessed by nuclear translocation of p65. (B) Mean (±SD) cytokine plasma levels of patient HA20-1 at initial presentation (day 0) and at indicated follow-up time points as compared to six HDs. Arrows indicate sampling days with subsequent infliximab application. All individuals were measured as technical duplicate. Statistics: ordinary one-way ANOVA. (C) Longitudinal monitoring of immune repertoire diversity, richness, and IGHV4-34 usage in patient HA20-1 at initial presentation and on therapeutic TNF antagonism (infliximab) as compared to six HD. **P < 0.01; ****P < 0.0001.
Fig. 4.
Fig. 4.. A20–NF-κB–dependent TNF secretion drives proliferation of in vitro cell models of lymphoma.
κ (A) Immunoblotting of A20 and NF-κB p65 in whole-cell extract from B cell lymphoma cell lines. (B) Immunoblotting of NF-κB p65 in cytosolic and nuclear fractions of indicated cell lines. TBP and glyceraldehyde-3-phosphate dehydrogenase (GAPDH) served as loading controls. (C) Quantification of mean (±SD) TNF secretion by indicated cell lines (n = 3 to 4 biological replicates). (D) Mean (±SD) proliferation and (E) viability of indicated cell lines (n = 6 biological replicates) after 72 hours of incubation with anti-TNF antibody infliximab or human IgG (Intratect). Dotted lines represent seeded cell number. (F) Immunoblotting of A20 and NF-κB p65 after lentiviral transduction of A20 in RI-1 cells. (G) Immunoblotting of NF-κB p65 in cytosolic and nuclear fractions after A20 reconstitution in RI-1 cells. (H) Mean (±SD) TNF secretion after lentiviral transduction of A20 in RI-1 cells (n = 3 biological replicates). (I) Mean (±SD) proliferation of A20-overexpressing RI-1 cells in the presence of infliximab (n = 4 biological replicates). Statistics: one-way ANOVA. (J) Volcano plot showing differential gene expression between RI-1 wt and RI-1 + pLeGO-A20 as determined by RNA-seq performed in duplicates. Genes were considered differentially expressed with an adjust P < 0.01 and log2 fold change >1. (K) Top down-regulated signaling pathways in RI-1 + pLeGO-A20 cells. All adjusted P values <0.0001. (L) Immunoblotting of NF-κB p65 in whole-cell extract and quantification of secreted TNF after incubation with 100 μM PDTC for 1 hour (n = 3 biological replicates). (M) Quantification of mean (±SD) TNF secretion after stimulation with 100 ng/ml recombinant TNF for 1 hour (n = 3 biological replicates). *P < 0.05; **P < 0.01.
Fig. 5.
Fig. 5.. TNFAIP3 gene targeting in the mononuclear phagocyte but not CD19 compartment increases plasma TNF and shapes the peripheral lymphocyte compartments.
(A) Schematic representation of mice breedings and treatments. Created with Biorender.com. (B) Quantification of mean (±SD) plasma cytokine levels in A20Cx3cr1-KO (n = 8) and A20fl/fl mice (n = 10). Statistics: two-sided t test. (C) Mean (±SD) immune repertoire metrics from peripheral lymphocytes (peripheral blood, spleen, and lymph nodes) and thymic lymphocytes of A20Cx3cr1-KO (n = 8) and A20fl/fl mice (n = 11). Injection with anti-TNF antibody as indicated in A20Cx3cr1-KO (n = 6) and A20fl/fl mice (n = 5). Statistics: two-sided t test. (D) PCA of TRBV gene distribution in peripheral and thymic lymphocytes of A20fl/fl (n = 11) and A20Cx3cr1-KO (n = 8). Statistics: Pillai-Bartlett test of MANOVA of all principal components. (E) Visualization of T cell clonotypes in indicated compartments from selected individual mice. Enriched clonotypes marked in colors with corresponding TRBV genes. (F) Quantification of mean (±SD) plasma cytokine levels of A20CD19-KO (n = 3) and A20fl/fl mice (n = 4). (G) Mean (±SD) immune repertoire metrics from peripheral lymphocytes (peripheral blood, spleen, and lymph nodes) lymphocytes of A20CD19-KO (n = 7) and A20fl/fl mice (n = 8). Statistics: two-sided t test. *P < 0.05; **P < 0.01.
Fig. 6.
Fig. 6.. Genomic and transcriptional signatures of HA20 suggest continuous trajectories toward lymphoma development.
(A) Gene panel analysis of patient HA20-14 who developed DLBCL after acquiring additional TNFAIP3 and MYD88 mutations. The BCR configuration of the malignant clone is indicated. nt, nucleotide; aa, amino acid; OTU, ovarian tumor protease deubiquitinase domain; zf, zinc finger; Death, Death domain; TIR, Toll/IL-1 receptor interacting domain; CDR3, Complementarity-determining region 3. (B) Connectivity analysis of nonmalignant peripheral B cell clones in the repertoire of patient HA20-14. Clones with Levenshtein distance ≤3 are considered connected. The numbers of connected IGHV gene sequences of the persisting network are shown as bars. (C) UMAP of integrated PBMC dataset from two patients with HA20 (HA20-1: 1454 cells; HA20-34: 6237 cells) and one HD (4741 cells). Cluster proportion as stacked bar plots. Top five differentially expressed genes per cluster as dot plots and expression of signature genes for cluster definition as feature plots. (D) Volcano plot showing differentially expressed genes between healthy and HA20 B cells. Only differences with adjusted P < 0.01 were considered relevant. (E) Expression score for indicated processes/pathways. (F) Chronic activation/exhaustion markers in HA20 and HD T cell subsets. (G) UMAP projection of 3457 single lymph node cells from an A20-deficient patient with ABC DLBCL. The top 10 differentially expressed genes per cluster are shown as dot plot and expression of key signature genes for identification of immune cell subsets as feature plot. (H) PHATE mapping revealed HA20 B cells (dark cyan) as intermediate group between healthy (light cyan) and ABC DLBCL B cells (yellow). (I) Heatmap showing the top 100 monotonically increasing or decreasing genes within the HD-HA20-ABC DLBCL trajectory. (J) Enrichment of GO Terms displayed as mean expression levels per group (upper axis). Red line and corresponding lower x axis indicate–log10 adjusted P values of enriched terms.

References

    1. Zhou Q., Wang H., Schwartz D. M., Stoffels M., Park Y. H., Zhang Y., Yang D., Demirkaya E., Takeuchi M., Tsai W. L., Lyons J. J., Yu X., Ouyang C., Chen C., Chin D. T., Zaal K., Chandrasekharappa S. C., Hanson E. P., Yu Z., Mullikin J. C., Hasni S. A., Wertz I. E., Ombrello A. K., Stone D. L., Hoffmann P., Jones A., Barham B. K., Leavis H. L., van Royen-Kerkof A., Sibley C., Batu E. D., Gul A., Siegel R. M., Boehm M., Milner J. D., Ozen S., Gadina M., Chae J., Laxer R. M., Kastner D. L., Aksentijevich I., Loss-of-function mutations in TNFAIP3 leading to A20 haploinsufficiency cause an early-onset autoinflammatory disease. Nat. Genet. 48, 67–73 (2016). - PMC - PubMed
    1. Aksentijevich I., Zhou Q., NF-κB pathway in autoinflammatory diseases: Dysregulation of protein modifications by ubiquitin defines a new category of autoinflammatory diseases. Front. Immunol. 8, 399 (2017). - PMC - PubMed
    1. Das T., Chen Z., Hendriks R. W., Kool M., A20/tumor necrosis factor α-induced protein 3 in immune cells controls development of autoinflammation and autoimmunity: Lessons from mouse models. Front. Immunol. 9, 104 (2018). - PMC - PubMed
    1. Hymowitz S. G., Wertz I. E., A20: From ubiquitin editing to tumour suppression. Nat. Rev. Cancer 10, 332–341 (2010). - PubMed
    1. Tavares R. M., Turer E. E., Liu C. L., Advincula R., Scapini P., Rhee L., Barrera J., Lowell C. A., Utz P. J., Malynn B. A., Ma A., The ubiquitin modifying enzyme A20 restricts B cell survival and prevents autoimmunity. Immunity 33, 181–191 (2010). - PMC - PubMed

Publication types

MeSH terms

Substances

LinkOut - more resources