. 2024 Aug 23;10(34):eadn6016.
doi: 10.1126/sciadv.adn6016. Epub 2024 Aug 21.

Phosphoglycerate kinase is a central leverage point in Parkinson's disease-driven neuronal metabolic deficits

Affiliations

Phosphoglycerate kinase is a central leverage point in Parkinson's disease-driven neuronal metabolic deficits

Alexandros C Kokotos et al. Sci Adv. .

Abstract

Although certain drivers of familial Parkinson's disease (PD) compromise mitochondrial integrity, whether metabolic deficits underly other idiopathic or genetic origins of PD is unclear. Here, we demonstrate that phosphoglycerate kinase 1 (PGK1), a gene in the PARK12 susceptibility locus, is rate limiting in neuronal glycolysis and that modestly increasing PGK1 expression boosts neuronal adenosine 5'-triphosphate production kinetics that is sufficient to suppress PARK20-driven synaptic dysfunction. We found that this activity enhancement depends on the molecular chaperone PARK7/DJ-1, whose loss of function significantly disrupts axonal bioenergetics. In vivo, viral expression of PGK1 confers protection of striatal dopamine axons against metabolic lesions. These data support the notion that bioenergetic deficits may underpin PD-associated pathologies and point to improving neuronal adenosine 5'-triphosphate production kinetics as a promising path forward in PD therapeutics.


Figures

Fig. 1.
Fig. 1.. PGK1 activation restores synaptic function under hypometabolic conditions.
(A) Assay schematic: Cultured primary hippocampal neurons expressing vGlutI-pH or synapto-iATPSnFR2-miRFP670nano3 were incubated in imaging medium of interest for 5 min before 10 bouts of AP firing (100 APs at 10 Hz, highlighted as black bars in the traces) delivered every minute. Created using Biorender.com. (B) Ensemble average vGlutI-pH responses are normalized to the maximal sensor fluorescence revealed by perfusion with 50 mM NH4Cl. With sufficient fuel (5 mM glucose, teal), efficient SV recycling persists for all rounds of stimulation, but in low glucose (0.1 mM glucose, blue), SV recycling gradually slows, resulting in a net accumulation of fluorescence. (C) The ensemble average fraction of the fluorescence remaining 55 s after stimulation for each bout for high- and low-glucose conditions. Means ± SEM for the data shown in (B). 5 mM glucose, n = 5; 0.1 mM glucose, n = 23. *P < 0.05 and **P < 0.01, two-way analysis of variance (ANOVA). (D) Ensemble average vGlutI-pH fluorescence in neurons expressing PGK1-HALO (red) and Terazosin-treated (green) shows that synaptic endurance is restored compared to 0.1 mM glucose control (blue). (E) The remaining fluorescence 55 s after stimulation after each train is plotted. Means ± SEM. Control, n = 23; PGK1-HALO, n = 12. **P < 0.01 and ***P < 0.001, two-way ANOVA multiple comparisons to control. Terazosin, n = 10. ##P < 0.01 and ###P < 0.001, two-way ANOVA multiple comparisons to control. (F) PGK1 (magenta) and synapsin I/II (cyan) immunofluorescence shows that PGK1 is present in nerve terminals (white arrows). Scale bar, 6 μm.
Fig. 2.
Fig. 2.. PGK1 activation locally accelerates synaptic ATP production.
(A) Ensemble average synapto-iATPSnFR2-miRFP670nano3 traces for 0.1 mM glucose control (blue), PGK1-HALO (red), and TZ-treated (green) transfected cells stimulated with 600 APs at 10 Hz. PGK1-HALO and TZ neurons show a significant activity-dependent up-regulation of ATP synthesis following activity. Comparison of absolute nerve terminal ATP values (B) before stimulus and normalized values (C) at the end of the stimulus [left dotted line in (A)] and (D) 50 s after stimulus [right dotted line in (A)] in control, PGK1-HALO–expressing, and TZ-treated neurons. Means ± SEM. Control, n = 12; PGK1-HALO, n = 10; TZ, n = 17. *P < 0.05 and **P < 0.01, one-way ANOVA. ns, not significant.
Fig. 3.
Fig. 3.. PGK1 expression restores PARK20 synaptic dysfunction.
Ensemble average vGlutI-pH traces in primary WT (A) and PARK20/Synj1 R258Q knock-in (B) mouse cortical neurons stimulated with 600 APs (10 Hz, indicated by the black bar) in 5 mM glucose with PGK1-HALO expression (red) or without (teal). (C) Quantification of the remaining fluorescence of the vGlutI-pH traces 60 s after stimulation (indicated by the dotted line). Means ± SEM. WT, n = 5; WT + PGK1-HALO, n = 10; Park20, n = 13; Park20 + PGK1-HALO, n = 16. *P < 0.05 and **P < 0.01, one-way ANOVA.
Fig. 4.
Fig. 4.. PARK7/DJ-1 is necessary for axonal PGK1 activity.
(A) Immunostaining against PGK1 (magenta), synapsin I/II (yellow), and DJ-1 (cyan) shows that DJ-1 and PGK1 are both present in nerve terminals (white arrows). Scale bar, 2 μm. Created using Biorender.com (B) KD of DJ-1 (black) slows SV endocytosis kinetics compared to 0.1 mM glucose control (blue) vGlutI-pH–transfected cells, when neurons were challenged with 600 APs delivered at 10 Hz (black bar) . PGK1-HALO expression (red) or TZ incubation (green) failed to restore SV kinetics. (C) Quantification of the remaining fluorescence 60 s after stimulation [dotted line in (B)]. Means ± SEM. Control, n = 16; DJ-1 KD, n = 12; DJ-1 KD + PGK1-HALO, n = 13; DJ-1 KD + 10 μM TZ, n = 11; (ns) P > 0.05 and *P < 0.05, one-way ANOVA. (D) Cumulative histogram of presynaptic PGK1 fluorescence immunostaining intensity in control (gray) and DJ-1 KD nerve terminals (pink). DJ-1 KD, n = 171; nontransfected, n = 500. (E) DJ-1 fluorescence immunostaining in control (gray) and PGK1 KD nerve terminals (yellow). PGK1 KD, n = 289; nontransfected, n = 500. Distributions in both KDs are significantly different from their respective controls. P < 0.001, Kolmogorov-Smirnoff test. (F) MST identified an in vitro interaction between PGK1 and DJ-1 with a low micromolar affinity (~15 μM).
Fig. 5.
Fig. 5.. PARK7/DJ-1 is required for PGK1-mediated synaptic resilience.
(A) The kinetics of presynaptic ATP normalized to the prestimulus values when neurons were stimulated with 600 APs at 10 Hz in 0.1 mM glucose (blue) and in the absence of DJ-1 (black) reveal a significantly larger activity-induced drop in ATP and defective poststimulus recovery. Comparison of absolute nerve terminal ATP values before stimulus (B) and normalized values at the end of the stimulus (C) and 50 s after stimulus (D) in control and DJ-1 KD neurons. Means ± SEM. Control, n = 12; DJ-1 KD, n = 11. *P < 0.05 and ***P < 0.001, unpaired t test. (E) The kinetics of presynaptic ATP normalized to the prestimulus values when neurons were stimulated with 600 APs at 10 Hz in 0.1 mM glucose with PGK1-HALO and DJ-1 KD (dark red) reveal an inability of PGK1 to accelerate ATP kinetics in absence of DJ-1. Comparison of absolute nerve terminal ATP values before stimulus (F) and normalized values at the end of the stimulus (G) and 50 s after stimulus (H) in PGK1-HALO with and without DJ-1 KD neurons. Means ± SEM. PGK1-HALO, n = 10; PGK1-HALO + DJ-1 KD, n = 5. *P < 0.05 and **P < 0.01, unpaired t test. (I) The kinetics of presynaptic ATP normalized to the prestimulus values when neurons were stimulated with 600 APs at 10 Hz in 0.1 mM glucose in TZ and DJ-1 KD (dark green) reveal an inability of TZ to accelerate ATP kinetics in absence of DJ-1. Comparison of absolute nerve terminal ATP values before stimulus (J) and normalized values at the end of the stimulus (K) and 50 s after stimulus (L) in TZ and TZ with DJ-1 KD neurons. Means ± SEM. TZ, n = 17; TZ + DJ-1 KD, n = 8. *P < 0.05 and ***P < 0.001, unpaired t test.
Fig. 6.
Fig. 6.. PGK1 expression in vivo protects against dopaminergic axon degeneration.
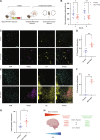
(A) An AAV-driving hSyn PGK1-mRuby was injected unilaterally in the substantia nigra 30 days before 6-OHDA was injected in the MFB, with control mice only receiving the 6-OHDA injections. At 30 or 90 days after the 6-OHDA injection, mice were subjected to apomoprhine-induced rotation tests. (B) PGK1-mRuby expression significantly suppressed the apomorphine-induced rotations. Means ± SEM. Control, n = 11; AAV PGK1, n = 10. *P < 0.05 and **P < 0.01, two-way ANOVA. (C) Immunostaining of control and AAV PGK1 mid-brain brain slices against 4′,6-diamidino-2-phenylindole (DAPI), mRuby, and TH. Scale bars, 50 μm. (D) Quantification of the number of TH-positive cells showed a significant increase in animals receiving the PGK1 AAV. Control, n = 7; AAV PGK1, n = 7. **P < 0.01, unpaired t test. (E) Before immunostaining, the striata of the animals were injected with the retrograde tracer cholera toxin subunit b (Ctb). Scale bars, 100 μm. (F) Quantification of the number of Ctb-positive cells also showed a significant increase after lesion in case of the PGK1 AAV. Control, n = 3; AAV PGK1, n = 3. **P < 0.01, unpaired t test. (G) Quantification of the number of DAT-positive cells showed a significant increase in in animals receiving the PGK1 AAV. Control, n = 7; AAV PGK1, n = 7. *P < 0.05, unpaired t test. (H) Human brain energetics decline physiologically with age, one of the most important risk factors in PD. Several PARK animal models (red) exhibit deficits in energy homeostasis. Up-regulating PGK1 activity (part of PARK12) and its necessary partner PARK7/DJ-1 has now been shown to rescue at least four different PARK genes (green), proposing a crucial unifying theme of neuronal hypometabolism in PD pathology. (H) created using Biorender.com.

Update of

References

    1. Rangaraju V., Calloway N., Ryan T. A., Activity-driven local ATP synthesis is required for synaptic function. Cell 156, 825–835 (2014). - PMC - PubMed
    1. Ashrafi G., Wu Z., Farrell R. J., Ryan T. A., GLUT4 mobilization supports energetic demands of active synapses. Neuron 93, 606–615.e3 (2017). - PMC - PubMed
    1. Ashrafi G., de Juan-Sanz J., Farrell R. J., Ryan T. A., Molecular tuning of the axonal mitochondrial Ca2+ uniporter ensures metabolic flexibility of neurotransmission. Neuron 105, 678–687.e5 (2020). - PMC - PubMed
    1. Mosconi L., De Santi S., Li J., Tsui W. H., Li Y., Boppana M., Laska E., Rusinek H., de Leon M. J., Hippocampal hypometabolism predicts cognitive decline from normal aging. Neurobiol. Aging 29, 676–692 (2008). - PMC - PubMed
    1. Pickrell A. M., Youle R. J., The roles of PINK1, Parkin, and mitochondrial fidelity in Parkinson’s disease. Neuron 85, 257–273 (2015). - PMC - PubMed

Publication types

Substances