. 2024 Aug 21;16(761):eadn0904.
doi: 10.1126/scitranslmed.adn0904. Epub 2024 Aug 21.

Modified C-type natriuretic peptide normalizes tumor vasculature, reinvigorates antitumor immunity, and improves solid tumor therapies

Affiliations

Modified C-type natriuretic peptide normalizes tumor vasculature, reinvigorates antitumor immunity, and improves solid tumor therapies

Zhen Lu et al. Sci Transl Med. .

Abstract

Deficit of oxygen and nutrients in the tumor microenvironment (TME) triggers abnormal angiogenesis that produces dysfunctional and leaky blood vessels, which fail to adequately perfuse tumor tissues. Resulting hypoxia, exacerbation of metabolic disturbances, and generation of an immunosuppressive TME undermine the efficacy of anticancer therapies. Use of carefully scheduled angiogenesis inhibitors has been suggested to overcome these problems and normalize the TME. Here, we propose an alternative agonist-based normalization approach using a derivative of the C-type natriuretic peptide (dCNP). Multiple gene expression signatures in tumor tissues were affected in mice treated with dCNP. In several mouse orthotopic and subcutaneous solid tumor models including colon and pancreatic adenocarcinomas, this well-tolerated agent stimulated formation of highly functional tumor blood vessels to reduce hypoxia. Administration of dCNP also inhibited stromagenesis and remodeling of the extracellular matrix and decreased tumor interstitial fluid pressure. In addition, treatment with dCNP reinvigorated the antitumor immune responses. Administration of dCNP decelerated growth of primary mouse tumors and suppressed their metastases. Moreover, inclusion of dCNP into the chemo-, radio-, or immune-therapeutic regimens increased their efficacy against solid tumors in immunocompetent mice. These results demonstrate the proof of principle for using vasculature normalizing agonists to improve therapies against solid tumors and characterize dCNP as the first in class among such agents.


Conflict of interest statement

Competing interests:

G.M.C., Y.Y., R.E.G., A.N.-A., K.B., H.T., T.N., N.M.B. and E.M.B. are employees or advisors of PharmaIN Corp. PharmaIN Corp. holds the patents (WO/2021/252931 and WO/2018/175534) for PHIN-1314 (dCNP) and has partially sponsored research conducted at the University of Pennsylvania or Kyushu University. All other authors have had full access to all the data in the study and take responsibility for the integrity of the data and the accuracy of the data analysis. E.P. is a scientific founder and holds equity in Capstan Therapeutics. E.P. is on the scientific advisory boards of Parthenon Therapeutics and POINT Biopharma. S.Y.F. is a scientific founder and holds equity in Verendas Pharma Inc.

Figures
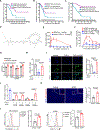
Fig. 1.
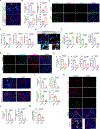
Fig. 1.. Alterations of CNP-NPR2/3 axis in human tumors and effects of dCNP on mice and ECs.
(A) Association between CNP expression and overall survival in human PDAC (n=45 patients from cBioPortal dataset). (B) Association between NPR2 expression and overall survival in human lung adenocarcinoma (n=131 patient from cBioPortal dataset). (C) Association between NPR3 expression and overall survival in human kidney renal clear cell adenocarcinoma (n=147 patients from cBioPortal dataset). (D) Structure of dCNP. (E) ELISA analysis of CNP concentration in plasma of naive C57BL/6J mice administered with native CNP or dCNP (n=5). (F) TRFRET analysis of the cGMP concentration in plasma of mice administered with native CNP or dCNP at indicated doses (n=4). (G) Analysis of cGMP concentration in human pulmonary artery endothelial cells (HPAECs) that received control shRNA or shRNA against NPR1/NPR2/NPR3 and were treated with vehicle or dCNP at 0.1μg/mL for 1 hr (n=6). (H) qPCR analysis of Angpt1 expression in HPAECs treated with TNF-α (10ng/ml) in the presence or absence of dCNP (0.1μg/ml) for 48 hr (n=3). (I) Immunofluorescence analysis of VE-Cadherin expressed in HPAECs treated with TNFα (10ng/ml) in the presence or absence of dCNP (0.1μg/ml) for 4 hr (n=3). Scale bar: 100 μM. (J) Analysis of VE-Cadherin expression in HPAECs that received control shRNA or shRNA against NPR1/NPR2/NPR3 and were treated with TNFα (10ng/ml) in the presence or absence of dCNP (0.1μg/ml) for 4 hr (n=3). (K) Immunofluorescence analysis of VE-Cadherin expressed in s.c. B16F10 tumors from mice treated with vehicle or dCNP (0.3mg/kg s.c. for 5 days); n=5. Scale bar: 100 μM. (L) Flow cytometry analysis of VE-Cadherin and ICAM-1 expressed on the surface of ECs isolated from MC38 tumors from mice treated with vehicle or dCNP (n=5). Data are presented as mean ± SEM. Statistical analysis was performed using log-rank (Mantel-Cox) test (A, B and C) or 1-way ANOVA with Tukey’s multiple-comparison test (E and F) or 2-tailed Students’ t test (G, H, I, J, K and L).
Fig. 2.
Fig. 2.. dCNP treatment reprograms the expression pattern of genes associated with angiogenesis, responses to hypoxia, stromagenesis, and immune responses.
(A) Volcano plot of differentially expressed genes in s.c. MC38 tumors from C57BL/6J mice treated with vehicle or dCNP starting from 7 days after inoculation, s.c. 0.3mg/kg for 10 days (n=3). (B) Heatmap of differentially expressed genes in MC38 tumors treated as in (A). (C) GSEA of hypoxia-associated pathways in MC38 tumors treated as in (A). (D) KEGG enrichment analysis of altered pathways (compared to vehicle) in MC38 tumors treated as in (A). (E) GSEA of T cell activation pathways in MC38 tumors treated as in (A). (F) qPCR analysis of Hif1α and Hif2α expression in MC38 tumors from mice treated with vehicle or dCNP (n=5). (G) qPCR analysis of angiogenesis-associated genes expression in MC38 tumors from mice treated with vehicle or dCNP (n=5). Data are presented as mean ± SEM. Statistical analysis with DESeq2 was based on negative binomial regression (Wald test), statistical analysis with GSEA was based on permutation test, all other statistical analyses were performed using a 2-tailed Students’ t test.
Fig. 3.
Fig. 3.. dCNP normalizes tumor vasculature, alleviates hypoxia, and inhibits stromagenesis.
(A) A representative image of hypoxic (pimonidazole-positive) cells and ECs (CD31+) within orthotopic MC38 colon tumors from C57BL/6J mice treated with vehicle or dCNP starting from7 days after inoculation, s.c., 0.6mg/kg for 10 days. (B) Quantification of hypoxia, CD31 positive area, vessel length and number in (A) (n=5). (C) Representative images of ECs (CD31+), perfused FITC-lectin (LECTIN+) and pericytes (NG2+) in orthotopic MC38 tumors from mice treated as in (A) and i.v. injected with FITC-lectin. (D) Quantification of FITC-lectin perfusion (ratio Lectin/CD31), pericytes coverage (ratio NG2/CD31) and vessels tortuosity, from experiment described in (C) (n=5). (E) Representative images of Texas Red-labeled dextran and blood vessels (CD31+) in s.c. MC38 tumor treated with vehicle or dCNP (0.3mg/kg) for 10 days. (F) Quantification of dextran positive area intra- and extra-vessel and ratio (extra-vessel/ intra-vessel) from the experiment described in (E) (n=5). (G) Expression of Hyaluronan and Collagen-I in orthotopic MC38 colon tumors from mice treated with or without dCNP (0.6mg/kg) (n=5). (H) Quantification of Hyaluronan and Collagen-I positive area, and the ratio of these positive areas to CD31 shown in (G) (n=5). (I) Representative images of blood vessels (CD31+), FAP and Collagen-1 in s.c. MH6419c5 tumors from C57BL/6J mice treated with dCNP (7 days after inoculation, 0.3mg/kg/day) once daily for 10 days. (J) Quantification of FAP and Collagen-1 positive areas and ratio of these positive areas to CD31 from s.c. MH6419c5 tumors described in (I) (n=5). (K) Representative image of blood vessels (CD31+), CAFs (FAP+) and fibronectin in s.c. MC38 tumors treated with dCNP (0.3mg/kg) once daily for 10 days. (L) Quantification of FAP and Fibronectin positive areas in s.c. MC38 tumors shown in (K) (n=5). (M) Analysis of tumor interstitial fluid pressure in s.c MH6499c4 tumor from mice treated with vehicle (n=8) or dCNP (0.3mg/kg, n=9) once daily for 10 days. Data are presented as mean ± SEM. Quantification averaged from 5 random fields in sections from each of 5 animals is shown. Scale bar: 100 μM. Statistical analysis was performed using a 2-tailed Students’ t test.
Figure 4.
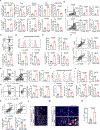
Figure 4.. dCNP treatment improves immune responses and prevents T cell exhaustion in the TME.
(A) Frequencies (% of CD45+ cells) and absolute numbers (per gram of tumor tissue) of indicated immune cells isolated from s.c.MC38 tumors from C57BL/6J mice treated with vehicle or dCNP (7 days after inoculation, 0.3mg/kg) (n=5). (B) Frequencies (% of CD45+) and numbers (per gram of tissue) of CD3+CD8+ and CD3+CD4+ T cells isolated from orthotopic MC38 tumors from C57BL/6J mice treated with vehicle or dCNP (7 days after inoculation, 0.6mg/kg) (n=5). (C) Frequencies of IFN-γ+CD8+ T cells on these cells from orthotopic MC38 tumors described in (B) (n=5). (D) Analysis of MFI of CD69 and TIM3 expression on CD8+ T cells from the orthotopic MC38 tumors described in (B) (n=5). (E) Frequencies and numbers of conventional DC1s and PMN-MDSCs in the orthotopic MC38 tumors described in (B) (n=5). (F) Frequencies and numbers of CD4+CD25+Foxp3+ Tregs cells in orthotopic MC38 tumors described in (B) (n=5). (G) Flow cytometry analysis of percentage and number of CD3+CD8+ T cells in orthotopic MH6419c5 tumors from C57BL/6J mice treated with vehicle or dCNP (7 days after inoculation, 0.6mg/kg) (n=5). (H) Flow cytometry analysis of percentage of IFN-γ+CD8+ T cells from orthotopic MH6419c5 tumors from mice treated as in (G) (n = 5). (I) Analysis of MFI of CD69 and TIM3 expression on CD8+ T cells isolated from orthotopic MH6419c5 tumors from mice treated as (G) (n = 5). (J) Frequencies and numbers of cDC1s and PMN-MDSCs in orthotopic MH6419c5 tumors from experiment described in (G) (n=5). (K) Flow cytometry analysis of frequencies and numbers of CD4+CD25+Foxp3+ Tregs cells in orthotopic MH6419C5 tumors from experiment described in (G) (n=5). (L) Representative image of T cells infiltration at the edge area of s.c.MC38OVA tumors growing in C57BL/6J Rag1−/− mice adoptively transferred with OT-I+ T cells (2×10⁷/mouse, 14 days after inoculation) following vehicle or dCNP (10 days after inoculation, 0.3mg/kg) treatment. (M) Representative image of T cells infiltration inside of s.c.MC38OVA tumors described in (L). (N) Quantification of numbers of CD8+ T cells infiltrating the tumors described in (L) (n=5). Data are presented as mean ± SEM. Quantification averaged from 5 random fields in sections from each of 5 animals is shown. Scale bar: 100 μM. Statistical analysis was performed using 2-tailed Students’ t test.
Figure 5.
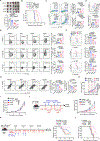
Figure 5.. dCNP treatment inhibits tumor growth and metastasis.
(A) Schematic illustration for testing the anti-tumor efficacy of dCNP in subcutaneous PDAC model. MH6419c5 cells were inoculated into C57BL/6J mice followed by dCNP treatment (0.3mg/kg, 7 days after inoculation) for 2 rounds (n=6). (B) Tumor volumes and masses from experiment described in (A) (n=6). (C) Volumes (top) of s.c. MH6499c4 tumors from mice treated daily with vehicle (n=6) or dCNP with different doses; Corresponding survival analysis (bottom) of tumor-bearing mice treated daily with different dose (0.15mg/kg, n=6; 0.3 or 0.6 mg/kg, n=12). (D) Schematic illustration for testing the anti-tumor efficacy of dCNP (0.6mg/kg) in orthotopic MC38 tumor model (n=5). (E) Representative images and tumor masses of orthotopic MC38 tumors described in (D) (n=5). (F) Kaplan-Meier analysis of survival of tumor-bearing mice described in (D) (n=5). (G) Schematic illustration for testing the anti-tumor efficacy of dCNP in orthotopic PDAC model. MH6419c5 cells were inoculated into C57BL/6J mice followed by dCNP treatment (0.6mg/kg, 7 days after inoculation) for 2 rounds (n=4). (H) Representative images and masses of orthotopic tumors from the experiment described in (G) (n= 4). (I) Kaplan-Meier analysis of survival of mice described in (G) (n=7). (J) Schematic illustration for testing the effect of dCNP as a neoadjuvant therapy against melanoma metastases. B16F10 cells were s.c. inoculated into C57BL/6J mice and treated with dCNP (0.6mg/kg, 7 days after inoculation) for 5 days (n=5). Tumors then were removed through surgery 18 days after inoculation and lung tissues were harvested at 2, 4 and 6 weeks after surgery. (K) Representative images and quantification of lung metastatic nodules in mice described in (J) (n=5 for each treatment). (L) Representative H&E staining images of lung metastatic lesions in mice described in (J). Scale bar: 1 cm. (M) Quantification of lung metastatic lesion numbers and area in mice described in (J) (n=5). (N) Kaplan-Meier analysis of survival of a separate cohort of mice treated as in (J) (vehicle n=8; dCNP n=7). Data are presented as mean ± SEM. Statistical analysis was performed using 2-tailed Students’ t test (B, E, H, K and M) or 2-way ANOVA with Sidak’s multiple-comparison test (B and C) or log rank test (C, F, I and N).
Figure 6.
Figure 6.. dCNP improves the outcomes of chemo-/radiotherapies.
(A) Schematic illustration for testing the effect of dCNP on FOLFOX-based chemotherapy in the orthotopic colon cancer model. MC38 cells were inoculated into cecum of C57BL/6J mice followed by FOLFOX (7, 14 and 21 days after inoculation) and dCNP (7 days after inoculation, s.c. 0.6mg/kg for 10 days) treatment. (B) Representative of tumor images and masses from experiment described in (A) (n=5). (C) Kaplan-Meier analysis of survival of mice bearing orthotopic MC38 tumors and treated with vehicle (n=7), FOLFOX (n=7), dCNP (n=8) or combination (n=6). (D) Flow cytometry analysis of CD3+CD8+ T cell infiltration in orthotopic MC38 tumors described in (A) (n=5). (E) Frequencies of CD3+CD8+ T cells, Tregs and PMN-MDSCs from orthotopic MC38 tumors described in (A) (n=5). (F) Flow cytometry analysis of percentage of IFN-γ+CD8+ T and CD69+CD8+ T cell in orthotopic MC38 tumors described in (A). (G) Analysis of percentage of IFN-γ+, CD69+, and Ki67+ CD8+ T cells isolated from orthotopic MC38 tumors described in (A) (n = 5). (H) Schematic illustration for combining dCNP with radiotherapy in melanoma model. B16F10 cells were s.c. inoculated into C57BL/6J mice followed by dCNP treatment (0.6mg/kg, 5 days after inoculation) and radiotherapy (8Gy, 10 days after inoculation). (I) Growth of B16F10 in C57BL/6 mice treated with vehicle, dCNP (0.6mg/kg), radiation (8Gy) or combination (n=8). (J) Kaplan-Meier analysis of survival analysis of melanoma-bearing mice treated with vehicle, dCNP, radiation, or combination (n=8). Data are presented as mean ± SEM. Statistical analysis was performed using 2-tailed Students’ t test (B, E and G) or 2-way ANOVA with Sidak’s multiple-comparison test (I) or log rank test (C and J).
Figure 7.
Figure 7.. dCNP improves the outcomes of immune checkpoint blockade.
(A) Representative images and masses of MH6499c4 orthotopic PDAC tumors from C57BL/6J mice treated with vehicle, anti-PD-1 (i.p., 4mg/kg, 9, 13 and 17 days after inoculation), dCNP (0.6mg/kg, 7 days after inoculation, 2 rounds), or combination (n=5 for each group). (B) Survival analysis of a separate cohort of MH6499c4 orthotopic tumor-bearing mice treated as described in (A) (n=6). (C) Flow cytometry analysis of frequencies and number of CD3+CD8+ T cells in s.c. MH6419C5 tumors from C57BL/6J mice treated with vehicle, anti-PD-1 (i.p., 4mg/kg, 9, 13 and 17 days after inoculation), dCNP (0.3mg/kg, 7 days after inoculation, 2 rounds), or combination (n=6 for each group), and tumors were collected for flow cytometry analysis 25 days after inoculation. (D) Analysis of mean fluorescence intensity (MFI) of CD69 on CD8+ T cells in tumors described in (C) (n=6). (E) Percentage of IFN-γ+, Gran B+- or Ki 67+ CD8+ T cells on CD8+ T cells in tumors described in (C) (n=6). (F) MFI of PD-1, TIM3 and LAG3 on CD8+ T cell isolated from in tumors described in (C) (n=6). (G) Flow cytometry analysis of percentage and number of Treg cells in tumors described in (C) (n=6). (H) Growth of s.c. RENCA tumors in Balb/c mice treated with vehicle (n=11), dCNP (1mg/kg, n=10), anti-PD-1 (5mg/kg, n=11) or combination (n=10). “R” refers to rounds including dCNP daily treatment (red dashed lines). (I) Growth of orthotopic E0771 mammary carcinoma tumors in C57BL/6J mice treated with vehicle, dCNP (0.3mg/kg), anti-PD1 antibody (5mg/kg) or dCNP+anti-PD-1 as indicated (n=10). Survival for a similar experiment (different cohorts) is shown in fig. S7G. (J) Schematic (left) and growth (right) of s.c. RM1 prostate tumors in C57BL/6J treated with vehicle or dCNP (1mg/kg) and with control or anti-PD1 antibody (5mg/kg) as indicated (n=10). (K) Schematic (left) and analysis of survival (right) of orthotopic AB1 mesothelioma tumor-bearing Balb/c mice treated with vehicle (n=12) or dCNP (1mg/kg, n=12), or anti-PD1 antibody (5mg/kg, n=13) or with combination dCNP+anti-PD1 (n=12). (L) Analysis of survival of orthotopic 3LL lung tumor-bearing C57BL/6J mice treated with vehicle (n=11) or dCNP (0.3mg/kg, n=10) or anti-PD1 (5mg/kg, n=10) or combination dCNP+anti-PD1 (n=10). Data are presented as mean ± SEM. Statistical analysis was performed using 2-tailed Students’ t test (A, C, D, E, F and G) or 2-way ANOVA with Sidak’s multiple-comparison test (H, I and J) or log rank test (B, K and L).
Figure 8.
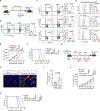
Figure 8.. dCNP improves the efficacy of anti-tumor CAR-T therapy.
(A) Schematic illustration for testing the effects of dCNP (0.6mg/kg, 10 days after inoculation) on OT-I adoptive cell transfer (2×10⁷/mouse, 14 days after inoculation) therapy against s.c. MC38OVA tumors growing in C57BL/6J Rag1−/− mice. (B) Percentage of CD69+CD8+ T cells in s.c. MC38OVA tumors from Rag1−/− mice described in (A) (n=5). (C) Flow cytometry analysis of percentage of IFN-γ+, granzyme B+ or perforin+ CD8+ OT-I T cells in tumors from Rag1−/− mice described in (A) (n=5). (D) MFI of PD-1, TIM3 and LAG3 on CD8+ T cells in tumors from Rag1−/− mice described in (A) (n=5). (E) Growth of s.c. MC38OVA tumors in Rag1−/− mice described in (A) (n=5). (F) Kaplan-Meier analysis of survival of s.c. MC38OVA-bearing mice described in (A) (n=5). (G) Schematic illustration for combining dCNP (0.3mg/kg, 7days after inoculation, 2 rounds) with CD19-CAR T therapy (2×10⁷/mouse, 10 and 15 days after inoculation) against s.c. B16F10-hCD19 tumors in Rag1−/− mice. (H) Representative images of CD31+ staining of ECs and of CD3+ CAR-T cells in tumors from experiment described in (G). Scale bar: 100μM. (I) Quantification of numbers of CAR T (CD3+) cells inside tumors from experiment described in (G) (n=5). (J) Average growth of s.c. B16F10-hCD19 tumors in Rag1−/− mice treated with CD19-CAR T cells following vehicle or dCNP treatment (n=6). (K) Kaplan-Meier analysis of survival of s.c. B16F10-CD19-bearing mice treated as described in (G) (n=6). Data are presented as mean ± SEM. Statistical analysis was performed using 2-tailed Students’ t test (B, C, D, and I) or 2-way ANOVA with Sidak’s multiple-comparison test (E and J) or log rank test (F and K).

References

    1. Du W, Pasca di Magliano M, Zhang Y, Therapeutic Potential of Targeting Stromal Crosstalk-Mediated Immune Suppression in Pancreatic Cancer. Front Oncol 11, 682217 (2021)10.3389/fonc.2021.682217). - DOI - PMC - PubMed
    1. Wang S, Li Y, Xing C, Ding C, Zhang H, Chen L, You L, Dai M, Zhao Y, Tumor microenvironment in chemoresistance, metastasis and immunotherapy of pancreatic cancer. Am J Cancer Res 10, 1937–1953 (2020). - PMC - PubMed
    1. Chauhan VP, Boucher Y, Ferrone CR, Roberge S, Martin JD, Stylianopoulos T, Bardeesy N, DePinho RA, Padera TP, Munn LL, Jain RK, Compression of pancreatic tumor blood vessels by hyaluronan is caused by solid stress and not interstitial fluid pressure. Cancer Cell 26, 14–15 (2014); published online EpubJul 14 (10.1016/j.ccr.2014.06.003). - DOI - PMC - PubMed
    1. Jain RK, Transport of molecules in the tumor interstitium: a review. Cancer Res 47, 3039–3051 (1987); published online EpubJun 15 ( - PubMed
    1. Bergers G, Benjamin LE, Tumorigenesis and the angiogenic switch. Nat Rev Cancer 3, 401–410 (2003); published online EpubJun (10.1038/nrc1093). - DOI - PubMed

Publication types

Substances

LinkOut - more resources