. 2024 Jan-Dec;16(1):2391505.
doi: 10.1080/19490976.2024.2391505. Epub 2024 Aug 21.

Limited predictive value of the gut microbiome and metabolome for response to biological therapy in inflammatory bowel disease

Affiliations

Limited predictive value of the gut microbiome and metabolome for response to biological therapy in inflammatory bowel disease

Femke M Prins et al. Gut Microbes. 2024 Jan-Dec.

Abstract

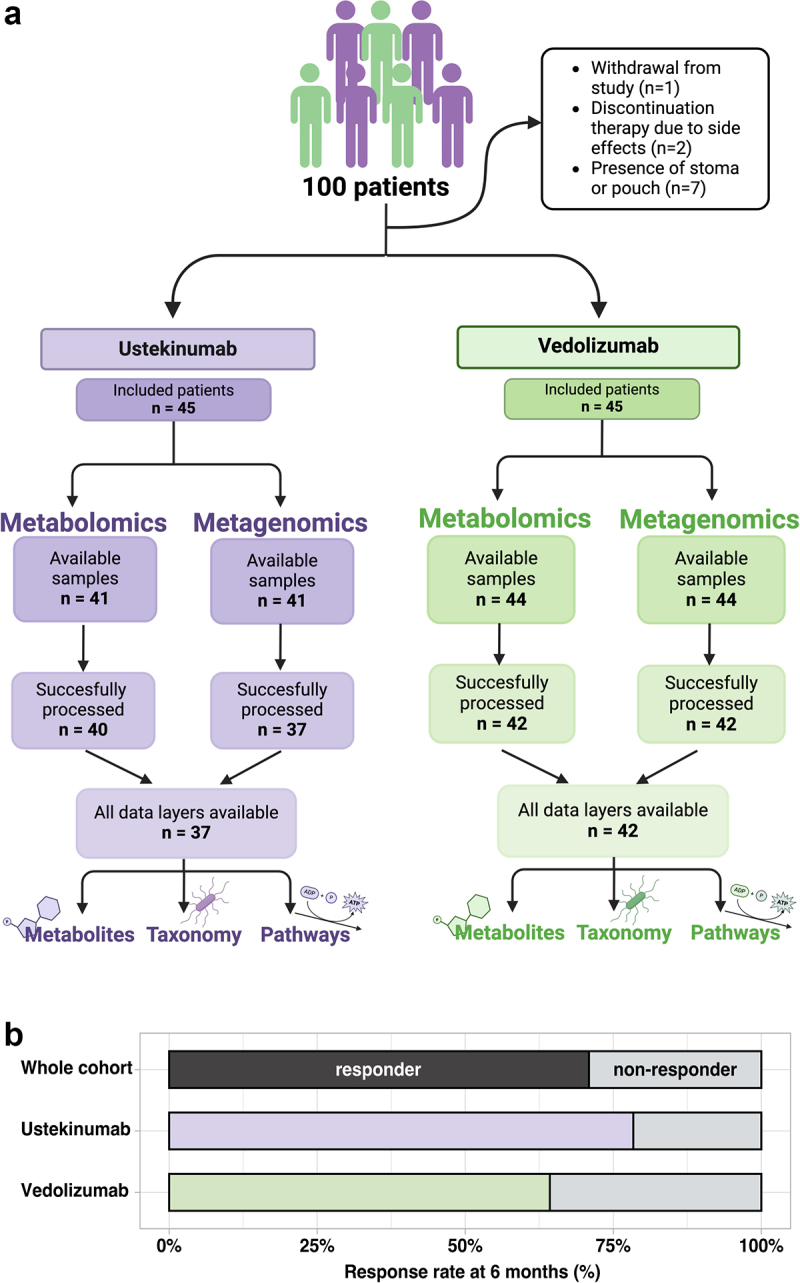
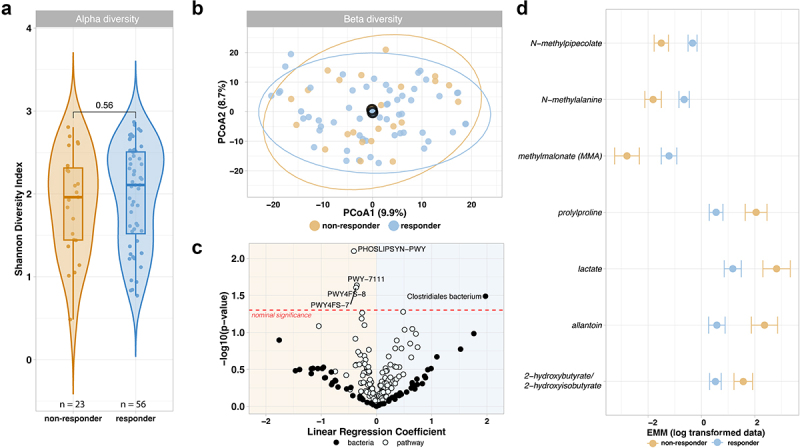
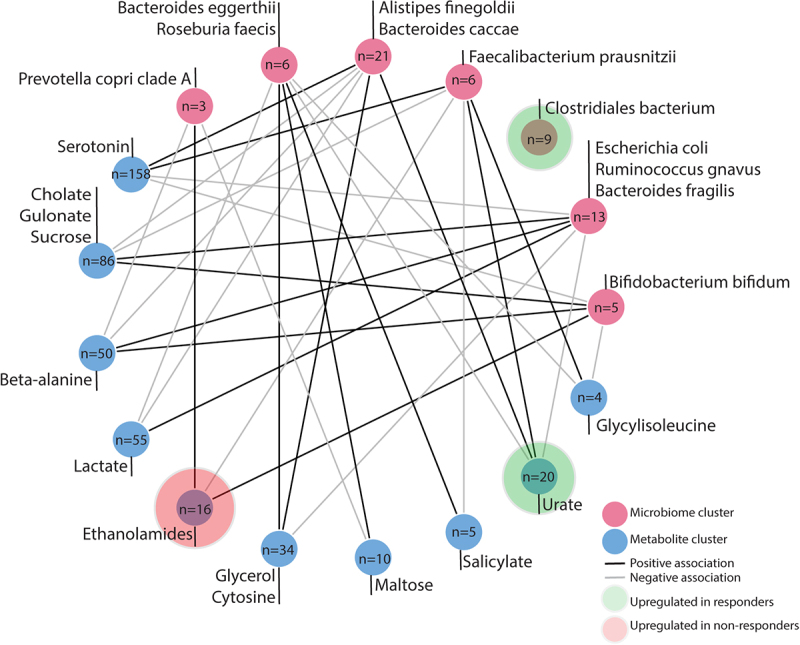
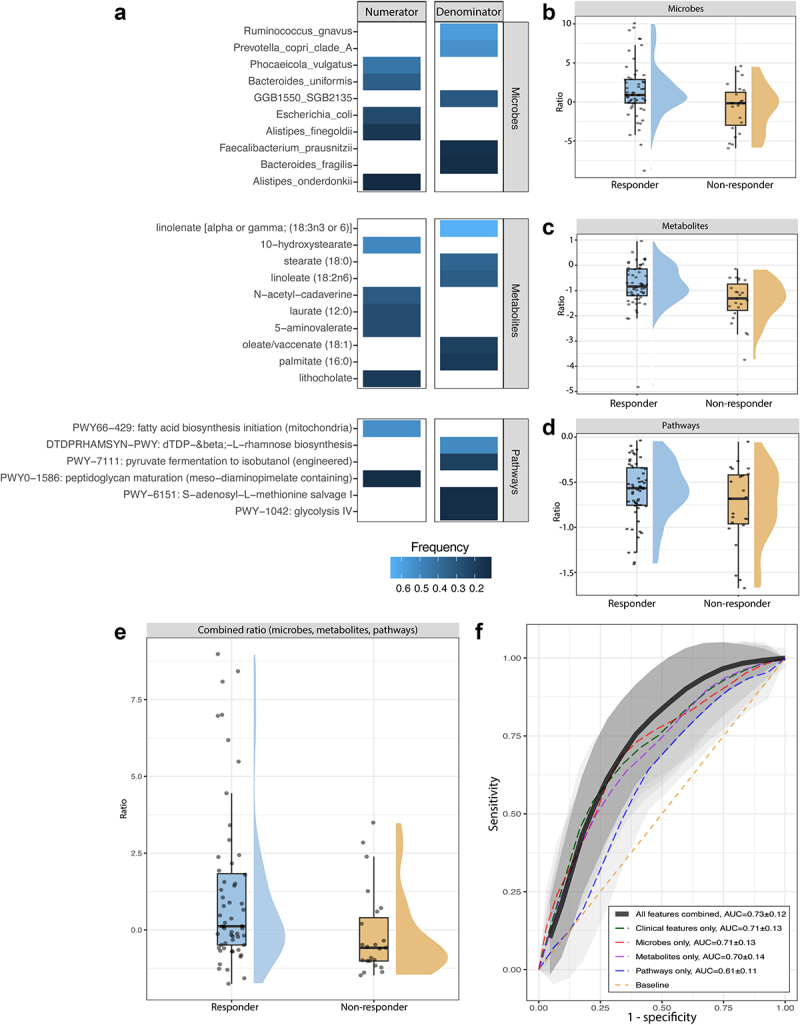
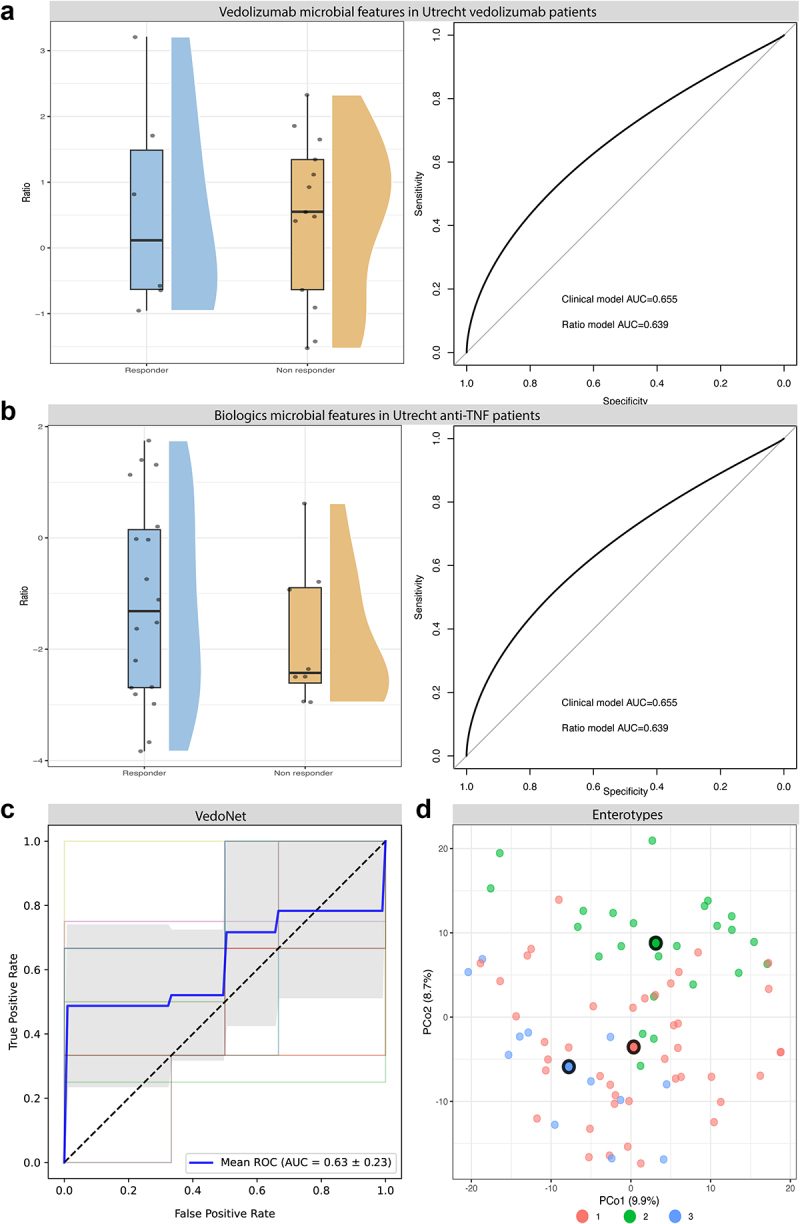
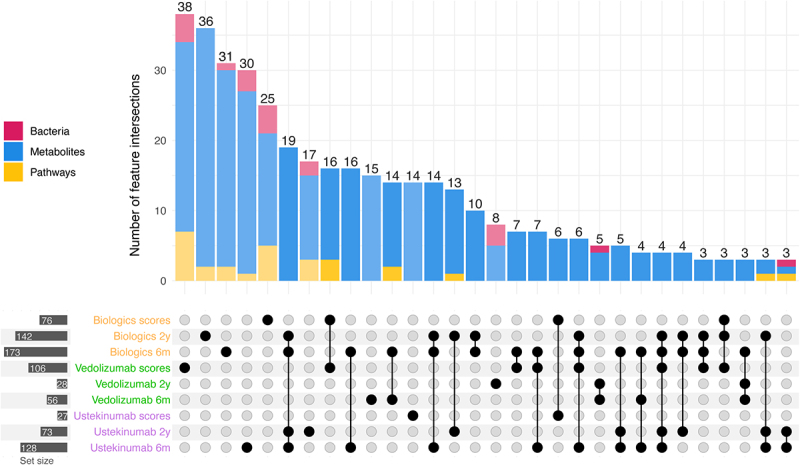
Emerging evidence suggests the gut microbiome's potential in predicting response to biologic treatments in patients with inflammatory bowel disease (IBD). In this prospective study, we aimed to predict treatment response to vedolizumab and ustekinumab, integrating clinical data, gut microbiome profiles based on metagenomic sequencing, and untargeted fecal metabolomics. We aimed to identify predictive biomarkers and attempted to replicate microbiome-based signals from previous studies. We found that the predictive utility of the gut microbiome and fecal metabolites for treatment response was marginal compared to clinical features alone. Testing our identified microbial ratios in an external cohort reinforced the lack of predictive power of the microbiome. Additionally, we could not confirm previously published predictive signals observed in similar sized cohorts. Overall, these findings highlight the importance of external validation and larger sample sizes, to better understand the microbiome's impact on therapy outcomes in the setting of biologicals in IBD before potential clinical implementation.

Keywords: Inflammatory bowel disease; biologics; metabolomics; microbiome; prediction; ustekinumab; vedolizumab.


Conflict of interest statement

EAMF is supported by a ZonMW Clinical Fellowship grant (project number 90719075) and has received an unrestricted research grant from Takeda. RG received funding by Janssen Pharmaceuticals (for unrelated research projects) and received consulting funding from Esox Biologics (for unrelated research projects). RKW has received unrestricted Research Grants from Takeda, Johnson & Johnson, Ferring and Tramedico and speaker fees from Abbvie, MSD and Boston Scientific and has acted as a consultant for Takeda Pharmaceuticals.

Figures

Figure 1.
Figure 1.
Cohort and sample overview: a) Flowchart showing the available samples for the ustekinumab and vedolizumab group and the excluded samples. b) Responder and non-responders for the whole cohort and for ustekinumab and vedolizumab at 6 months after initiation of therapy. Figure 1A is created with BioRender.com.
Figure 2.
Figure 2.
Baseline alpha diversity, beta diversity and differential abundant microbes, pathways and metabolites between responders and non-responders. Shown are the comparisons of 79 patients taking ustekinumab or vedolizumab, categorized by their response to therapy after 6 months. a) Alpha diversity between responders and non-responders displays no difference between these groups. (Mann–Whitney U, p = 0.56). b) Beta diversity between responders and non-responders using the Aitchison distance. The overlapping centroids indicate no difference at the species level between responders and non-responders. c) Nominally significant p < 0.05 relative abundant pathways and microbes between responders and non-responders. Clostridales bacterium and four pathways are associated with response, but these results do not pass the FDR < 0.1 threshold. d) Seven metabolites showing significant differences (FDR <0.1) between responders and non-responders, suggesting that the only differences between responders and non-responders at baseline appear within the abundance of specific metabolites.
Figure 3.
Figure 3.
Microbiome–metabolite interactions network plot showing the interaction between microbial clusters and metabolite clusters in the whole cohort for 79 patients treated with vedolizumab and ustekinumab, created using MiMeNet. Clusters are based on co-occurrence, not biological relation; a full overview of features per cluster is available in the Supplemental Tables S1 and S2. For each cluster one or more metabolites and bacteria are highlighted based on potential relevance. This representative does not have statistical or biological ascendancy over any other species or metabolite in the cluster. Two metabolite clusters were significantly associated with response (Mann–Whitney U, p = 0.0499, p = 0.01), and one bacterial cluster was significantly associated with response (Mann–Whitney U, p = 0.017).
Figure 4.
Figure 4.
Features used in the prediction models, visualized feature ratios and prediction AUC overview: a) Performing permutation analysis for the CoDaCoRe feature selection generated features for each of the categories, shown is the features with a frequency of 10% or higher. Stronger predictors are observed with a higher frequency. b, c, d) Visualized log ratios using the features in panel a from the abundances of the whole cohort data, shown are microbial, pathway and metabolites ratios. Densities of the responders and non-responders show limited separation. e) Combined plot of the ratios visualized in b, c, and d. Responders are higher on average, although the largest density area still overlaps. f) ROC-AUC plot showing the AUC for the generalized linear models based on clinical features, and microbial, pathway and metabolite ratios independently, and combined into one model. AUCs were determined using 100 permutations of 75% test and train split. Clinical features showed the best performance for each of the individual predictions, and combining multi-omic predictions only improved the prediction marginally.
Figure 5.
Figure 5.
Utrecht validation and other prediction replication: a) Features identified in our vedolizumab model plotted as log ratios in the vedolizumab patients of the Utrecht cohort, and ROC-AUC plot from GLM models based on clinical features alone and clinical features plus vedolizumab microbiome features log ratio. b) Features identified in our biologics cohort plotted as log ratio in anti-tnf patients of the Utrecht cohort and ROC-AUC plot from GLM models based on clinical features and clinical features alone and clinical features plus microbiome features log ratio. c) ROC-AUC curve based on vedonet features tested in our vedolizumab cohort, determined using 4 fold 5 repeat k-fold cross validation in a random forest model. d) PCoA plot for enterotype clustering using all 79 patients. Three distinct enterotypes were identified.
Figure 6.
Figure 6.
Overlapping features based on three response definitions UpSet plot showing the number of features overlapping between nine different sets: the entire cohort and the cohort stratified by biologic, and the three definitions of response. The categories of the overlapping features are indicated in pink (bacteria), blue (metabolites), and yellow (pathways).

References

    1. Zhao M, Gönczi L, Lakatos PL, Burisch J.. The burden of inflammatory bowel disease in Europe in 2020. J Crohns Colitis. 2021;15(9):1573–18. doi: 10.1093/ecco-jcc/jjab029. - DOI - PubMed
    1. Nishida A, Inoue R, Inatomi O, Bamba S, Naito Y, Andoh A. Gut microbiota in the pathogenesis of inflammatory bowel disease. Clin J Gastroenterol. 2018;11(1):1–10. doi: 10.1007/s12328-017-0813-5. - DOI - PubMed
    1. Honap S, Meade S, Ibraheim H, Irving PM, Jones MP, Samaan MA. Effectiveness and safety of ustekinumab in inflammatory bowel disease: a systematic review and meta-analysis. Dig Dis Sci. 2022;67(3):1018–1035. doi: 10.1007/s10620-021-06932-4. - DOI - PubMed
    1. Schreiber S, Dignass A, Peyrin-Biroulet L, Hather G, Demuth D, Mosli M, Curtis R, Khalid JM, Loftus EV. Systematic review with meta-analysis: real-world effectiveness and safety of vedolizumab in patients with inflammatory bowel disease. J Gastroenterol. 2018;53(9):1048–1064. doi: 10.1007/s00535-018-1480-0. - DOI - PMC - PubMed
    1. Wong DJ, Roth EM, Feuerstein JD, Poylin VY. Surgery in the age of biologics. Gastroenterol Rep. 2019;7(2):77–90. doi: 10.1093/gastro/goz004. - DOI - PMC - PubMed

MeSH terms

LinkOut - more resources