. 2024 Dec 4;120(15):1851-1868.
doi: 10.1093/cvr/cvae174.

Smooth muscle-specific deletion of cellular communication network factor 2 causes severe aorta malformation and atherosclerosis

Affiliations

Smooth muscle-specific deletion of cellular communication network factor 2 causes severe aorta malformation and atherosclerosis

Jannik H Larsen et al. Cardiovasc Res. .

Abstract

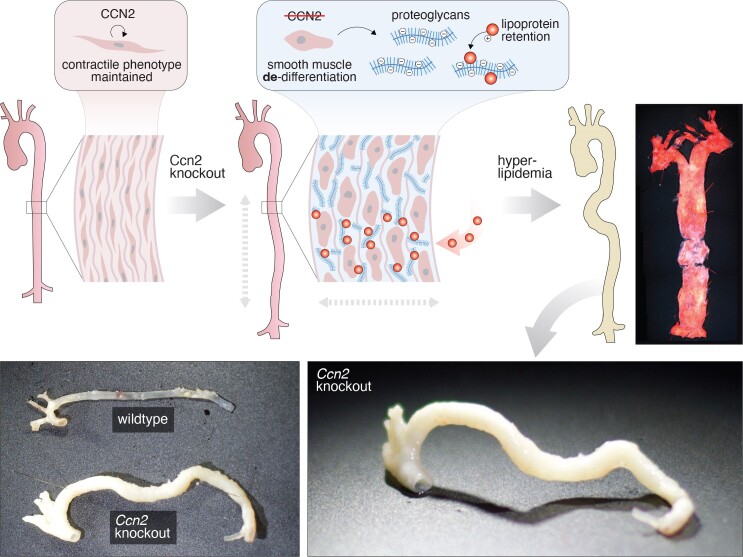
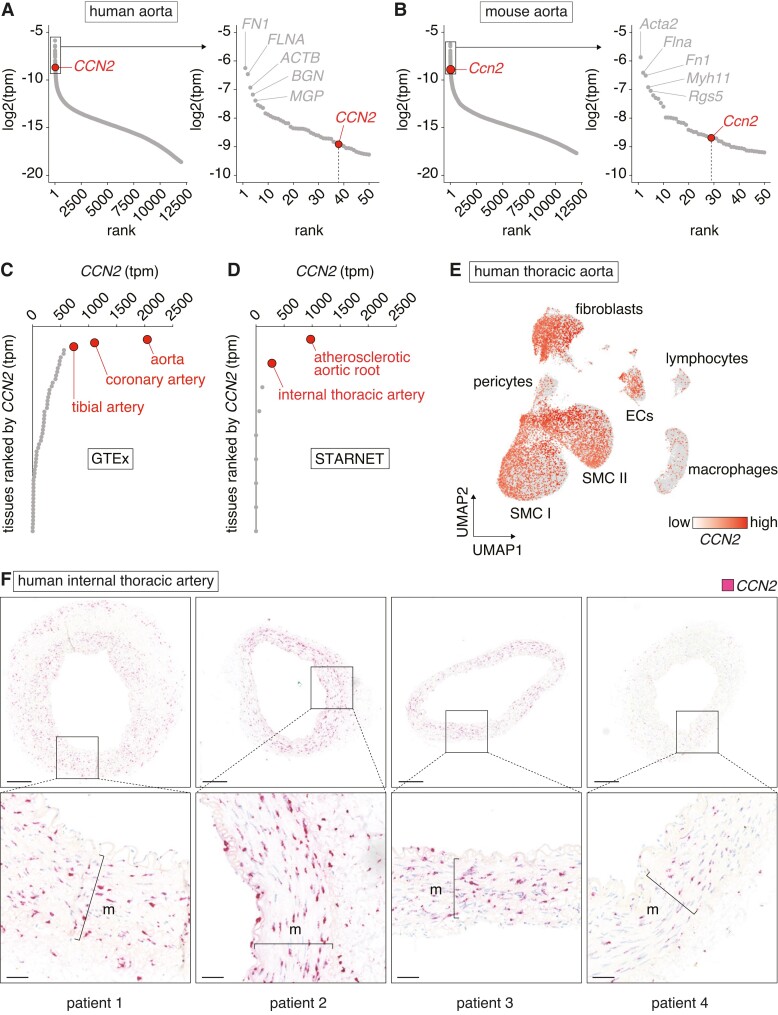
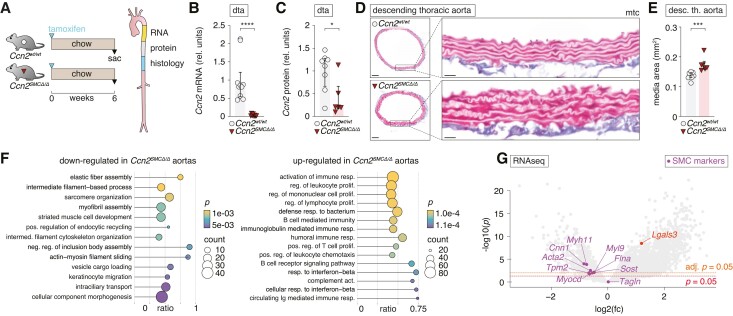
Aims: Cellular communication network factor 2 (CCN2) is a matricellular protein implicated in fibrotic diseases, with ongoing clinical trials evaluating anti-CCN2-based therapies. By uncovering CCN2 as abundantly expressed in non-diseased artery tissue, this study aimed to investigate the hypothesis that CCN2 plays a pivotal role in maintaining smooth muscle cell (SMC) phenotype and protection against atherosclerosis.

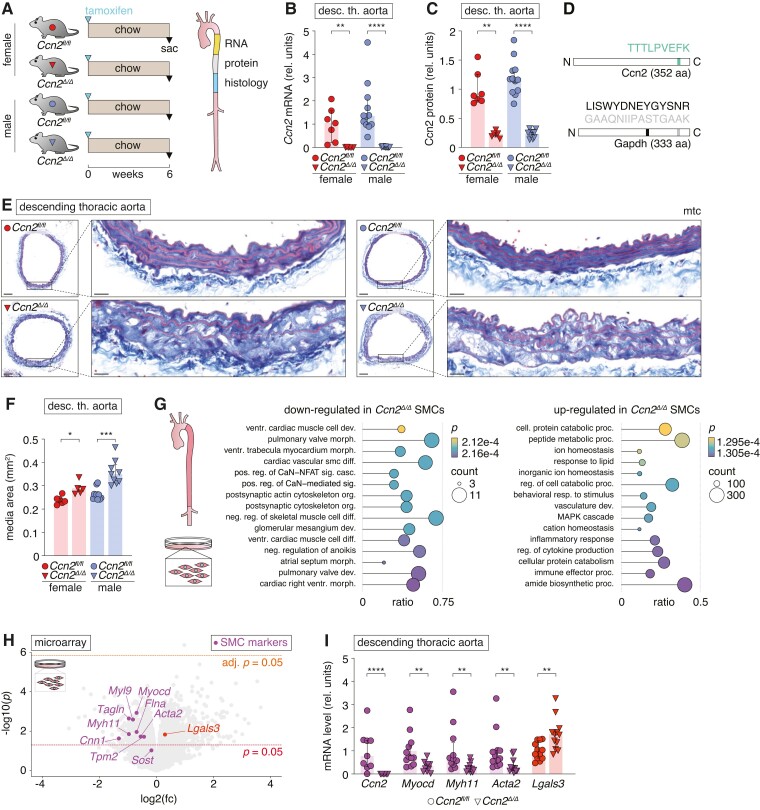
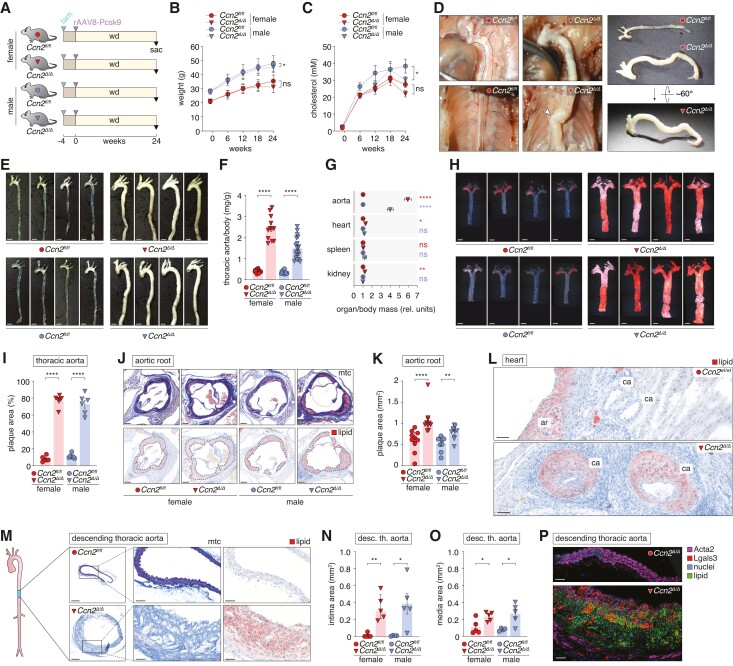
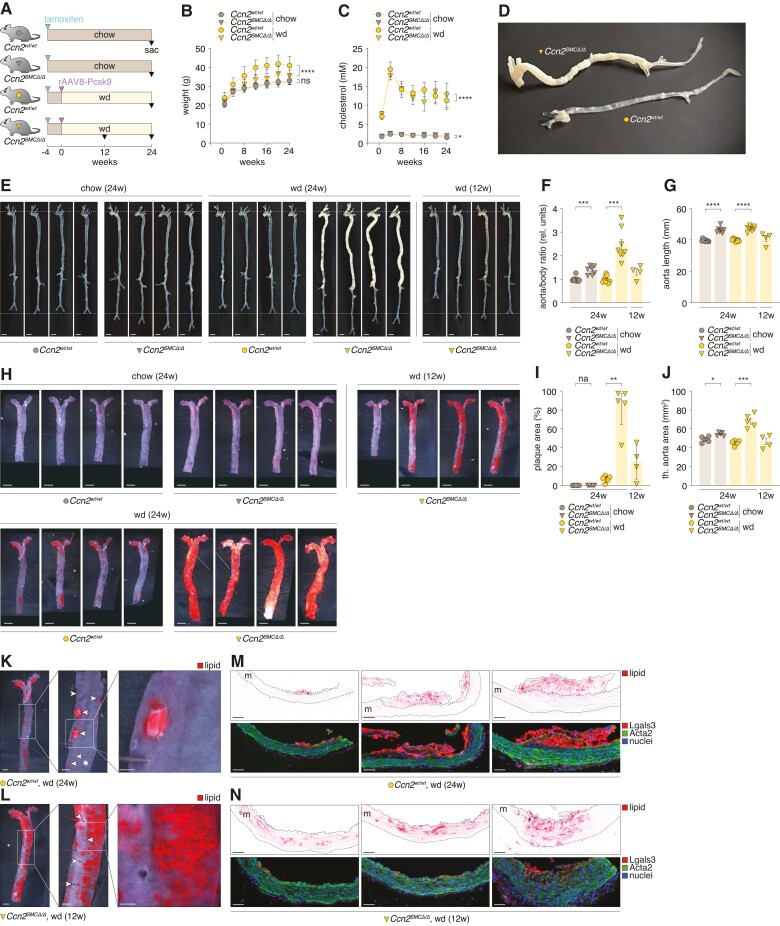
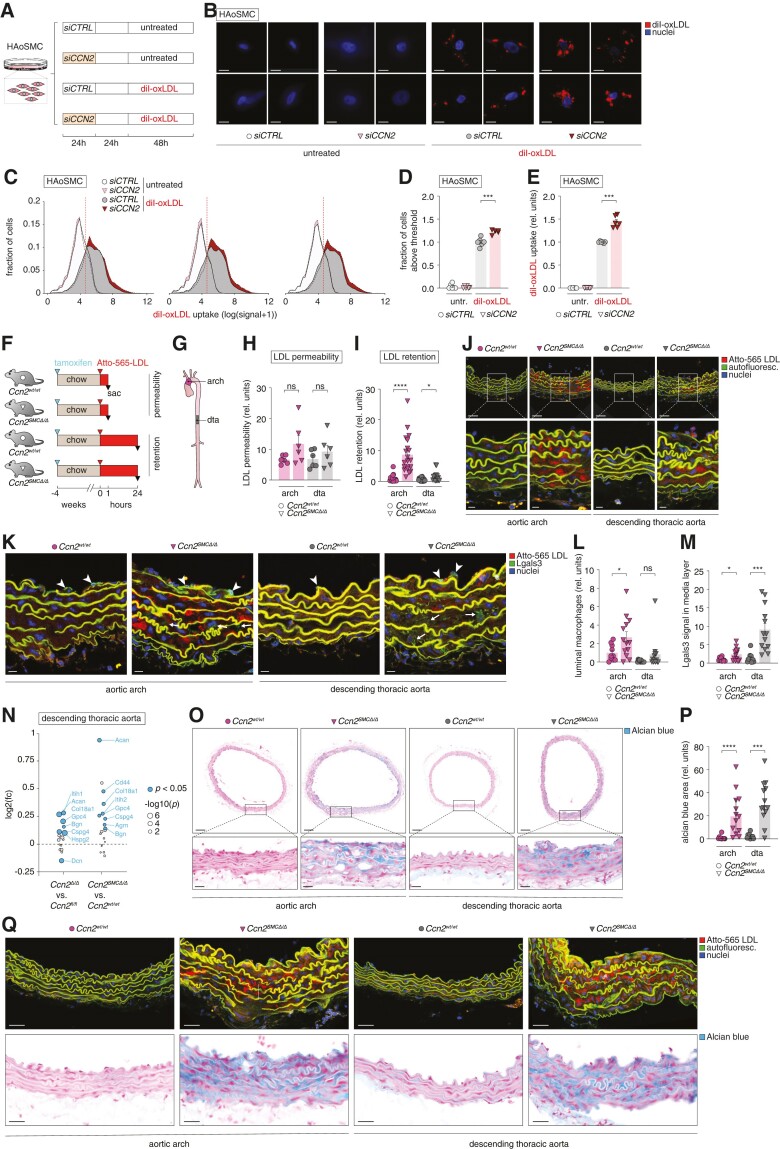
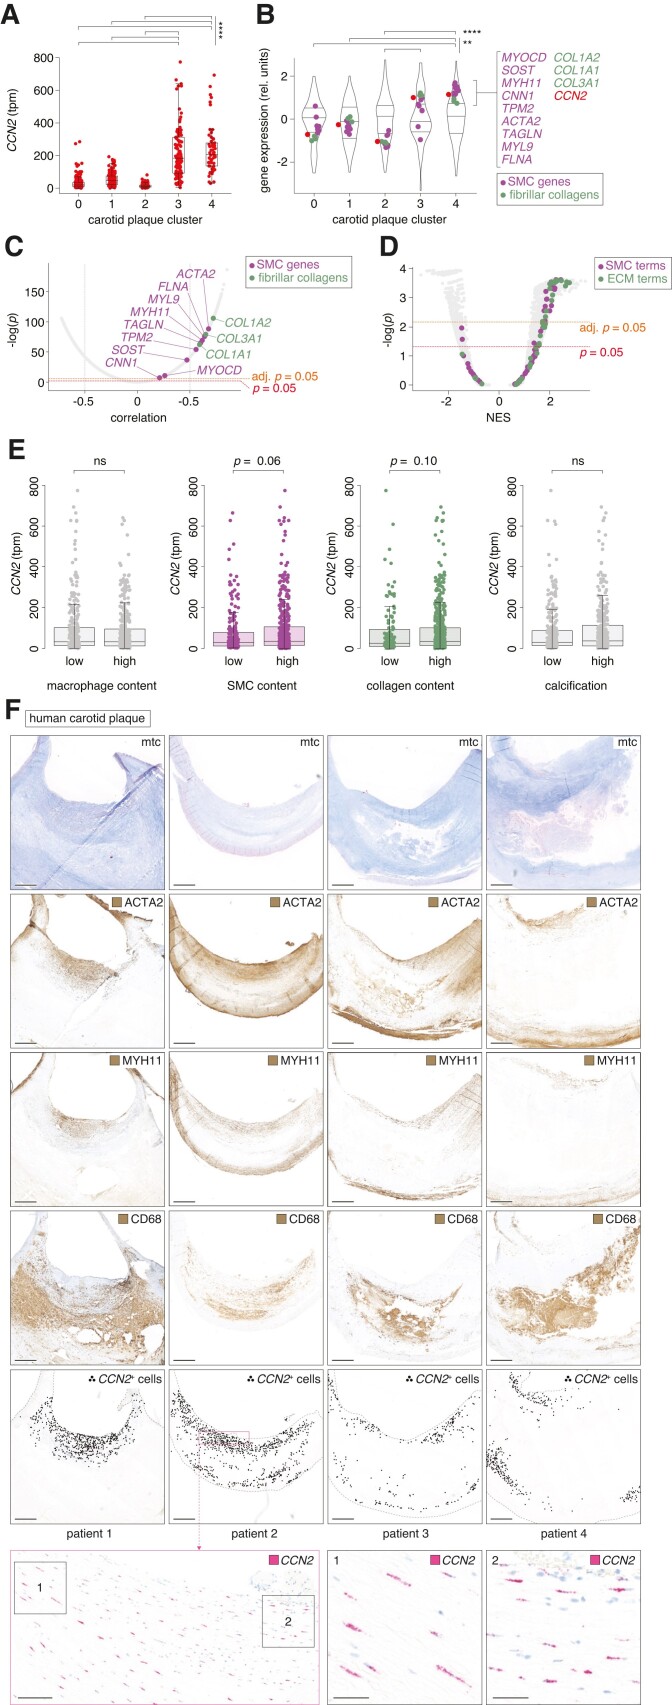
Methods and results: Global- and SMC-specific Ccn2 knockout mouse models were employed to demonstrate that Ccn2 deficiency leads to SMC de-differentiation, medial thickening, and aorta elongation under normolipidaemic conditions. Inducing hyperlipidaemia in both models resulted in severe aorta malformation and a 17-fold increase in atherosclerosis formation. Lipid-rich lesions developed at sites of the vasculature typically protected from atherosclerosis development by laminar blood flow, covering 90% of aortas and extending to other vessels, including coronary arteries. Evaluation at earlier time points revealed medial lipid accumulation as a lesion-initiating event. Fluorescently labelled LDL injection followed by confocal microscopy showed increased LDL retention in the medial layer of Ccn2 knockout aortas, likely attributed to marked proteoglycan enrichment of the medial extracellular matrix. Analyses leveraging data from the Athero-Express study cohort indicated the relevance of CCN2 in established human lesions, as CCN2 correlated with SMC marker transcripts across 654 transcriptomically profiled carotid plaques. These findings were substantiated through in situ hybridization showing CCN2 expression predominantly in the fibrous cap.

Conclusion: This study identifies CCN2 as a major constituent of the normal artery wall, critical in regulating SMC differentiation and aorta integrity and possessing a protective role against atherosclerosis development. These findings underscore the need for further investigation into the potential effects of anti-CCN2-based therapies on the vasculature.

Keywords: Aorta; Atherosclerosis; Cellular communication network factor 2 (CCN2); Smooth muscle cell.


Conflict of interest statement

Conflict of interest: none declared.

Figures

Graphical Abstract
Graphical Abstract
Figure 1
Figure 1
CCN2 is highly expressed in non-diseased artery tissues. (A, B) Genes ranked by expression level in aortas from humans (n = 432) (A) and mice (n = 4) (B). Dots represent median expression level for each gene. CCN2 is among the top 50 most abundant transcripts in both species (excluding mitochondrial genes). (C, D) CCN2 transcripts per million (tpm) across all tissues from the GTEx (C) and STARNET (D) databases. Dots represent median expression level in each tissue. Artery tissues are shown in red. Relative CCN2 expression was markedly elevated in human arteries compared with non-vascular tissues (E). UMAP plot based on single-nucleus RNA-seq data from non-lesioned human thoracic aortas (n = 6) overlaid with CCN2 expression. SMCs, fibroblasts, and endothelial cells express CCN2, while lymphocytes and macrophages displayed little to no CCN2 expression (F). CCN2 ISH of human internal thoracic arteries (n = 4). Most staining was observed in the medial layer. Refer to supplementary material online, Figure S2 for negative control ISH. Scale bars (overview) = 250 µm; scale bars (magnification) = 50 µm. m = media.
Figure 2
Figure 2
Ccn2 deficiency causes de-differentiation of SMCs. (A) Experiment design and aorta segments used for RNA, protein, and histological analyses. (B, C) Ccn2 mRNA (B) and Ccn2 protein (C) level in descending thoracic aortas. (D) Peptides of Ccn2 and Gapdh quantified to obtain results in C. Peptide positions are indicated. (E) Cross-sections of descending thoracic aortas stained by Masson’s trichrome (mtc). Scale bars (overview) = 100 µm; scale bars (magnification) = 20 µm. (F) Medial cross-sectional area of descending thoracic aorta. We found no difference in the relative effect of genotype on this measure between female and male mice. (G) GSEA based on microarray data obtained from primary Ccn2Δ/Δ (n = 9) and Ccn2fl/fl (n = 6) SMCs. The 15 most down- and up-regulated gene ontology biological process terms (based on significance) are shown. Dot sizes indicate the number of genes regulated in Ccn2Δ/Δ SMCs for each term. The ratio shows coverage of a given term by genes regulated in Ccn2Δ/Δ SMCs, and dot colours indicate the level of significance. (H) Volcano plot showing regulation of genes in primary Ccn2Δ/Δ SMCs compared with Ccn2fl/fl SMCs. Two thousand one hundred seventy-five genes were up-regulated and 1366 genes were down-regulated (unadjusted P < 0.05) in Ccn2Δ/Δ SMCs. Only Hlx displayed significant up-regulation after correction for multiple testing (see supplementary material online, Table S1). Myocd and genes encoding pre-specified markers for contractile SMCs are shown in magenta, and Lgals3 is shown in red. (I) Validation of selected genes by qPCR of descending thoracic aortas. Data in B, C, F, and I were analysed by unpaired t-test with Welch’s correction or Mann–Whitney U test. Data in G were analysed using clusterProfiler 4.0 package in R.
Figure 3
Figure 3
Ccn2 deficiency causes severe atherosclerosis not limited to typical pre-dilection sites in hyperlipidaemic mice. (A) Experiment design (n = 14/12/10/19 for Ccn2fl/fl females, Ccn2Δ/Δ females, Ccn2fl/fl males, Ccn2Δ/Δ males, respectively, after excluding three mice that met the pre-specified humane endpoints (see supplementary material online, Figure S4B). (B, C). Mouse weight (B) and plasma cholesterol (C) through the course of the experiment. (D) In situ and ex vivo images of Ccn2fl/fl and Ccn2Δ/Δ aortas. While aortas of Ccn2fl/fl mice were aligned with the spine, the enlargement of aortas in Ccn2Δ/Δ mice hindered this and resulted in a consistently observed kink (arrowhead) at the level of the descending thoracic aorta. (E) Thoracic aortas after 24 weeks of hyperlipidaemia. Scale bars = 2.5 mm. (F) Mass of thoracic aortas relative to body weight after 24 weeks of hyperlipidaemia. The relative effect of the genotype was significantly higher in female mice. (G) Mass of the thoracic aorta, heart, spleen, and kidney (mean of two kidneys) relative to body weight. Each organ/body mass ratio is normalized to the mean of the female Ccn2fl/fl group for each organ to enable comparison of effects across the organs. (H) Oil Red O staining of en face-prepared thoracic aortas after 24 weeks of hyperlipidaemia. Scale bars = 2.5 mm. (I) Percentage of en face-prepared thoracic aorta area stained positive for lipid. We found no difference in the relative effect of genotype on this measure between female and male mice. (J, K) Cross-sections of aortic roots stained by Masson’s trichrome (mtc) and Oil Red O (scale bars = 100 µm, J) and quantitation of aortic root plaque area (K). The relative effect of the genotype was significantly higher in female mice. (L) Oil Red O staining showing atherosclerosis in coronary arteries (ca) near aortic roots (ar) from Ccn2Δ/Δ mice, which was not observed in Ccn2fl/fl mice. Scale bars = 50 µm. (M) Cross-sections of descending thoracic aortas stained by Masson’s trichrome (mtc) or Oil Red O. Scale bars (overview) = 200 µm; Scale bars (magnification) = 50 µm. (N, O) Intimal (N) and medial (O) cross-sectional area of descending thoracic aorta. We found no difference in the relative effect of genotype on these measures between female and male mice. (P) Immunofluorescence co-staining of descending thoracic aorta (adjacent to sections shown in M) for Acta2 (staining was performed with an Alexa Fluor 647-conjugated secondary antibody but shown in magenta), Lgals3 (red), lipid (green), and nuclei (blue). Scale bars = 50 µm. Some analyses shown on the figure were performed on randomly selected subsets from each group. Data in B and C were analysed by two-way ANOVA. Data in F, G, I, and K and N and O were analysed by unpaired t-test with Welch’s correction or Mann–Whitney U test.
Figure 4
Figure 4
SMC-specific Ccn2 deletion recapitulates effects on SMC phenotype and medial expansion observed in global Ccn2 knockout mice. (A) Experiment design (resulting in data shown in BG) and aorta segments used for RNA, protein, and histological analyses. (B, C) Ccn2 mRNA (B) and Ccn2 protein (C) level in descending thoracic aortas. dta, descending thoracic aorta. (D, E) Cross-sections of descending thoracic aortas stained by Masson’s trichrome (mtc) [scale bars (overview) = 100 µm; scale bars (magnification) = 20 µm] (D) and quantitation of the medial area (E). (F) GSEA based on RNA-seq of descending thoracic aorta from Ccn2SMCΔ/Δ (n = 7) and Ccn2wt/wt aortas (n = 8). The 15 most down- and up-regulated gene ontology biological process terms (based on significance) are shown. Dot sizes indicate the number of genes regulated in Ccn2SMCΔ/Δ aortas for each term. The ratio shows the coverage of a given term by genes regulated in Ccn2SMCΔ/Δ aortas, and dot colours indicate the level of significance. (G) Volcano plot showing regulation of all genes in Ccn2SMCΔ/Δ aortas. Two thousand four hundred eighty-seven (18.7%) genes were up-regulated and 139 (1%) genes were down-regulated (adjusted P < 0.05) in Ccn2SMCΔ/Δ aortas (see supplementary material online, Table S2). Myocd and genes encoding pre-specified markers for contractile SMCs are shown in magenta, and Lgals3 is shown in red. Data in B and C and E were analysed by unpaired t-test with Welch’s correction or Mann–Whitney U test. Data in F were analysed using clusterProfiler 4.0 package in R.
Figure 5
Figure 5
Atheroprotective effects of Ccn2 are exerted through SMC-dependent mechanisms. (A) Experiment design (n = 9/7/9/8 for chow-fed Ccn2wt/wt and Ccn2SMCΔ/Δ mice and wd-fed Ccn2wt/wt and Ccn2SMCΔ/Δ mice, respectively, after excluding five mice that met the pre-specified humane endpoints (see supplementary material online, Figure S7D). In addition, four Ccn2SMCΔ/Δ mice were sacrificed after 12 weeks of wd feeding to enable phenotype assessment at this time point. (B, C) Mouse weight (B) and plasma cholesterol (C) through the course of the experiment. (D, E) Ex vivo images of Ccn2wt/wt and Ccn2SMCΔ/Δ aortas. (F) Mass of aortas relative to body weight. (G) Aorta length (beginning of aortic arch to iliac bifurcation). (H) Oil Red O staining of en face-prepared thoracic aortas. Scale bars = 2.5 mm. (I) Percentage of en face-prepared thoracic aorta area stained positive for lipid. (J) Area of en face-prepared descending thoracic aortas. (K, L) Magnification of lipid-stained areas of descending thoracic aortas from Ccn2wt/wt mice after 24 weeks of hyperlipidaemia (K) and Ccn2SMCΔ/Δ mice after 12 weeks of hyperlipidaemia (L). Arrowheads in point to ostia of aortic branches. (M + N) Histological images of Oil Red O-stained lesions (top) and the same specimens stained for Lgals3 (red), Acta2 (green), and nuclei. m = media. Scale bars = 50 µm. Data in B and C were analysed by two-way ANOVA. Data in F and G and I and G were analysed by unpaired t-test with Welch’s correction or Mann–Whitney U test.
Figure 6
Figure 6
Ccn2 deficiency augments the capacity of medial extracellular matrix to retain LDL. (A) Experiment design (resulting in data shown in BE). The experiment was replicated three independent times obtaining similar results. (B) Images of CCN2-silenced and control HAoSMCs either untreated or treated with diI-conjugated oxidized LDL (diI-oxLDL, red) and nuclei were stained with DAPI (blue). Scale bars = 5 µm. (CE) Histograms showing three examples of flow cytometry data from the four experimental groups (C); quantitation of proportion of HAoSMCs with an oxLDL uptake above the defined cut-off (vertical red dotted line in C) (D) and the mean uptake for this population (E). (F, G) Experiment design (n = 6/6 for chow-fed Ccn2wt/wt and Ccn2SMCΔ/Δ mice used for investigation of endothelial permeability to LDL, and n = 15/20 for chow-fed Ccn2wt/wt and Ccn2SMCΔ/Δ mice used for investigation of LDL retention) (F) and aorta segments used for analyses in HQ (G). dta, descending thoracic aorta. (HJ) Atto-565 LDL signal in the aortic arch and dta 1 h (H) and 24 h (I) after injection as quantified based on confocal fluorescence microscopy images shown for the 24-h time point in J. Scale bars (top) = 50 µm; scale bars (magnification) = 10 µm. (K) Sections adjacent to those analysed in HJ were stained for Lgals3 by immunofluorescence. Arrowheads point to endothelium-associated luminal macrophages (high level of dense Lgals3 signal), whereas arrows point to more diffuse and low levels of Lgals3 staining in the medial layer (presumed to be modulated SMCs). Scale bars = 10 µm. (L, M) Quantitation of endothelium-associated luminal Lgals3-positive macrophages (L) and medial Lgals3 signal (M) based on Lgals3 stainings represented in K. (N) Effect of global and SMC-specific Ccn2 knockout on the level of aortic proteoglycans (defined previously) as assessed by mass spectrometry (full data sets are provided in supplementary material online, Tables S3 and S4). Blue dots show significantly regulated proteins, and dot size corresponds to the level of significance. Identities of all significantly regulated proteoglycans are shown. (O, P) Alcian blue staining of sections adjacent to those shown in J and K (O), and quantitation of Alcian blue-positive area (P). Scale bars (top) = 100 µm; scale bars (magnification) = 25 µm. (Q) Comparison of Atto-565 LDL signal (from analysis in HJ) and Alcian blue staining (from analysis in O and P). Scale bars = 25 µm. Data in D, E, H, I, L, M, and P were analysed by unpaired t-test with Welch’s correction or Mann–Whitney U test.
Figure 7
Figure 7
CCN2 expression correlates with SMC markers in advanced human plaques. (A) CCN2 transcripts per million (tpm) in carotid plaques from the Athero-Express study cohort (n = 654) divided into five transcriptome-based plaque clusters as previously described. Data are shown as median and interquartile range. (B) Gene expression in the five transcriptome-based plaque clusters from the Athero-Express study cohort. MYOCD and genes encoding pre-specified markers for contractile SMCs are shown in magenta, while genes encoding fibrillar collagens are shown in green. CCN2 is shown in red. The distribution of gene expression for all measured transcripts is represented as violin plots. Expression values are scaled per cluster. (C) Correlation of CCN2 with any other gene across the 654 carotid plaques from the Athero-Express study cohort. MYOCD and genes encoding pre-specified markers for contractile SMCs are shown in magenta, while genes encoding fibrillar collagens are shown in green. (D) GSEA based on genes ranked by correlation to CCN2 (as shown in C). Terms related to SMCs are shown in magenta, while terms related to extracellular matrix (ECM) is shown in green. (E) Associations between CCN2 expression level and human carotid plaque content of macrophages, ACTA2+ SMCs, collagen, and calcification, respectively, semi-quantitatively divided into low and high levels of each histologically assessed parameter. The data are based on the Athero-Express study cohort (n = 654). (F) CCN2, ACTA2, MYH11, and CD68 expression in human carotid plaques (n = 4) from the Odense Artery Biobank by ISH and immunohistochemistry, respectively. CCN2-positive cells are marked with black dots to assist visualization of CCN2+ cell distribution at low magnification. Scale bars (overview) = 1 mm. Scale bars (magnification levels) = 100 and 25 µm, respectively. Mtc, Masson’s trichrome. Data in A and B were analysed by Kruskal–Wallis test followed by Dunn’s multiple comparisons test. Data in C were analysed by Pearson correlation significance test and Bonferroni adjusted for multiple testing. Data in D were analysed using clusterProfiler 4.0 package in R. Data in E were analysed by Wilcoxon rank-sum test.

References

    1. Borén J, Williams KJ. The central role of arterial retention of cholesterol-rich apolipoprotein-B-containing lipoproteins in the pathogenesis of atherosclerosis: a triumph of simplicity. Curr Opin Lipidol 2016;27:473–483. - PubMed
    1. Libby P, Buring JE, Badimon L, Hansson GK, Deanfield J, Bittencourt MS, Tokgözoğlu L, Lewis EF. Atherosclerosis. Nat Rev Dis Primers 2019;5:56. - PubMed
    1. Bentzon JF, Otsuka F, Virmani R, Falk E. Mechanisms of plaque formation and rupture. Circ Res 2014;114:1852–1866. - PubMed
    1. Pipes GC, Creemers EE, Olson EN. The myocardin family of transcriptional coactivators: versatile regulators of cell growth, migration, and myogenesis. Genes Dev 2006;20:1545–1556. - PubMed
    1. Basatemur GL, Jørgensen HF, Clarke MCH, Bennett MR, Mallat Z. Vascular smooth muscle cells in atherosclerosis. Nat Rev Cardiol 2019;16:727–744. - PubMed

Publication types

MeSH terms