. 2024 Aug 20;5(8):101665.
doi: 10.1016/j.xcrm.2024.101665.

Targeting miR-29 mitigates skeletal senescence and bolsters therapeutic potential of mesenchymal stromal cells

Affiliations

Targeting miR-29 mitigates skeletal senescence and bolsters therapeutic potential of mesenchymal stromal cells

Zhen Ding et al. Cell Rep Med. .

Abstract

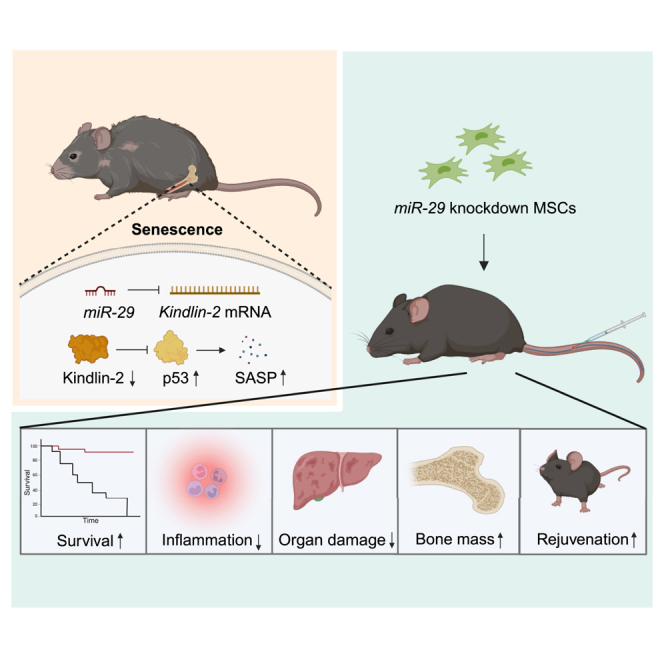
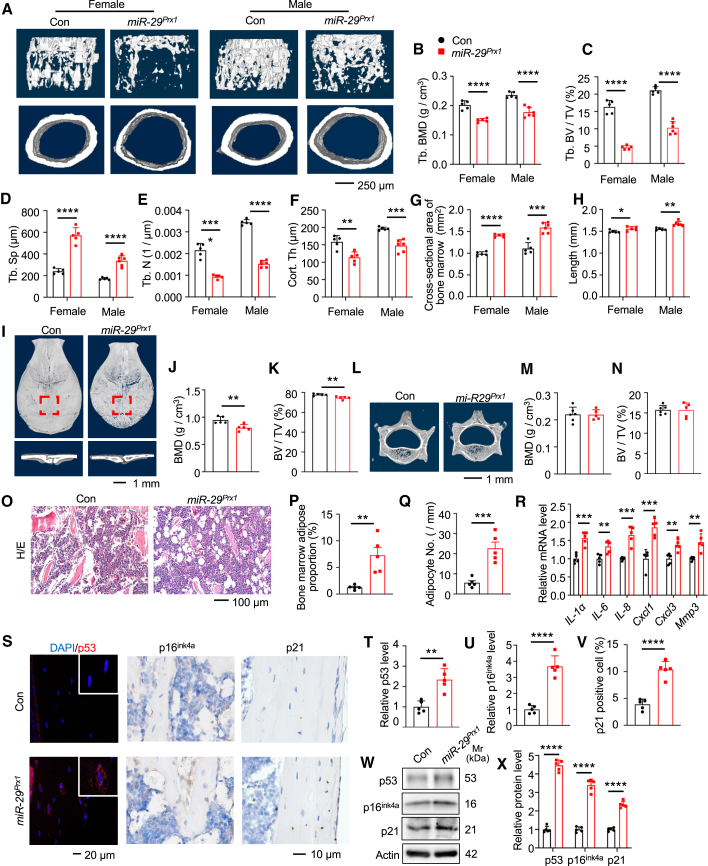
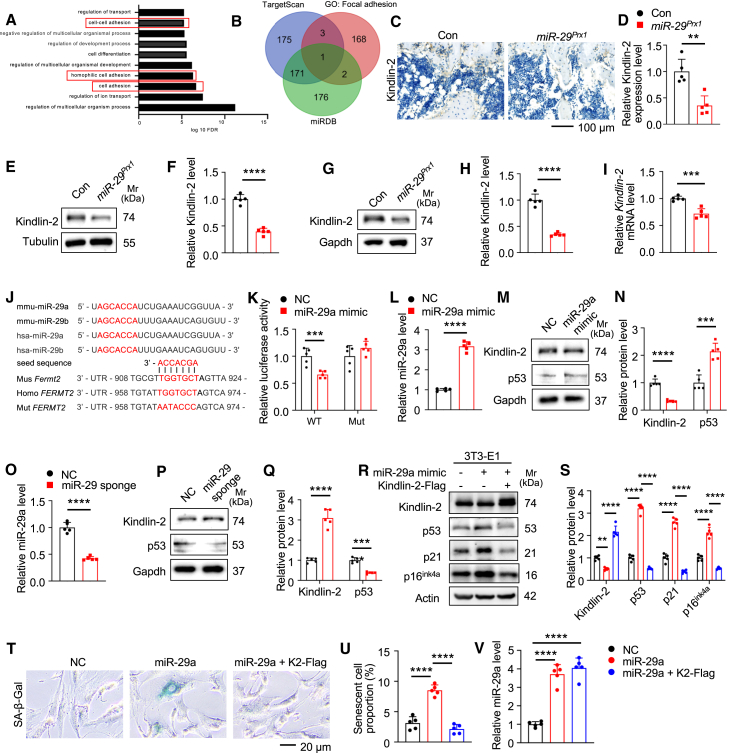
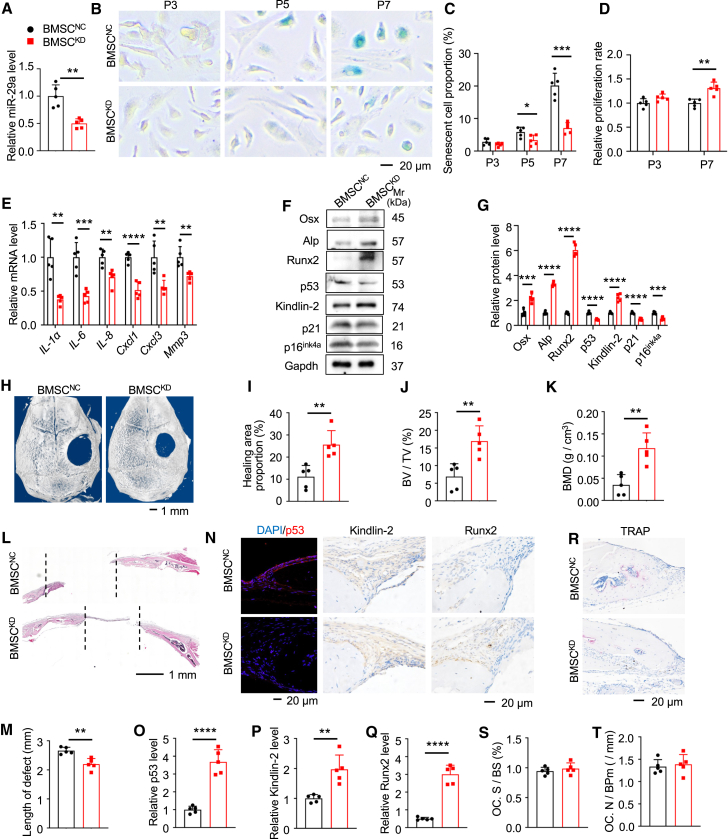
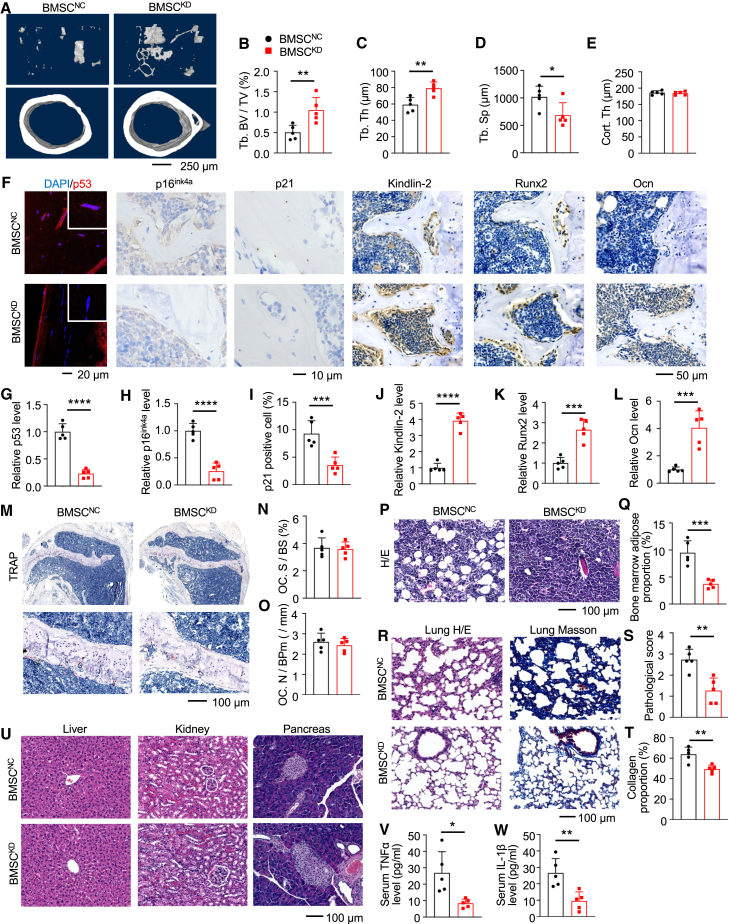
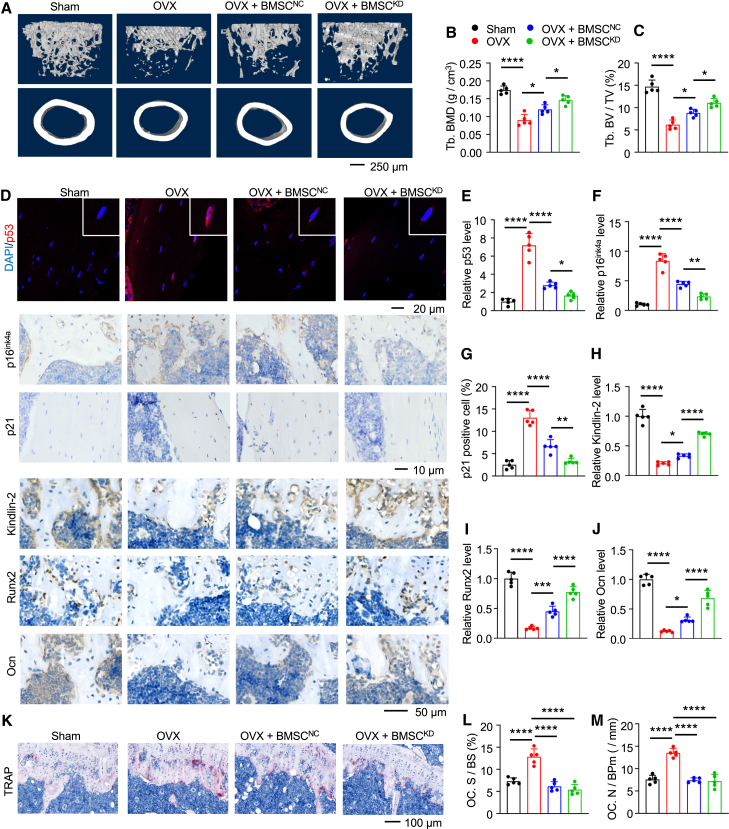
Mesenchymal stromal cell (MSC) senescence is a key factor in skeletal aging, affecting the potential of MSC applications. Identifying targets to prevent MSC and skeletal senescence is crucial. Here, we report increased miR-29 expression in bone tissues of aged mice, osteoporotic patients, and senescent MSCs. Genetic overexpression of miR-29 in Prx1-positive MSCs significantly accelerates skeletal senescence, reducing cortical bone thickness and trabecular bone mass, while increasing femur cross-sectional area, bone marrow adiposity, p53, and senescence-associated secretory phenotype (SASP) levels. Mechanistically, miR-29 promotes senescence by upregulating p53 via targeting Kindlin-2 mRNA. miR-29 knockdown in BMSCs impedes skeletal senescence, enhances bone mass, and accelerates calvarial defect regeneration, also reducing lipopolysaccharide (LPS)-induced organ injuries and mortality. Thus, our findings underscore miR-29 as a promising therapeutic target for senescence-related skeletal diseases and acute inflammation-induced organ damage.

Keywords: Kindlin-2; MSC therapy; aging; bone; bone repair; miR-29; osteoporosis; p53; skeletal senescence.


Conflict of interest statement

Declaration of interests The authors declare no competing interests.

Figures

None
Graphical abstract
Figure 1
Figure 1
miR-29 promotes the senescence of MSCs (A) The upregulated miRNAs in both bone tissues of aged mice (22 months) and OVX mice. (B) FISH staining for miR-29a expression on tibial sections. (C) Quantification of (B). (D) RT-qPCR analyses for miR-29a expression in bone tissues. N = 5 mice per group for (C) and (D). (E) FISH staining for miR-29a expression on bone sections of normal control (Con) and patients with OP. (F) Quantification of (E). N = 8 samples in control group and N = 10 samples in OP group. (G–I) Primary BMSCs were used for SA-β-Gal staining (G and H) and RT-qPCR analyses for miR-29a expression (I). (G) Representative images of SA-β-Gal. (H) Quantification of (G). (J–L) Primary BMSCs infected with miR-29a mimic or negative control RNA (NC) were used for SA-β-Gal staining (K and L) and RT-qPCR analyses for miR-29a overexpression (J). (K) Representative images of SA-β-Gal. (L) Quantification of (K). (M–O) Primary BMSCs infected with miR-29a inhibitor or negative control RNA (NC) were used for SA-β-Gal staining (N and O) and RT-qPCR analyses for miR-29a expression (M). (N) Representative images of SA-β-Gal. (O) Quantification of (N). n = 5 biologically independent experiments for (G–O). For RT-qPCR analyses, U6 expression was used for internal reference. Results are presented as mean ± standard deviation (S`D). ∗p < 0.05, ∗∗p < 0.01, ∗∗∗p < 0.001, ∗∗∗∗p < 0.0001, versus controls. Two-tailed Student’s t test.
Figure 2
Figure 2
Targeted genetic overexpression of miR-29 in MSCs markedly accelerates skeletal senescence in mice Two-month-old miR-29Prx1 mice and control mice (Con) were used for the following analyses. (A) Three-dimensional (3D) reconstruction from μCT scans of the distal femurs with the indicated sexes. (B–H) Quantitative analyses of BMD, BV/TV, Tb.Sp, Tb.N, and Cort.Th of distal femurs, cross-sectional area of bone marrow of midsection of femurs, and length of femurs. N = 6 mice in male miR-29Prx1 group, N = 5 mice in the remaining groups. (I) Three-dimensional (3D) reconstruction from μCT scans of the calvarial of female mice. (J and K) Quantitative analyses of BMD and BV/TV of calvaria. N = 5 mice per group. (L) Three-dimensional (3D) reconstruction from μCT scans of the vertebrae (lumber spine [L4]) of female mice. (M and N) Quantitative analyses of BMD and BV/TV of vertebrae. N = 5 mice in miR-29Prx1 group and N = 6 mice in control group. (O) Representative images of H&E staining of tibial sections of female mice. (P and Q) Adipocyte number and bone marrow adipose proportion were calculated. (R) RT-qPCR analyses. RNA samples were isolated from bone tissues. The expression level of mRNA was normalized to Gapdh. (S) IF and IHC staining. (T–V) Quantification of p53 (T), p16ink4a (U), and p21 (V). (W and X) WB analyses of bone tissue (W). (X) Quantification of (W). N = 5 mice per group for (O–X). Results are presented as mean ± standard deviation (SD). ∗p < 0.05, ∗∗p < 0.01, ∗∗∗p < 0.001, ∗∗∗∗p < 0.0001, versus controls. Two-tailed Student’s t test.
Figure 3
Figure 3
miR-29 promotes MSCs senescence via Kindlin-2/p53 axis (A) GO analysis of changed pathways identified through RNA-seq of the primary BMSCs from 2-month-old female miR-29Prx1 mice and control mice. (B) Venn map analyzing the factors of GO: Focal adhesion overlap with predicted miR-29 target genes. (C) IHC staining of Kindlin-2 on tibial sections from 2-month-old mice. (D) Quantification of (C). (E) WB analyses using protein extracts isolated from bone tissues of 2-month-old female mice. (F) Quantification of (E). N = 5 mice per group for (C–F). (G) WB analyses using protein extracts of primary BMSCs derived from 2-month-old female mice. (H) Quantification of (G). n = 5 biologically independent experiments. (I) RT-qPCR analysis of RNA samples isolated from bone tissues of 2-month-old female mice. Kindlin-2 mRNA was normalized to Gapdh mRNA. N = 5 mice per group. (J and K) Double luciferase assay. 3T3-E1 cells were transfected with plasmids harboring the wild-type KINDLIN-2 3′-UTR (WT) or the 3′-UTR with a mutation (Mut) in the miR-29 binding site downstream of the luciferase coding region together with miR-29 mimic or non-specific control (NC). Lysates were analyzed for luciferase activity. (L–N) 3T3-E1 cells transfected with miR-29a mimic and negative control RNA (NC) were used for RT-qPCR analyses (L) and WB analyses (M and N). (O–Q) 3T3-E1 cells transfected with miR-29 sponge and negative control plasmid (NC) were used for RT-qPCR analyses (O) and WB analyses (P and Q). (R–V) 3T3-E1 cells were initially transfected with a miR-29a mimic, followed by transfection with a Kindlin-2-Flag plasmid (K2-Flag) 24 h later. After 72 h, cells were subjected to RT-qPCR analyses (V) and WB analyses (R and S) and SA-β-Gal staining (T and U). n = 5 biologically independent experiments for (J–V). For RT-qPCR analyses, miR-29a was normalized to U6. Results are presented as mean ± standard deviation (SD). ∗p < 0.05, ∗∗p < 0.01, ∗∗∗p < 0.001, ∗∗∗∗p < 0.0001, versus controls. Two-tailed Student’s t test.
Figure 4
Figure 4
Treatment of BMSCKD accelerates calvarial bone regeneration BMSCs infected with lentivirus expressing miR-29 sponge plasmid (BMSCKD) or negative control (BMSCNC) were used for the following experiments. (A) RT-qPCR analyses for miR-29a expression. (B) Representative images of SA-β-Gal staining. (C) Quantification of (B). (D) CCK-8 assay for cell proliferation at P7. (E) RT-qPCR analyses using indicated primers. mRNAs were normalized to Gapdh mRNA. (F and G) WB analyses. n = 5 biologically independent experiments for (A–G). (H) Three-dimensional (3D) reconstruction from μCT scans of the calvariae of mice. A critical-sized calvarial bone defect model (3-mm diameter) was created in 4-month-old C57BL/6 mice; then BMSCNC and BMSCKD were applied to the wound of the calvarial bone defects. After 3 weeks, the mice were sacrificed for μCT analysis. (I–K) Quantitative analyses of healing area proportion, BMD, and BV/TV. (L) Representative images of H&E staining of calvarial sections at injured area. The defect areas were marked with black lines. (M) Quantitative analyses of length of injured area. (N) IF and IHC staining of calvarial sections. (O–Q) Quantification of p53 (O), Kindlin-2 (P), and Runx2 (Q). (R) TRAP staining of calvarial sections. (S and T) Oc.S/BS (S) and Oc.N/BPm (T) were measured using ImageJ. N = 5 mice per group for (H–T). Results are presented as mean ± standard deviation (SD). ∗p < 0.05, ∗∗p < 0.01, ∗∗∗p < 0.001, versus controls. Two-tailed Student’s t test.
Figure 5
Figure 5
Treatment of BMSCKD mitigates age-related phenotypes in mice (A) Three-dimensional (3D) reconstruction from μCT scans of the distal femurs. Female 24-month-old mice were administrated with BMSCKD or BMSCNC via tail vein injection, and mice were sacrificed 40 days post-injection for μCT analysis of the distal femurs for bone mass analysis. (B–E) Quantitative analyses of BV/TV, Tb.N, Tb.Sp, and Cort.Th. (F–Q) Tibial sections were subjected to IF staining for p53 expression (F and G), IHC staining for p16ink4a (F and H), p21 (F and I), Kindlin-2 (F and J), Runx2 (F and K), and Ocn (F and L), TRAP staining for osteoclast formation (M–O), and H&E staining (P and Q). Oc.S/BS (N) and Oc.N/BPm (O) were measured using ImageJ. (R) H&E staining and Masson staining of lung sections. (S) Quantifications of lung pathological score. (T) Quantifications of lung collagen proportion. (U) Representative images of H&E staining of liver, kidney, and pancreas sections. (V and W) ELISA assay of serum levels of IL-1β (V) and TNF-α (W). N = 5 mice per group. Results are presented as mean ± standard deviation (SD). ∗p < 0.05, ∗∗p < 0.01, ∗∗∗p < 0.001, versus controls. Two-tailed Student’s t test.
Figure 6
Figure 6
Treatment of BMSCKD protects against OP induced by OVX (A) Three-dimensional (3D) reconstruction from μCT scans of the distal femurs. Female 2-month-old mice were subjected to OVX surgery or sham, and one-week post-OVX, BMSCNC and BMSCKD were administrated to the OVX mice via tail vein injection. Mice were sacrificed 2-month post cell injection for μCT analysis of the distal femurs for bone mass analysis. (B and C) Quantitative analyses of BMD and BV/TV. (D–J) Tibial sections were subjected to IF and IHC staining with the indicated antibodies. (K–M) TRAP staining of tibial sections. Oc.S/BS (L) and Oc.N/BPm (M) were measured using ImageJ. N = 5 mice per group. Results are presented as mean ± standard deviation (SD). ∗p < 0.05, ∗∗p < 0.01, ∗∗∗p < 0.001, versus controls. One-way ANOVA.
Figure 7
Figure 7
Treatment of BMSCKD significantly alleviates LPS-induced organ damage and mortality rate 3-month-old female mice were injected with LPS intraperitoneally (25 mg/kg) followed by BMSCNC or BMSCKD or normal saline administration via tail vein injection and were then used for the following experiments. (A) Survival curve. N = 10 mice per group. Log rank test was used. (B) Three-dimensional (3D) reconstruction from μCT scans of the distal femurs. (C–E) Quantitative analyses of BMD, BV/TV, and Cort.Th. (F–K) Tibial sections were subjected to IHC staining and TRAP staining. Oc.S/BS (J) and Oc.N/BPm (K) were measured using ImageJ. (L) Representative images of H&E staining of lung sections, kidney sections, spleen sections, and liver sections. (M) Quantification of pathological score of lung tissue. (N) Quantification of kidney tubular damage proportion. N = 5 mice per group. Results are presented as mean ± standard deviation (SD). ∗p < 0.05, ∗∗p < 0.01, ∗∗∗p < 0.001, ∗∗∗∗p < 0.0001, versus controls. One-way ANOVA.

Similar articles

Cited by

References

    1. Ramanadham S., Yarasheski K.E., Silva M.J., Wohltmann M., Novack D.V., Christiansen B., Tu X., Zhang S., Lei X., Turk J. Age-related changes in bone morphology are accelerated in group VIA phospholipase A2 (iPLA2beta)-null mice. Am. J. Pathol. 2008;172:868–881. doi: 10.2353/ajpath.2008.070756. - DOI - PMC - PubMed
    1. Kim H.-N., Xiong J., MacLeod R.S., Iyer S., Fujiwara Y., Cawley K.M., Han L., He Y., Thostenson J.D., Ferreira E., et al. Osteocyte RANKL is required for cortical bone loss with age and is induced by senescence. Jci Insight. 2020;5 doi: 10.1172/jci.insight.138815. - DOI - PMC - PubMed
    1. Piemontese M., Almeida M., Robling A.G., Kim H.-N., Xiong J., Thostenson J.D., Weinstein R.S., Manolagas S.C., O'Brien C.A., Jilka R.L. Old age causes de novo intracortical bone remodeling and porosity in mice. Jci Insight. 2017;2 doi: 10.1172/jci.insight.93771. - DOI - PMC - PubMed
    1. Tong X., Malo M.K.H., Burton I.S., Jurvelin J.S., Isaksson H., Kröger H. Histomorphometric and osteocytic characteristics of cortical bone in male subtrochanteric femoral shaft. J. Anat. 2017;231:708–717. doi: 10.1111/joa.12670. - DOI - PMC - PubMed
    1. Boskey A.L., Coleman R. Aging and bone. J. Dent. Res. 2010;89:1333–1348. doi: 10.1177/0022034510377791. - DOI - PMC - PubMed

MeSH terms