. 2024 Aug 20;5(8):101685.
doi: 10.1016/j.xcrm.2024.101685.

Combining gemcitabine and MSC delivering soluble TRAIL to target pancreatic adenocarcinoma and its stroma

Affiliations

Combining gemcitabine and MSC delivering soluble TRAIL to target pancreatic adenocarcinoma and its stroma

Giulia Grisendi et al. Cell Rep Med. .

Abstract

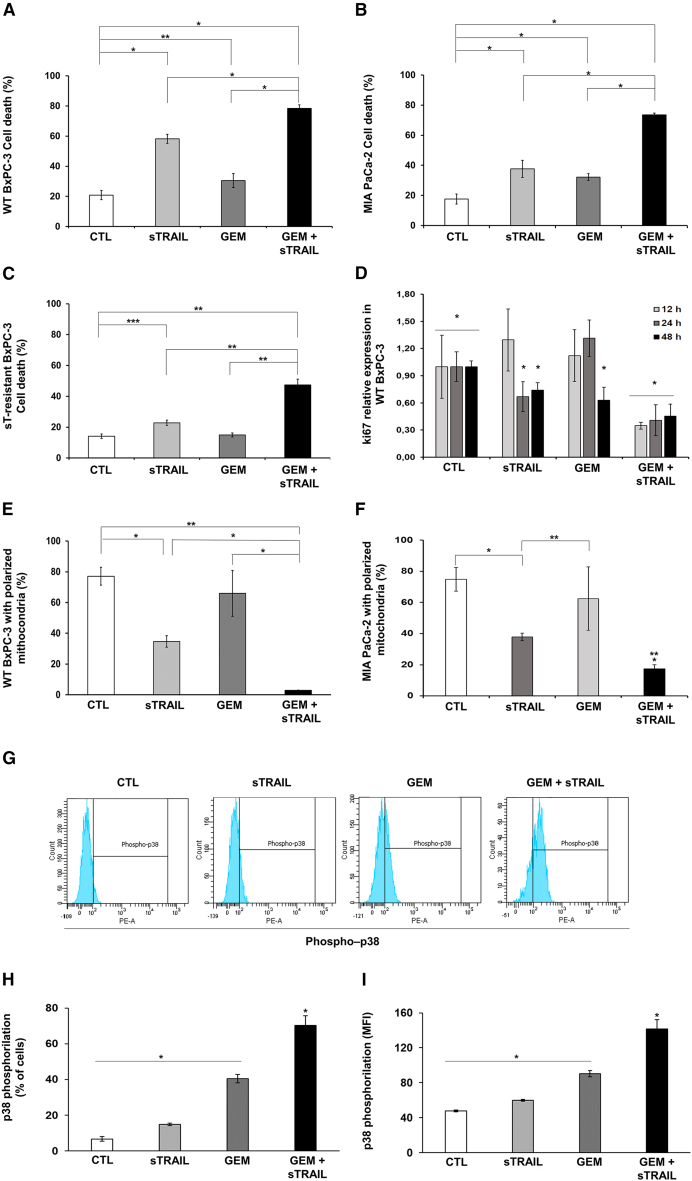
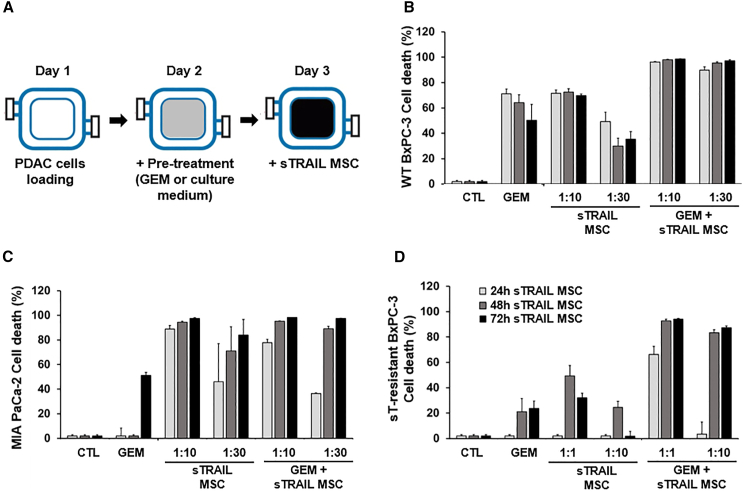
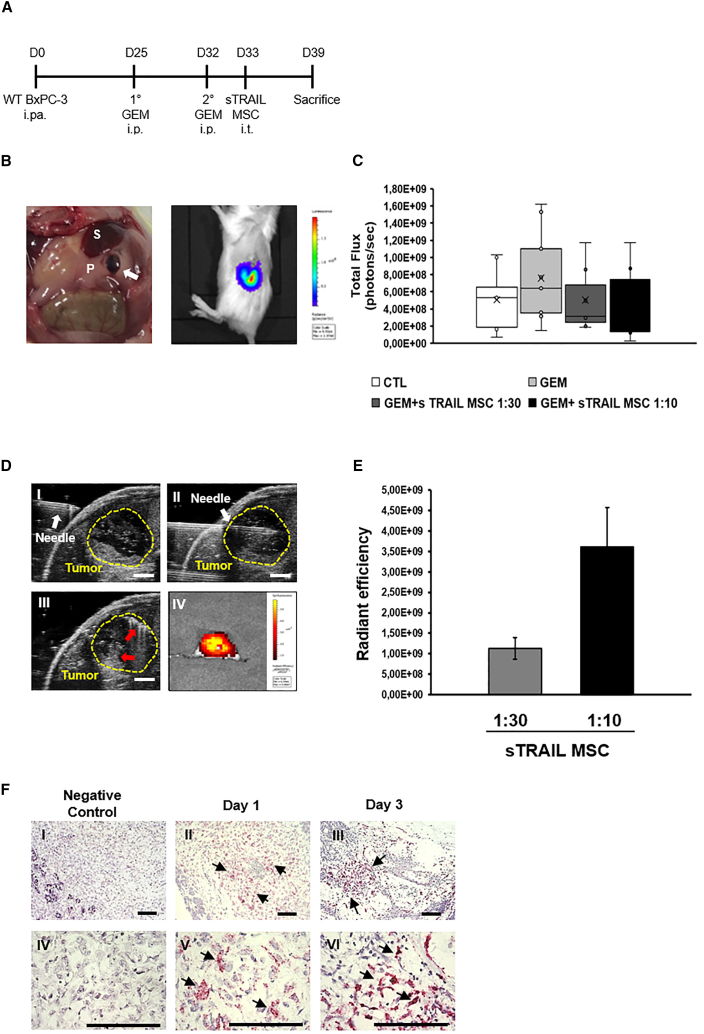
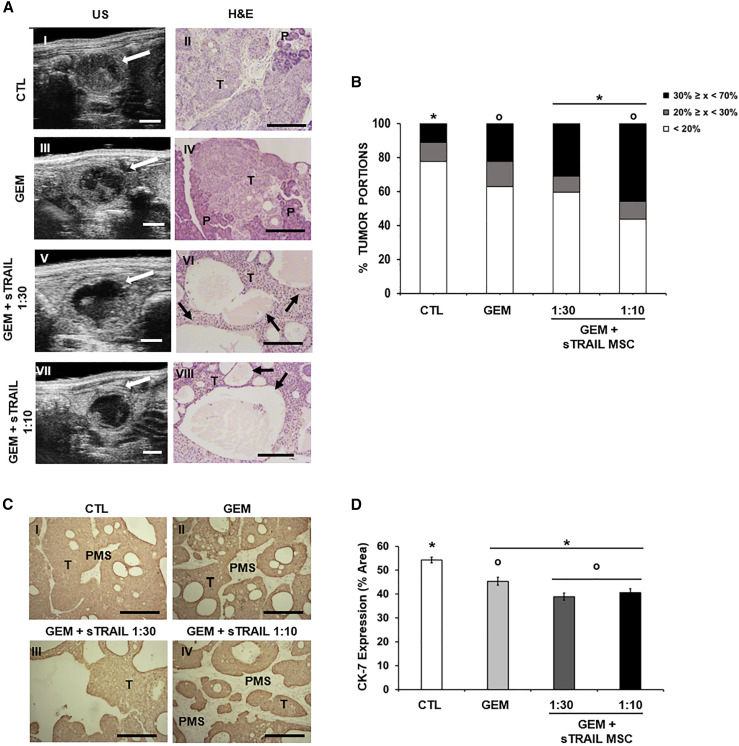
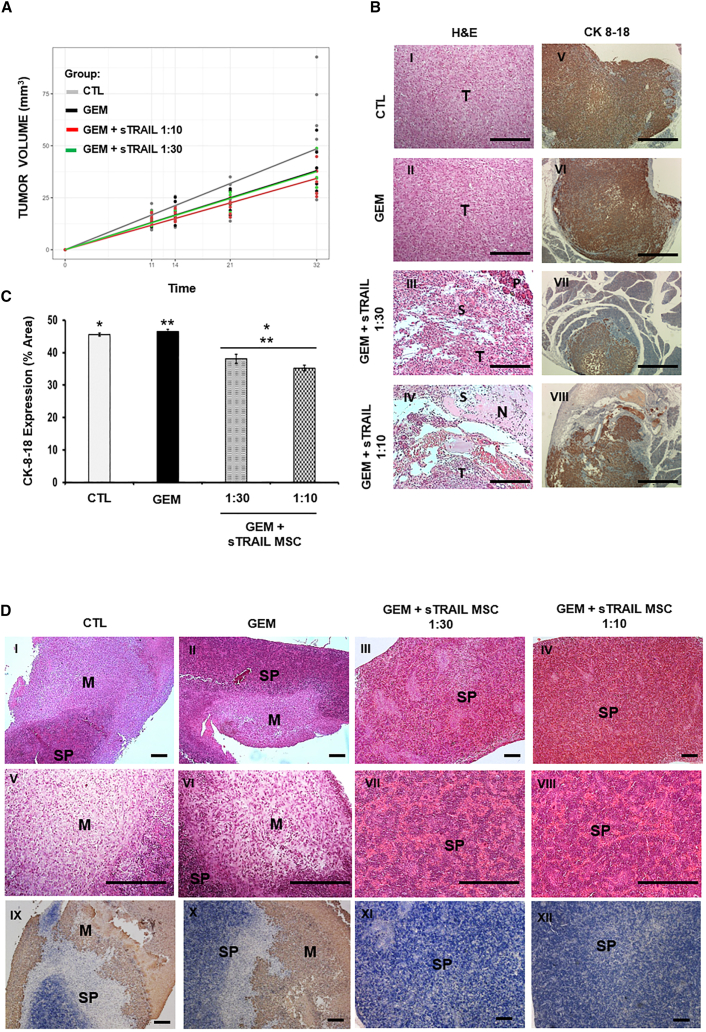
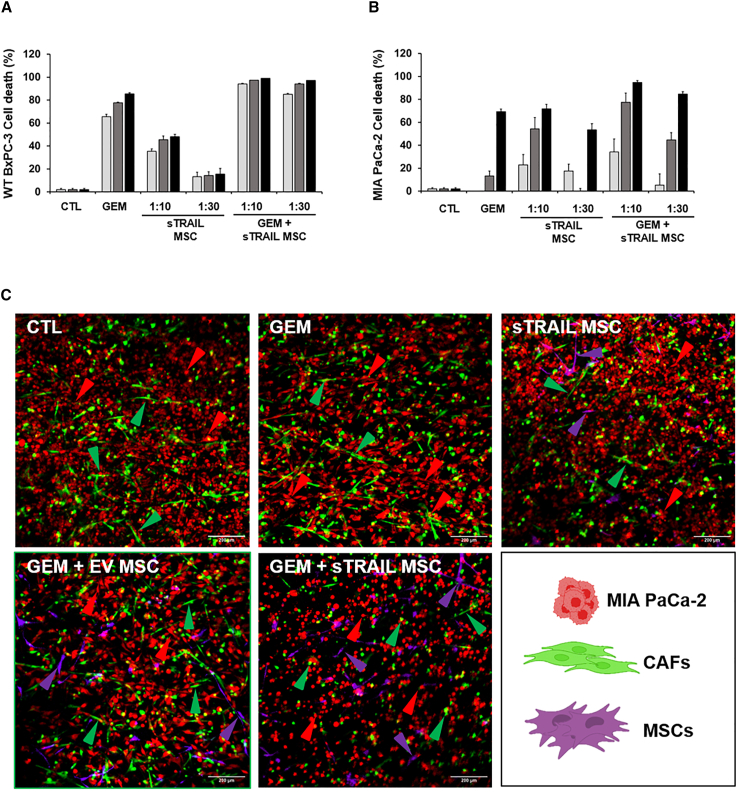
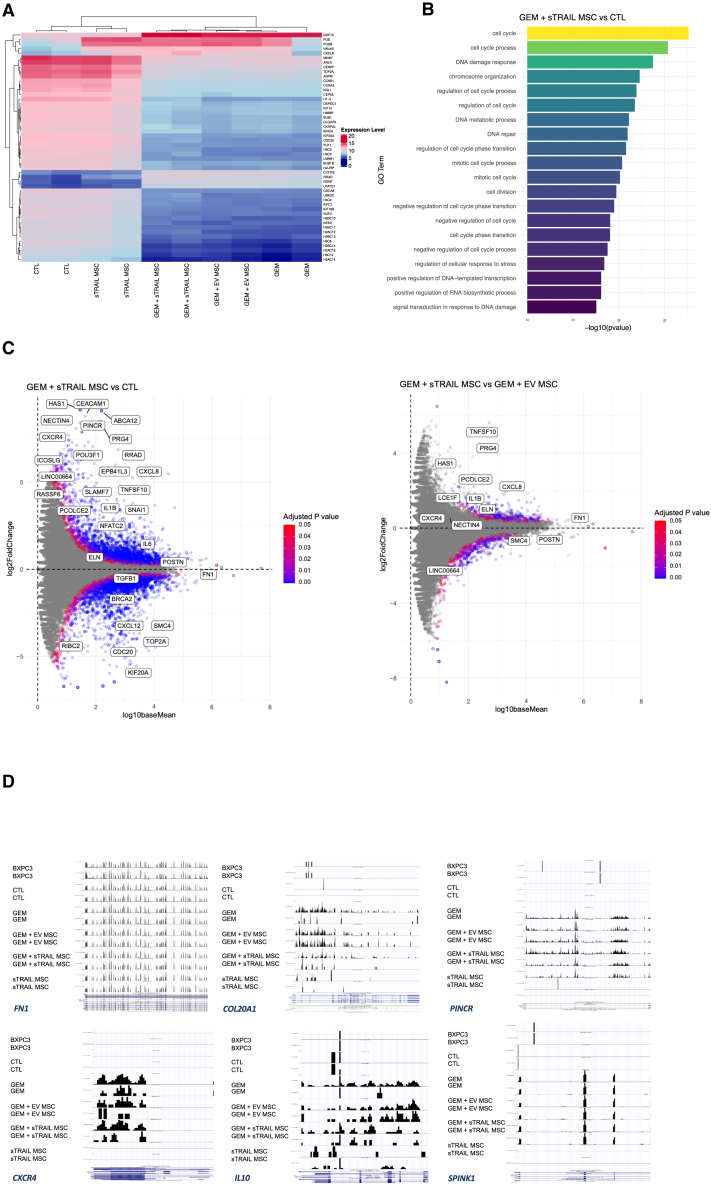
Pancreatic ductal adenocarcinoma (PDAC) still has a poor response to therapies, partly due to their cancer-associated fibroblasts (CAFs). Here, we investigate the synergistic impact of a combinatory approach between a known chemotherapy agent, such as gemcitabine (GEM), and gene-modified human mesenchymal stromal/stem cells (MSCs) secreting the pro-apoptotic soluble (s)TRAIL (sTRAIL MSCs) on both PDAC cells and CAFs. The combo significantly impacts on PDAC survival in 2D and 3D models. In orthotopic xenograft models, GEM and sTRAIL MSCs induce tumor architecture shredding with a reduction of CK7- and CK8/18-positive cancer cells and the abrogation of spleen metastases. A cytotoxic effect on primary human CAFs is also observed along with an alteration of their transcriptome and a reduction of the related desmoplasia. Collectively, we demonstrate a promising therapeutic profile of combining GEM and sTRAIL MSCs to target both tumoral and stromal compartments in PDAC.


Conflict of interest statement

Declaration of interests M. Dominici and G.G. hold patents in the field of cell and gene therapy. EIR Biotherapies srl holds patents related to the presented technologies. M. Dall’Ora and O.C. are employees of EVOTEC Modena Srl.

Figures

None
Graphical abstract
Figure 1
Figure 1
sTRAIL and GEM combo impacts on PDAC survival provoking a loss of mitochondrial membrane potential and p38 phosphorylation (A–C) Cytotoxicity assay performed in 2D by propidium Iodide PI (FACS analysis) on WT BxPC-3 (A), MIA PaCa-2 (B), and sT-resistant BxPC-3 (C) pre-treated with 10 μM (WT BxPC-3 and sT-resistant BxPC-3) or 100 μM (MIA PaCa-2) GEM for 24 h and subsequently treated for 24 h with CM collected from sTRAIL MSC containing 250 (WT BxPC-3), 500 (MIA PaCa-2), or 300 (sT-resistant BxPC-3) pg/mL sTRAIL, respectively. Culture media alone as a control (CTL). p values by t test: ∗p < 0.00001, ∗∗p < 0.005, ∗∗∗p < 0.05. (D) Relative expression of Ki67 in WT BxPC-3 after 12, 24, and 48 h with different treatments. p values by t test for GEM, sTRAIL, and GEM+sTRAIL compared to the control. ∗p values ≤ 0.001. (E and F) Mitochondrial depolarization (MD) by MitoStatus TMRE staining on cell lines. MD was evaluated after 12 h using FACSAria III. Untreated cells were used as a control. p value by t test for GEM, sTRAIL, and GEM+sTRAIL versus control: ∗p ≤ 0.05 for BxPC-3, ∗p ≤ 0.001 for MIA PaCa-2. p values by t test for GEM+sTRAIL compared to the single treatments: ∗∗p ≤ 0.005 for BxPC-3, ∗∗p ≤ 0.002 for MIA PaCa-2. (G) Representative FACS analysis of p38 phosphorylated in WT BxPC-3 after treatment with GEM, sTRAIL, or GEM+sTRAIL. (H) Percentage of cells showing p38 phosphorylated. p values by t test: ∗p < 0.04. (I) Mean fluorescence intensity (MFI) of phosphor-p38 in WT BxPC-3 after indicated treatments. p value by t test: ∗p < 0.02. All experiments were performed in triplicate and repeated at least two times.
Figure 2
Figure 2
sTRAIL MSC and GEM generate a robust anti-PDAC effect in 3D cultures (A) Cartoon of the experimental layout: luciferase+ PDAC cell lines (B, WT BxPC-3; C, MIA PaCa-2; D, sT-resistant BxPC-3) were cultured in VITVO (day 1), pre-treated (day 2) with GEM (10 μM for WT BxPC-3 and sT-resistant BxPC-3, 100 μM for MIA PaCa-2), or with plain medium for 24 h, and subsequently treated (day 3) up to 72 h with different E:T ratios of sTRAIL MSC (WT BxPC-3 and MIA PaCa-2 E:T = 1:10 and 1:30; sT-resistant BxPC-3 E:T = 1:1 and 1:10). Data are represented as mean ± SD (n = 3 experimental replicates). p values by t test: (B), CTL/GEM/sTRAIL MSC (1:30 and 1:10) vs. GEM+sTRAIL MSC (1:30 and 1:10) 24 h p ≤ 0.01, 48 h p < 0.005, 72 h p < 0.01; (C), CTL/GEM vs. GEM+sTRAIL MSC (1:30 and 1:10) 24 h p < 0.005, 48 h p < 0.0005, 72 h p < 0.005; (D), CTL/GEM/sTRAIL MSC 1:1 vs. GEM+sTRAIL MSC 1:1 24 h p< 0.0005; CTL/GEM/sTRAIL MSC (1:10 and 1:1) vs. GEM+sTRAIL MSC (1:10 and 1:1) 48 h p< 0.0005, 72 h p < 0.00001.
Figure 3
Figure 3
Establishment of the orthotopic model targeted by sTRAIL MSC intratumoral delivery (A) Animal treatment schedule. WT BxPC-3-luciferase+ cells (1 × 106) were injected in NOD-SCID mice pancreas at day 0. GEM was intraperitoneally administered at days 25 and 32, followed by ultrasound (US)-guided intratumor injection of sTRAIL MSC in two doses (E:T = 1:30 and 1:10) at day 33. Number of mice/group: CTL, n = 9; GEM, n = 9; GEM+sTRAIL MSC 1:30, n = 7; GEM+sTRAIL MSC 1:10, n = 8. (B) Left picture: after WT BxPC-3 injection by surgical procedure, a pocket within the mice pancreas was visible (white arrow). P, pancreas; S, spleen; right picture: representative image of tumor bioluminescence signal 7 days after WT BxPC-3 injection. (C) Boxplot referring the quantitative analysis of bioluminescence signal, measured in total flux (photon/sec), in mice 7 days after WT BxPC-3 injection. p values by t test: p ≥ 0.05. (D) Representative images of sTRAIL MSC US-guided injection in orthotopic PDAC. I, the syringe needle is entering mouse skin; II, the needle is inside the tumor; III, sTRAIL MSCs (red arrows) are located inside the tumor after injection. Yellow dashed line surrounds the tumor area. Scale bar 2 mm. IV, fluorescence image of murine pancreas with intrapancreatic tumor explanted 7 days after injection of sTRAIL MSC labeled by DiR. (E) Fluorescence radiant efficiency signal in the GEM+sTRAIL MSC groups (1:10 and 1:30) generated by DiR-labeled sTRAIL MSC engrafted into pancreatic tumor 7 days post-injection. p value by t test: ∗p < 0.05. (F) Representative images of BaseScope Assay on WT BxPC-3 tumors one (II and V) and three (III and VI) days after sTRAIL MSC (1:10) injection. Untreated tumor samples were also introduced as negative control (I and II). Individual sTRAIL RNA transcripts appear as distinct dots (arrows) of red chromogen precipitate. I–III, magnification 100×; IV–VI magnification 400×. Scale bar 100 μm.
Figure 4
Figure 4
sTRAIL MSC and GEM generate a robust anti-PDAC effect in vivo (A) Representative US and histological H&E images of orthotopic-implanted PDAC. In the left column US pictures of control (I) GEM alone treated (III) or with GEM+sTRAIL MSC 1:30 (V) or 1:10 (VII). White arrows indicate the intrapancreatic tumor. Compact and trophic neoplastic tissue was visible as bright hyperechoic regions in the control (I), while degenerated tumor appeared as hypoechoic (dark) regions in the treated mice (III, V, VII). Scale bar 2 mm. In the right column, microphotographs of H&E staining of tumors. T, tumor parenchyma; P, pancreas; black arrow, necrotic areas. Magnification 100×, scale bar 200 μm. (B) Percentage of tumor portions per group with black/hypoechoic/empty areas measured via US. p values by chi-squared test: x < 20%, CTL/GEM vs. GEM+sTRAIL MSC 1:10 p ≤ 0.05; 30% ≤ x < 70%, CTL vs. GEM+sTRAIL MSC 1:30 p < 0.05, CTL/GEM vs. GEM+sTRAIL MSC 1:10 p ≤ 0.01. (C) Histology of PDAC in mice stained by anti-CK7 IHC; pancreatic murine stroma (PMS) is visible among human tumor cells (T). Magnification 100×, scale bar 200 μm. (D) Quantification of CK7-positive areas within groups. p values by t test: ∗p < 0.00001; °p < 0.05.
Figure 5
Figure 5
sTRAIL MSC and GEM impact on MIA PaCa-2 abrogating splenic metastasis in an orthotopic model (A) Tumor volume was measured through US scans from the day of tumor implant until sacrifice. The dependent variables were the raw measurements of the outcomes, whereas the set of independent variables includes treatment arm, time (in days from baseline), and the interaction between arm and time. A random intercept term was also included to account for repeated measurements over the same individual. Results of this analysis were expressed as mean differences and are reported with 95% confidence intervals (CIs) and p values. All treated groups show a significant reduction in tumor growth compared to CTL; in particular GEM vs. CTL p = 0.001; GEM+ sTRAIL1:30 vs. CTL p = 0.001; GEM+sTRAIL1:10 vs. CTL p = 0.000005. (B) H&E staining and immunohistochemistry anti-CK8/18 on intrapancreatic tumors. Positive areas (brown, 3,3′-diaminobenzidine [DAB]) represent human PDAC tumor. Tumor degeneration was observed in mice treated with GEM+sTRAIL MSC. T, tumor; S, stroma; N, necrotic area; P, pancreas. Magnification 100×, scale bar 200 μm. (C) Quantification of CK8/18-positive areas within the different groups. For each tumor, two slides were evaluated. p value by t test: ∗,∗∗p < 0.0001; ∗∗∗p < 0.05. (D) Representative images of hematoxylin and eosin staining (upper and middle rows) and CK8/18 immunohistochemistry (lower row) on mice metastatic spleens. Tumor metastatic areas were found in the spleen of control group (CTL) and of mice treated with GEM, but not in the groups treated with the combinatorial regimen. M, metastasis; SP, spleen. I–IV and IX–XII magnification 100×, scale bar 200 μm; IX–XII magnification 200×, scale bar 100 μm.
Figure 6
Figure 6
Primary CAFs do not interfere on GEM and sTRAIL MSC cytotoxicity in 3D PDAC avatars Luc+ BxPC-3 WT (A) and MIA PaCA-2 (B) pre-treated with 10 or 100 μM GEM for 24 h and subsequently treated up to 72 h with different concentrations of sTRAIL MSC (E:T = 1:10 and 1:30). Tumor viability was quantified by BLI signal intensity. Data are represented as mean ± SD (n = 2 experimental replicates). p values by t test: (A) 24, 48, and 72 h CTL/GEM/sTRAIL MSC (1.30 and 1:10) vs. GEM+sTRAIL MSC (1:30 and 1:10) p < 0.00005; (B), 24 h CTL/GEM vs. GEM+sTRAIL MSC (1:30 and 1:10) p ≤ 0.05, 24 h sTRAIL MSC 1:30 vs. GEM+sTRAIL MSC 1:10 p < 0.05; 48 h CTL/GEM/sTRAIL MSC 1:30 vs. GEM+sTRAIL MSC (1:30 and 1:10) p < 0.05; 72 h CTL/GEM/sTRAIL MSC (1.30 and 1:10) vs. GEM+sTRAIL MSC (1:30 and 1:10) p < 0.05. (C) Confocal microscopy imaging of co-culture with MIA PaCA-2 (Orange CMRA Dye, red arrows) and CAF (CellTrace CFSE, green arrows) cells loaded into a VITVO and treated with GEM alone, sTRAIL MSC (CellTracker Deep Red dye, purple arrows) alone, or GEM+ sTRAIL MSC. Untreated MIA PaCa-2 or MIA PaCa-2 treated with GEM+EV MSC were used as controls. Images were acquired at the end of 72 h with Nikon A1 Plus confocal microscope; objective 10×; z stack step 5 μm; scale bar 200 μm. Experiments are expressed as duplicates.
Figure 7
Figure 7
GEM and sTRAIL MSC combo alters CAF transcriptome (A) Heatmap shows a similar pattern of gene expression between GEM, GEM+EV MSC, and GEM+sTRAIL MSC. (B) The most significant biological processes downregulated in combo treatment versus control using clusterProfiler Gene Ontology enrichment analysis. (C) GEM+sTRAIL MSC treatment (left) shows downregulation of cell cycle and mitosis-related genes such as SMC4, TOP2A, KIF20A, and CDC20 and overexpression of CXCL8, NFATC2, and SNAI1 while expressions of FN1, POSTN, and TGFB1 do not show significant changes; GEM+sTRAIL MSC versus GEM-EV (right) shows overexpression of TNFSF10 and CXCL8. (D) UCSC snapshot of different treatments on CAFs; BxPC-3 as a PDAC tumoral control cell line. Overexpression of COL20A1, CXCR4, IL10, PINCR, and SPINK1 in GEM, GEM-EV, and GEM+sTRAIL MSC treatment.

References

    1. Malvezzi M., Bertuccio P., Levi F., La Vecchia C., Negri E. European cancer mortality predictions for the year 2014. Ann. Oncol. 2014;25:1650–1656. - PubMed
    1. Ferlay J., Colombet M., Soerjomataram I., Dyba T., Randi G., Bettio M., Gavin A., Visser O., Bray F. Cancer incidence and mortality patterns in Europe: Estimates for 40 countries and 25 major cancers in 2018. Eur. J. Cancer. 2018;103:356–387. - PubMed
    1. Kamisawa T., Wood L.D., Itoi T., Takaori K. Pancreatic cancer. Lancet (London, England) 2016;388:73–85. - PubMed
    1. Dall'Ora M., Rovesti G., Reggiani Bonetti L., Casari G., Banchelli F., Fabbiani L., Veronesi E., Petrachi T., Magistri P., Di Benedetto F., et al. TRAIL receptors are expressed in both malignant and stromal cells in pancreatic ductal adenocarcinoma. Am. J. Cancer Res. 2021;11:4500–4514. - PMC - PubMed
    1. Burris H.A., Andersen J., Green M.R., Rothenberg M.L., Modiano M.R., Cripps M.C., Portenoy R.K., Storniolo A.M., Tarassoff P., et al. Moore M.J. Improvements in survival and clinical benefit with gemcitabine as first-line therapy for patients with advanced pancreas cancer: a randomized trial. J. Clin. Oncol. 1997;15:2403–2413. - PubMed

MeSH terms