. 2024 Aug 20;5(8):101686.
doi: 10.1016/j.xcrm.2024.101686.

Soluble Tim-3 serves as a tumor prognostic marker and therapeutic target for CD8+ T cell exhaustion and anti-PD-1 resistance

Affiliations

Soluble Tim-3 serves as a tumor prognostic marker and therapeutic target for CD8+ T cell exhaustion and anti-PD-1 resistance

Chaojia Chen et al. Cell Rep Med. .

Abstract

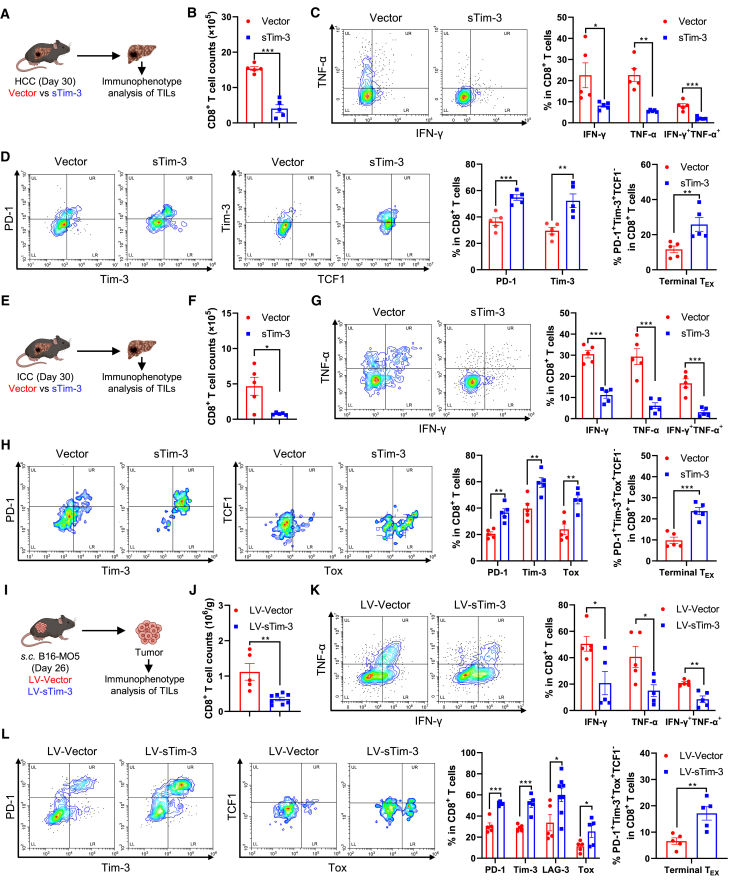
Resistance to PD-1 blockade in onco-immunotherapy greatly limits its clinical application. T cell immunoglobulin and mucin domain containing-3 (Tim-3), a promising immune checkpoint target, is cleaved by ADAM10/17 to produce its soluble form (sTim-3) in humans, potentially becoming involved in anti-PD-1 resistance. Herein, serum sTim-3 upregulation was observed in non-small cell lung cancer (NSCLC) and various digestive tumors. Notably, serum sTim-3 is further upregulated in non-responding patients undergoing anti-PD-1 therapy for NSCLC and anti-PD-1-resistant cholangiocarcinoma patients. Furthermore, sTim-3 overexpression facilitates tumor progression and confers anti-PD-1 resistance in multiple tumor mouse models. Mechanistically, sTim-3 induces terminal T cell exhaustion and attenuates CD8+ T cell response to PD-1 blockade through carcinoembryonic antigen-related cell adhesion molecule 1 (CEACAM-1). Moreover, the ADAM10 inhibitor GI254023X, which blocks sTim-3 production, reduces tumor progression in Tim-3 humanized mice and reverses anti-PD-1 resistance in human tumor-infiltrating lymphocytes (TILs). Overall, human sTim-3 holds great predictive and therapeutic potential in onco-immunotherapy.

Keywords: ADAM10; CEACAM-1; HCC; ICC; T cell exhaustion; anti-PD-1 therapy; hepatocellular carcinoma; intrahepatic cholangiocarcinoma; lung cancer; resistance to PD-1 blockade; sTim-3.


Conflict of interest statement

Declaration of interests C.L., C.M., C.C., J.P., S.M., and X.L. are inventors on the China patent (ZL202111222514.8) “Application of soluble form of Tim-3 in resistance to immune checkpoint blockade therapy” that has claims directed to sTim-3 application in immunotherapy.

Figures

None
Graphical abstract
Figure 1
Figure 1
Serum sTim-3 is a potential biomarker of tumor progression and anti-PD-1 resistance (A) The serum sTim-3 concentrations in NSCLC patients (N = 65) and healthy people (N = 23) were determined by ELISA. (B) The serum sTim-3 concentrations in lung squamous cell carcinoma (LUSC) patients (N = 12), lung adenocarcinoma (LUAD) patients (N = 53), and healthy individuals (N = 23) were determined using ELISA. (C) The serum sTim-3 concentrations in different subtypes of lung adenocarcinoma, including adenocarcinoma in situ (AIS) (N = 10), minimally invasive adenocarcinoma (MIA) (N = 11), and invasive adenocarcinoma (IAC) (N = 32), as well as healthy individuals (N = 23) were determined using ELISA. (D) The serum concentrations of sTim-3 in LUAD patients at early (N = 10) and advanced stages (N = 43) according to the tumor/node/metastasis (TNM) classification system. (E) Correlation of serum sTim-3 concentrations with in situ tumor size in patients with LUAD. (F) Kaplan-Meier survival curve of NSCLC patients with high (N = 32) versus low (N = 32) sTim-3 expression. (G) sTim-3 concentrations in the serum of anti-PD-1-treated (N = 67) or non-treated (N = 54) NSCLC patients were evaluated using ELISA. (H) sTim-3 concentrations in the serum of NSCLC patients post anti-PD-1 therapy, including 16 responders and 26 non-responders, were evaluated using ELISA. (I) The serum sTim-3 concentrations in healthy individuals (N = 28), HCC patients (N = 20), gastric cancer patients (N = 16), colorectal cancer patients (N = 15), and cholangiocarcinoma (N = 9) patients. Data are presented as means ± SEM and were analyzed by the two-tailed unpaired Student’s t test (A, B, C, D, G, H, and I), linear regression (E) and log rank test (F). ∗p < 0.05, ∗∗p < 0.01, ∗∗∗p < 0.001, and ∗∗∗∗p < 0.0001.
Figure 2
Figure 2
sTim-3 promotes tumor progression in multiple mouse models (A–H) Overexpression of sTim-3 in the AKT/c-Myc-induced intrahepatic HCC models. (A) Schematic diagram of human sTim-3-overexpressing or control HCC model. (B) Concentrations of serum sTim-3 in HCC model (n = 5). (C) Representative images and (D) quantification of bioluminescence in the liver at four weeks post tumor induction (n = 6). (E) Liver-to-body weight ratio (n = 5). (F) Gross appearances of the liver. (G) H&E staining and Ki67 immunohistochemistry staining of the intact liver tumors. (H) Survival curve (n = 6). (I–P) Overexpression of sTim-3 in the intrahepatic AKT-NICD1-induced ICC models. (I) Schematic diagram of sTim-3-overexpressing or control ICC model. (J) Concentrations of serum sTim-3 in ICC model (n = 5). (K) Representative images and (L) quantification of bioluminescence in the liver at four weeks post tumor induction (n = 7). (M) Liver-to-body weight ratio (n = 9). (N) Gross appearances of the liver. (O) H&E staining and Ki67 immunohistochemistry staining of the intact liver tumors. (P) Survival curve (Vector, n = 6; sTim-3, n = 7). (Q–T) Control (LV-Vector) or sTim-3-overexpressing (LV-sTim-3) B16-MO5 melanoma cells were subcutaneously injected into wild-type and Tim-3 knockout mice , separately. (Q) Schematic diagram of the B16-MO5 tumor model. (R) Concentrations of serum sTim-3. (S) Tumor growth curve (wild-type: LV-Vector, n = 5; LV-sTim-3, n = 4;Tim-3 knockout: LV-Vector, n = 4; LV-sTim-3, n = 4). (T) Survival curve (wild-type: LV-Vector, n = 7; LV-sTim-3, n = 8;Tim-3 knockout: LV-Vector, n = 4; LV-sTim-3, n = 4). All results are representative of at least three independent experiments. Data are presented as mean ± SEM and were analyzed by the unpaired Student’s t test (B, D, E, J, L, and M), two-way analysis of variance (ANOVA) (S), and log rank test (H, P, and T). ∗p < 0.05, ∗∗p < 0.01, and ∗∗∗p < 0.001.
Figure 3
Figure 3
sTim-3 overexpression aggravates T cell exhaustion in tumor microenvironments (A–D) Tumor-infiltrating lymphocytes were isolated from control (n = 5) and sTim-3-overexpression (n = 5) HCC mice on day 30 post-HDI. (A) Schematic diagram of the immune phenotype analysis. (B) The number of CD8+ T cells in tumors. (C) Percentages of IFN-γ+, TNF-α+, and IFN-γ+TNF-α+ CD8+ TILs. (D) Percentage of PD-1+, Tim-3+, and PD-1+Tim-3+TCF1 (TEX) CD8+ T cells in tumor. (E–H) Tumor-infiltrating lymphocytes were isolated from control (n = 5) and sTim-3-overexpression (n = 5) ICC mice on day 30 post-HDI. (E) Schematic diagram of the immune phenotype analysis. (F) The number of CD8+ T cells in tumors. (G) Percentages of IFN-γ+, TNF-α+, and IFN-γ+TNF-α+ CD8+ TILs. (H) Percentage of PD-1+, Tim-3+, Tox+, and PD-1+Tim-3+Tox+TCF1 (TEX) tumor-infiltrating CD8+ T cells. (I–L) Tumor-infiltrating lymphocytes were isolated from control and sTim-3-overexpression B16-MO5 tumor control on day 26 post-tumor inoculation. (I) Schematic diagram of the immune phenotype analysis. (J) The number of CD8+ T cells per gram of tumor tissue from control (n = 5) and sTim-3-overexpressing (n = 8) B16-MO5 tumor-bearing mice. (K) Percentages of IFN-γ+, TNF-α+, and IFN-γ+TNF-α+ CD8+ TILs from control (n = 5) and sTim-3-overexpressing (n = 5) B16-MO5 tumors were measured. (L) Percentage of PD-1+, Tim-3+, LAG-3+, Tox+, and PD-1+Tim-3+Tox+TCF1 (TEX) tumor-infiltrating CD8+ T cells from control (n = 5) and sTim-3-overexpressing (n = 5) B16-MO5 tumor mice. All results are representative of at least three independent experiments. Data are presented as mean ± SEM and were analyzed by the unpaired Student’s t test. ∗p < 0.05, ∗∗p < 0.01, and ∗∗∗p < 0.001.
Figure 4
Figure 4
sTim-3 abrogates the therapeutic effects of anti-PD-1 treatment (A) Schematic diagram of HCC mice or ICC mice treated with isotype control antibodies (IgG) or anti-PD-1 (α-PD-1). (B–D) (B) Representative images and (C) quantification of bioluminescence in the liver of HCC mice at 4 weeks post-HDI (n = 6). (D) Survival curve of HCC mice (Vector + IgG n = 7; Vector + anti-PD-1 n = 7; sTim-3 + IgG n = 9; sTim-3 + anti-PD-1 n = 8). (E–G) (E) Representative images and (F) quantification of bioluminescence in the liver of ICC mice at 3 weeks post-HDI (Vector + IgG n = 13; Vector + anti-PD-1 n = 10; sTim-3 + IgG n = 9; sTim-3 + anti-PD-1 n = 9). (G) Survival curve of ICC mice (Vector + IgG n = 8; Vector + anti-PD-1 n = 7; sTim-3 + IgG n = 10; sTim-3 + anti-PD-1 n = 9). All results are representative of at least two independent experiments. Data are presented as mean ± SEM and were analyzed by the Mann-Whitney U test (C and F) and log rank test (D and G). ∗p < 0.05, ∗∗p < 0.01, and ∗∗∗p < 0.001; ns, no significance.
Figure 5
Figure 5
sTim-3 induces T cell dysfunction and reduces T cell anti-PD-1 response (A and B) WT (A, n = 7) or Tim-3 KO (B, n = 3) OT-Ⅰ CTLs were pretreated with sTim-3 protein (5 μg/mL) and stimulated with anti-CD3/CD28 antibodies for 6 h. IFN-γ, TNF-α, and IL-2 production was assessed using flow cytometry. (C) Cytotoxicity of control (RV-Vector) and sTim-3-overexpressing (RV-sTim-3) OT-Ⅰ CTLs against firefly luciferase-expressing B16F10 targets (n = 3). (D) Exhausted OT-Ⅰ CTLs were induced by chronic stimulation in the presence or absence of sTim-3. Percentages of PD-1+Tim-3+TOX+TCF1 CD8+ TEX cells were assessed using flow cytometry (n = 5). (E) OT-Ⅰ CTLs were pretreated with IgG or anti-PD-1 antibodies (5 μg/mL) in the presence of sTim-3 protein (5 μg/mL) or not and stimulated with anti-CD3/CD28 antibodies for 6 h. IFN-γ and TNF-α production were assessed using flow cytometry (n = 6). (F) TILs from HCC patients were pretreated with sTim-3 protein (5 μg/mL) and stimulated with anti-human CD3/CD28 beads. TNF-α and IFN-γ in supernatants were detected using ELISA 24 h later (n = 6). (G) TILs from HCC patients were pretreated with sTim-3 protein (5 μg/mL) and anti-PD-1 antibodies (5 μg/mL) and stimulated with anti-human CD3/CD28 beads. IFN-γ in supernatants was detected using ELISA 24 h later (n = 3). (H and I) Gene set enrichment analysis (GSEA) was performed to determine the specific enrichment in T cell activation signature gene set (H) and anti-PD-1 unresponsive gene set (I) in human sTim-3 protein-treated CTLs versus Mock CTLs. FDR, false discovery rate; NES, normalized enrichment score. (J) Representative immunoblots of sTim-3 protein-treated OT-Ⅰ CTLs or Mock OT-Ⅰ CTLs after stimulation with anti-CD3/CD28 antibodies for indicated time points. (K) Flow cytometry analysis of phospho-LCK, phospho-Zap-70 (Syk), and phospo-PLCγ-1 in mouse HCC tumor-infiltrating CD8+ T cells. All results are representative of at least three independent experiments. Data are presented as mean ± SEM and were analyzed by the unpaired Student’s t test (A, B, D, E, F, G, and K) and two-way ANOVA (C). ∗p < 0.05, ∗∗p < 0.01, and ∗∗∗p < 0.001; ns, no significance.
Figure 6
Figure 6
sTim-3 augments T cell dysfunction and anti-PD-1 resistance via CEACAM-1 (A–C) RV-shCEACAM-1 was used to knock down CEACAM-1 in OT-I CTLs cells. (A) shCEACAM-1 OT-Ⅰ CTLs were pretreated with sTim-3 protein (5 μg/mL), followed by stimulation with anti-CD3/CD28 antibodies for 6 h. IFN-γ and TNF-α production was assessed using flow cytometry (n = 3). (B) Exhausted shCEACAM-1 OT-Ⅰ CTLs were induced in the presence or absence of sTim-3. Percentages of PD-1+Tim-3+TOX+TCF1 CD8+ TEX cells were assessed using flow cytometry (n = 5). (C) shCEACAM-1 OT-Ⅰ CTLs were pretreated with IgG or anti-PD-1 antibodies (5 μg/mL) in the presence of sTim-3 protein (5 μg/mL) or not, followed by stimulation with anti-CD3/CD28 antibodies for 6 h. IFN-γ and TNF-α production was assessed using flow cytometry (n = 3). (D–F) RV-sgCEACAM-1 was used to knock out CEACAM-1 in OT-Ⅰ-Cas9tdTomato CTLs cells. (D) IFN-γ and TNF-α production by control or sTim-3-treated sgCEACAM-1 OT-Ⅰ CTLs were assessed using flow cytometry (n = 3). (E) Exhausted sgCEACAM-1 OT-Ⅰ CTLs were induced in the presence or absence of sTim-3. Percentages of PD-1+Tim-3+TCF1 CD8+ TEX cells were assessed using flow cytometry (n = 5). (F) sgCEACAM-1 OT-Ⅰ CTLs were pretreated with IgG or anti-PD-1 antibodies (5 μg/mL) in the presence of sTim-3 protein (5 μg/mL) or not, followed by stimulation with anti-CD3/CD28 antibodies. IFN-γ and TNF-α production was assessed using flow cytometry (n = 3). (G and H) Jurkat cells (G) or CEACAM-1-overexpressing Jurkat cells (Jurkat-CEACAM-1) (H) were pretreated with sTim-3 protein (5 μg/mL) and then stimulated with anti-CD3/CD28 antibodies for 12 h. IL-2 expression at mRNA and protein level was assessed using qPCR and flow cytometry (n = 3). (I and J) Representative immunoblots of control (Mock) and sTim-3-treated Jurkat cells (I) or Jurkat-CEACAM-1 cells (J), which were stimulated with anti-CD3/CD28 antibodies for indicated time points. (K and L) PD-1-overexpressing Jurkat or Jurkat-CEACAM-1 cells were pretreated with anti-PD-1 antibody for 1 h and then stimulated with plate-coated anti-CD3/CD28 antibodies and PD-L1 protein for 6 h. RT-qPCR detected the IL-2 mRNA level of Jurkat-PD-1 cells (K) and Jurkat-CEACAM-1-PD-1 cells (L). All results are representative of at least three independent experiments. Data are presented as mean ± SEM and were analyzed by the unpaired Student’s t test (A, B, C, D, E, F, G, H, K, and L). ∗p < 0.05 and ∗∗p < 0.01; ns, no significance.
Figure 7
Figure 7
Blocking sTim-3 or ADAM10 suppresses tumor progression and reverses anti-PD-1 resistance (A and B) Tim-3 knockout mice were hydrodynamically injected with mTim-3/AKT/c-Myc plasmids to construct the sTim-3-overexpressing HCC model and then received anti-Tim-3 antibody (α-Tim-3) at the indicated times. (A) Schematic diagram of the sTim-3-overexpressing HCC in Tim-3 KO mice treated with anti-Tim-3 antibody. (B) Survival curve of Tim-3 KO mice bearing sTim-3-overexpressing HCC treated with IgG or anti-Tim-3 antibody (n = 7). (C–E) Tim-3 humanized mice were hydrodynamically injected with AKT/c-Myc plasmids to construct an HCC model, and mice were then treated with intraperitoneal DMSO or ADAM10 inhibitor GI254023X (GI, 20 mg/kg/d) at the indicated times. (C) Schematic diagram of the experiment. (D) Tumor growth was assessed using bioluminescence imaging (n = 7 per group), and (E) survival curves were monitored (DMSO: n = 7; GI: n = 8). (F and G) Human TILs from HCC patients were isolated and pretreated with ADAM10 inhibitor GI (5 μM) or DMSO together with anti-PD-1 antibodies (5 μg/mL) or IgG (5 μg/mL) for 3 days and then stimulated with anti-human CD3/CD28 beads for 24 h (n = 4). (F) Schematic diagram of the experiment. (G) The secretion of IFN-γ in the supernatants was detected using ELISA. All results are representative of at least two independent experiments. Data are presented as mean ± SEM and were analyzed by the unpaired Student’s t test (D and G) and log rank test (B and E). ∗p < 0.05 and ∗∗p < 0.01; ns, no significance.

References

    1. Wherry E.J. T cell exhaustion. Nat. Immunol. 2011;12:492–499. - PubMed
    1. Ren D., Hua Y., Yu B., Ye X., He Z., Li C., Wang J., Mo Y., Wei X., Chen Y., et al. Predictive biomarkers and mechanisms underlying resistance to PD1/PD-L1 blockade cancer immunotherapy. Mol. Cancer. 2020;19:19. doi: 10.1186/s12943-020-1144-6. - DOI - PMC - PubMed
    1. Sharma P., Hu-Lieskovan S., Wargo J.A., Ribas A. Primary, Adaptive, and Acquired Resistance to Cancer Immunotherapy. Cell. 2017;168:707–723. doi: 10.1016/j.cell.2017.01.017. - DOI - PMC - PubMed
    1. Roncella S., Laurent S., Fontana V., Ferro P., Franceschini M.C., Salvi S., Varesano S., Boccardo S., Vigani A., Morabito A., et al. CTLA-4 in mesothelioma patients: tissue expression, body fluid levels and possible relevance as a prognostic factor. Cancer Immunol. Immunother. 2016;65:909–917. doi: 10.1007/s00262-016-1844-3. - DOI - PMC - PubMed
    1. Erfani N., Razmkhah M., Ghaderi A. Circulating soluble CTLA4 (sCTLA4) is elevated in patients with breast cancer. Cancer Invest. 2010;28:828–832. doi: 10.3109/07357901003630934. - DOI - PubMed

MeSH terms