. 2024 Oct 3;187(20):5735-5752.e25.
doi: 10.1016/j.cell.2024.07.038. Epub 2024 Aug 20.

A genetic basis for sex differences in Xp11 translocation renal cell carcinoma

Affiliations

A genetic basis for sex differences in Xp11 translocation renal cell carcinoma

Mingkee Achom et al. Cell. .

Abstract

Xp11 translocation renal cell carcinoma (tRCC) is a rare, female-predominant cancer driven by a fusion between the transcription factor binding to IGHM enhancer 3 (TFE3) gene on chromosome Xp11.2 and a partner gene on either chromosome X (chrX) or an autosome. It remains unknown what types of rearrangements underlie TFE3 fusions, whether fusions can arise from both the active (chrXa) and inactive X (chrXi) chromosomes, and whether TFE3 fusions from chrXi translocations account for the female predominance of tRCC. To address these questions, we performed haplotype-specific analyses of chrX rearrangements in tRCC whole genomes. We show that TFE3 fusions universally arise as reciprocal translocations and that oncogenic TFE3 fusions can arise from chrXi:autosomal translocations. Female-specific chrXi:autosomal translocations result in a 2:1 female-to-male ratio of TFE3 fusions involving autosomal partner genes and account for the female predominance of tRCC. Our results highlight how X chromosome genetics constrains somatic chrX alterations and underlies cancer sex differences.

Keywords: MITF; TFE3; X chromosome; X inactivation; XIST; cancer genomics; cancer sex bias; gene fusions; kidney cancer; renal cell carcinoma; tRCC; translocation renal cell carcinoma.


Conflict of interest statement

Declaration of interests S.R.V. has consulted for Jnana Therapeutics within the past 3 years and receives research support from Bayer. C.-Z.Z. is a co-founder, consultant, and equity holder of Pillar Biosciences, a for-profit company specialized in assay development for targeted DNA sequencing. C.B. is currently an employee of Inocras Inc., a for-profit company specialized in whole-genome sequencing of cancer and rare diseases. T.K.C. reports institutional and/or personal, paid and/or unpaid support for research, advisory boards, consultancy, and/or honoraria past 5 years, ongoing or not, from Alkermes, Arcus Bio, AstraZeneca, Aravive, Aveo, Bayer, Bristol Myers Squibb, Calithera, Circle Pharma, Deciphera Pharmaceuticals, Eisai, EMD Serono, Exelixis, GlaxoSmithKline, Gilead, HiberCell, IQVA, Infinity, Ipsen, Jansen, Kanaph, Lilly, Merck, Nikang, Neomorph, Nuscan/PrecedeBio, Novartis, Oncohost, Pfizer, Roche, Sanofi/Aventis, Scholar Rock, Surface Oncology, Takeda, Tempest, Up-To-Date, CME events (Peerview, OncLive, MJH, CCO, and others), and outside the submitted work; has institutional patents filed on molecular alterations and immunotherapy response/toxicity and ctDNA; holds equity in Tempest, Pionyr, Osel, Precede Bio, CureResponse, InnDura Therapeutics, and Primium; and is on the committees of NCCN, GU Steering Committee, ASCO (BOD 6-2024-, ESMO, ACCRU, and KidneyCan (medical writing and editorial assistance support may have been funded by Communications companies in part); and has mentored several non-US citizens on research projects with potential funding (in part) from non-US sources/Foreign Components. The institution (Dana-Farber Cancer Institute) may have received additional independent funding of drug companies or/and royalties potentially involved in research around the subject matter. D.J.E. received research funding to institution from Bristol-Myers Squibb, Cardiff Oncology, MiNK Therapeutics, Novartis, Sanofi, and Puma. Discounted research sequencing from Foundation Medicine.

Figures
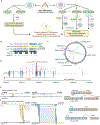
Figure 1:
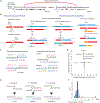
Figure 1:. Overview of TFE3 fusions in tRCC cohort.
(A) Study design. (B) Summary of tRCC cohort (see Table S1). (C-D) TFE3 fusion partners (C) and breakpoints (D) at the TFE3 locus in the tRCC cohort. Each fusion (one arc in C) and breakpoint (vertical line in D) is colored by sex. (E-F) Left: IGV snapshots of RNA-Seq reads showing an oncogenic fusion between ASPSCR1 (exons 1–7) and TFE3 (exons 6–10) in TRCC8 (E) and an oncogenic fusion between SFPQ (exons 1–6) and TFE3 (exons 2–10) in TRCC18 (F); right: Schematic diagram of the fusion transcript and the fusion gene sequence.
Figure 2:
Figure 2:. Etiology of TFE3 fusions revealed by whole-genome sequencing.
(A) Balanced DNA copy number across chrX and chr17 in TRCC14 (LUC7L3-TFE3 fusion). Fusion partners positions are marked by vertical lines and are joined by reciprocal translocations (red arcs), with allelic balance of both homologs as indicated by the complete overlap of black and gray dots corresponding to allele A and allele B copy number. (B) Rearrangement types giving rise to TFE3 fusions: (Left) Intra-chrX inversions: paracentric (inversion within the chrXp arm) and pericentric (inversion spanning the centromere). (Middle) Inter-chromosomal translocations. chrX:autosome translocations with partners on autosomal p-arm (e.g. SFPQ) or q-arm (e.g. PRCC); (Right) chromoplexy, i.e., balanced translocations between three or more pairs of break ends (see Table S2). (C) Sequence features of non-homologous end-joining at TFE3 and partner loci illustrated by the TFE3-RBM10 fusion in TRCC7. Left: minimum DNA loss or gain at each partner locus (no DNA loss or gain at the TFE3 breakpoint and 3bp deletion at the RBM10 breakpoint). Right: minimum homology or insertion at rearrangement junctions (2bp microhomology at the RBM10-TFE3 junction and 3 bp insertion at the TFE3-RBM10 junction). (D) Summary of DNA loss/gain at TFE3 and fusion partner loci and junction homology across the tRCC WGS cohort. The x- and y-axes indicate the number of duplicated (+) or deleted (−) nucleotides at breakpoints in TFE3 (y) and the TFE3 translocation partner (x). The upper right and lower left triangles of each square show the classification of microhomology or insertion at reciprocal junctions (Partner-TFE3 or TFE3-Partner). (E) Mechanisms that result in no change (i), deletion (ii), or duplication (iii) between opposite break ends generated by a double-strand break. (F) Histogram showing the length of microhomology (left) or insertion (right) at the junctions between TFE3 and Partner breakpoints (including both reciprocal junctions). An outlier with 24bp insertion at the TFE3-MED15 junction detected in TRCC10 was the only instance with a significant deletion at both TFE3 (27bp) and the partner (MED15, 6bp), potentially indicating microhomology-mediated end-joining.
Figure 3:
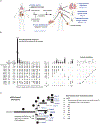
Figure 3:. Female predominance in chrX:autosome translocations underlies sex bias in tRCC.
(A) Sex-specific constraints on each class of chrX rearrangement leading to TFE3 fusions. (B) Summary of aggregate tRCC cohort assembled from 11 independent studies. Right, sex distribution of tRCC cases in the aggregate cohort (N = 203). (C) Sex disparity of chrX:autosome translocations and intra-chrX inversions resulting in oncogenic TFE3 fusions: chrX:autosome translocations display a 2:1 female-to-male ratio while intra-chrX inversions are enriched in males. The enrichment of intra-chrX inversions in males is largely attributed to RBM10-TFE3 fusions, which may be related to the higher mutation frequency of RBM10 in males. (D) Landscape of copy-number imbalance of chrX and TFE3 fusion partner chromosomes broken down by sex and rearrangement type. Copy number imbalance resulting from deletions on chrX (blue) is exclusive to females. Other types of copy number imbalance (green), including chrX gains and gains/losses of the partner chromosome are seen in both females and males. See Figure S4. (E) An example of copy-number imbalance due to deletion of the translocated chromosome der(X)t(1;X) containing the reciprocal TFE3 fusion. This example is a tRCC sample profiled via whole-exome sequencing in a previous study. Shown are the minor allele fraction (top) and normalized copy ratio (bottom) of tumor DNA. Data points in the deleted regions are orange.
Figure 4:
Figure 4:. tRCC evolution revealed by multiregional sequencing.
(A) Treatment history and anatomic sites of 14 tRCC samples from subject TRCC18. (B) Summary of truncal (left), shared (middle), and private (right) point mutations detected across all tumors. Presence/absence of mutations in each sample was determined by the mutant allele frequency (MAF) cutoff estimated from truncal mutations. See Methods and Figure S5 for more details. (C) Phylogenetic tree of metastatic lesions inferred from shared mutations in (B). Two samples inferred to have near tetraploid genomes (Liver-4 and MedLN) are underlined. Each mutation was assigned to a branch (a-k) based on the maximum likelihood calculated from a constant false positive rate (0.01) and sample-specific false negative rate estimated as described in Figure S5, with the final mutational burden shown on the right. Note that the three groups of mutations assigned to branch b in panel B are almost all due to the downstream deletion of der(X)t(1;X) in the Lung metastases and in RPLN-2; these lost mutations are ancestral. Similar patterns of mutations were found on chr4, chr11, and chr22 that are deleted in MedLN/Liver-4, Lung, and RPLN-2/RPLN-3 samples. See Table S6 for details about mutation assignment considering DNA deletions and losses.
Figure 5:
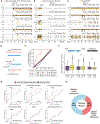
Figure 5:. Deletions and losses of der(X)t(1;X) in metastases from TRCC18 indicate that the TFE3 fusion arose via a chr1:chrXi translocation.
(A) Summary of ancestral copy-number alterations and rearrangements in all tumor biopsies using data from Liver-2. Left: CIRCOS plot showing haplotype-specific DNA copy number (blue and red) and rearrangements (green for intra-chromosomal, purple for inter-chromosomal), for chromosomes with copy number alterations or rearrangements. The reciprocal chr1:chrX translocations are highlighted as a thick magenta line. Right: Distributions of allelic depths of chromosomes with altered DNA copy number (chrs.6,8,9,14,17, and 18). ‘A’ refers to the homolog with altered DNA copy number and ‘B’ to the intact homolog; for chr9, the A homolog shows focal deletions and the B homolog undergoes complete deletion. The allelic depths of the deleted 9B homolog (CN=0), the gained 8A homolog (CN=2), and regions with normal DNA copy number (CN=1) determine the integer copy-number states and the clonal fractions of subclonal copy-number alterations (e.g., a minor subclonal loss of the 4B homolog in the Liver-2 sample). See Figure S6 for other instances of copy-number evolution in this case. (B-D) CIRCOS and allelic-depth distribution plots of selected chromosomes showing downstream evolution after ancestral alterations shown in A. (B) Lung-1 (shown as the representative of all three lung metastases) displays a near clonal deletion of most of der(X)t(1;X) (see Figure S6E), a near clonal deletion of 22A, and gains of 17A and 18A. (C) MedLN (shown as the representative of MedLN and Liver-4) is inferred to be near tetraploid (4N) based on the presence of 4A, 7A, and 11A at the median copy-number state (CN=1) between 22A (CN=0) and the basal copy-number state (allelic depth=1; CN=2). Based on this inference, der(X)t(1;X) underwent whole-chromosome loss after whole-genome duplication. (D) RPLN-2 has several chromosomes (4A, 13A, 20A, 22A) showing non-integer copy-number states. Although we cannot determine the number of subclones or their ploidy states, the mean allelic depths of der(X)t(1;X), 4A, and the p-arm of 20A are all below the median between complete deletion (CN=0 inferred from 9B) and the basal copy number state (CN=1 in 2N genomes or CN=2 in 4N genomes); this reduction cannot be solely attributed to chromosome losses after whole-genome duplication, but implies complete chromosome deletion in one or more subclones. (E) Box plots of allelic fractions of somatic mutations on chrXq in all metastatic biopsies. Each mutation is phased to either the retained (open boxes) or the deleted (filled boxes) homolog based on their allelic fractions in all samples (Figure S5D). The Lung-1 and Lung-3 samples show complete deletion of mutations on the deleted homolog. Liver-4 and MedLN show lower allelic fractions of these mutations consistent with losses but not deletion; the 2:1 ratio of the average allelic fraction of mutations on the retained versus those on the deleted homolog is also consistent with the 2:1 copy-number ratio between the two homologs. Lung-2 and RPLN-2 are both polyclonal. The mean allelic fraction of mutations in each sample is consistent with the clonal fraction of tumor cells estimated from the allelic depth of 9B that is inferred to be deleted in the founding clone. The ratio between the average allelic fraction of mutations on the retained versus those on the deleted homolog in MedLN and Liver-4 is also consistent with a 2:1 copy-number ratio between the two homologs.
Figure 6:
Figure 6:. chrXi:autosome translocations can lead to autosomal silencing and chrXi reactivation.
(A-C) Haplotype-specific transcription of chrX (A), chr1 (B), and chr7 (C) in the primary tumor and the Liver-2 metastasis of TRCC18. The first row shows allelic imbalance in Lung-1 (chrX) and MedLN (chr1 and chr7) that was used to determine the haplotype phase of these chromosomes. Rows 2 and 3 show the phased DNA allelic depths and RNA allelic fractions in the primary tumor; rows 4 and 5 show the DNA allelic depths and RNA allelic fractions in the Liver-2 metastasis. Note that the monoallelic expression on chrXq establishes HapA (altered homolog) as chrXi and this is further corroborated by the monoallelic expression of XIST solely from chrXi. Allelic imbalance telomeric to the SFPQ locus in chr1 indicates silencing of the A homolog that is in cis with XIC on the translocated chrXi (P=1.2e-2 in the primary and P=1.78e-5 in Liver-2 by a Mann-Whitney test comparing the allelic fractions of transcripts on either side of the breakpoint). Biallelic transcription of chr7 serves as a negative control. (D) Predicted transcriptional consequences of chrXi:autosome translocations. (E) Partial reactivation of chrXi expression revealed by an increase in biallelic Xp expression. Shown are the cumulative fractions of biallelically expressed polymorphic sites in comparison to the cumulative fractions of all polymorphic sites on all disomic chromosomes (from p-terminus to q-terminus). (F) Partial reactivation of chrXi expression inferred by an increase in total transcriptional output in tumor cells, as assessed by single nucleus RNA sequencing. Shown is the average ratio of transcripts in tumor nuclei (N=4118) relative to normal nuclei (N=172) from the TRCC18 primary tumor in different chromosomal regions. A statistically significant difference is only observed for the Xp region that is telomeric to the breakpoint (P = 6.3e-3; Mann-Whitney U test) but not the Xq region (P = 0.48) or disomic autosomes (P = 0.79). (G) Additional examples of chrXi reactivation inferred from increased biallelic expression of genes telomeric to the TFE3 breakpoint. Shown are the cumulative fractions of biallelically expressed heterozygous genotypes (red) and of all heterozygous sites in expressed genes (black) on chrX for selected female samples of the following categories: (top row) three tRCC samples with autosome-TFE3 fusions and chrXp reactivation (P < 0.05 by Mann-Whitney U test); (bottom row from left to right) a tRCC sample, a ccRCC sample, and a tRCC cancer-adjacent normal sample, all showing no evidence of reactivation (P > 0.05). See Figure S7 for additional examples. (H) Summary of 15 female tRCC samples with or without biallelic chrXp expression as assessed by RNA-Seq.

Update of

References

    1. Zhuang W, Liu N, Guo H, Zhang C, and Gan W (2020). Gender difference analysis of Xp11.2 translocation renal cell carcinomas’s attack rate: a meta-analysis and systematic review. BMC Urol 20, 130. 10.1186/s12894-020-00696-1. - DOI - PMC - PubMed
    1. Argani P (2015). MiT family translocation renal cell carcinoma. Seminars in Diagnostic Pathology 32, 103–113. 10.1053/j.semdp.2015.02.003. - DOI - PubMed
    1. Choueiri TK, Lim ZD, Hirsch MS, Tamboli P, Jonasch E, McDermott DF, Dal Cin P, Corn P, Vaishampayan U, Heng DYC, et al. (2010). Vascular endothelial growth factor-targeted therapy for the treatment of adult metastatic Xp11.2 translocation renal cell carcinoma. Cancer 116, 5219–5225. 10.1002/cncr.25512. - DOI - PMC - PubMed
    1. Malouf GG, Camparo P, Oudard S, Schleiermacher G, Theodore C, Rustine A, Dutcher J, Billemont B, Rixe O, Bompas E, et al. (2010). Targeted agents in metastatic Xp11 translocation/TFE3 gene fusion renal cell carcinoma (RCC): a report from the Juvenile RCC Network. Ann Oncol 21, 1834–1838. 10.1093/annonc/mdq029. - DOI - PubMed
    1. Boilève A, Carlo MI, Barthélémy P, Oudard S, Borchiellini D, Voss MH, George S, Chevreau C, Landman-Parker J, Tabone M-D, et al. (2018). Immune checkpoint inhibitors in MITF family translocation renal cell carcinomas and genetic correlates of exceptional responders. j. immunotherapy cancer 6, 159. 10.1186/s40425-018-0482-z. - DOI - PMC - PubMed

MeSH terms

Substances

LinkOut - more resources