. 2024 Dec;1871(8):119818.
doi: 10.1016/j.bbamcr.2024.119818. Epub 2024 Aug 19.

Transcriptomic analysis of BM-MSCs identified EGR1 as a transcription factor to fully exploit their therapeutic potential

Affiliations

Transcriptomic analysis of BM-MSCs identified EGR1 as a transcription factor to fully exploit their therapeutic potential

Ludovica Santi et al. Biochim Biophys Acta Mol Cell Res. 2024 Dec.

Abstract

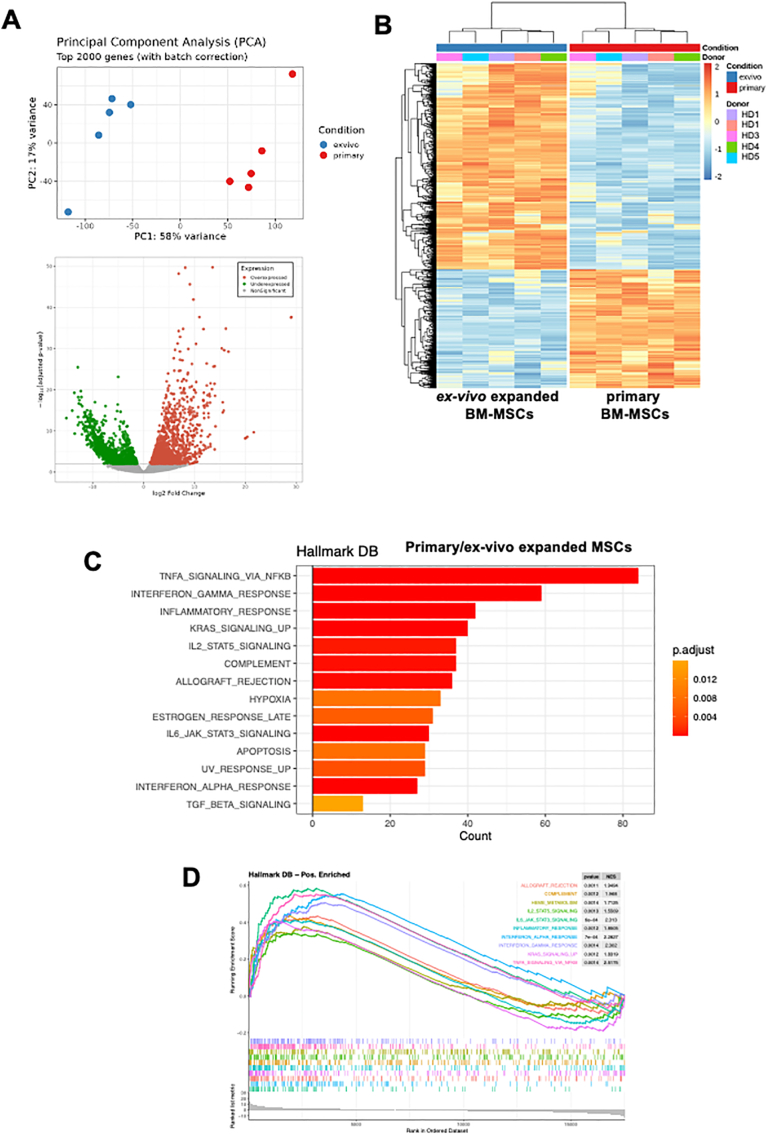
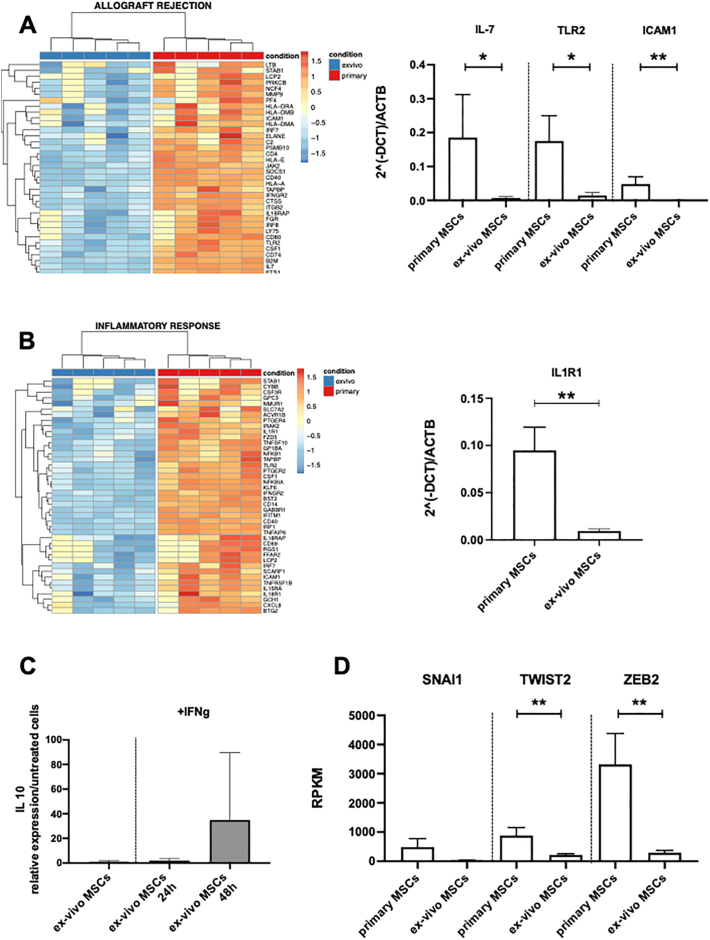
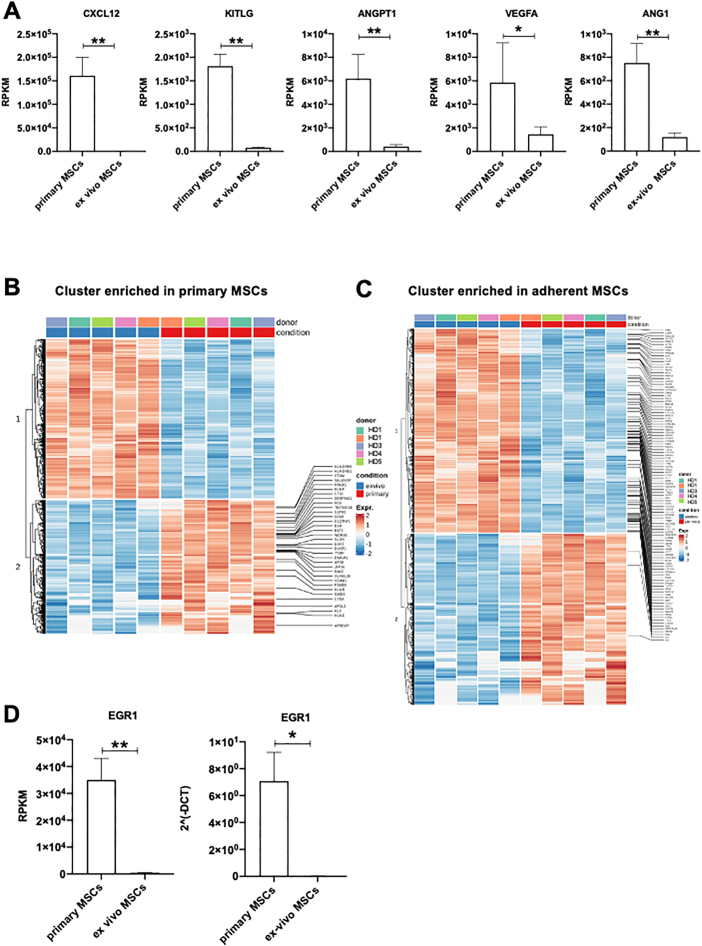
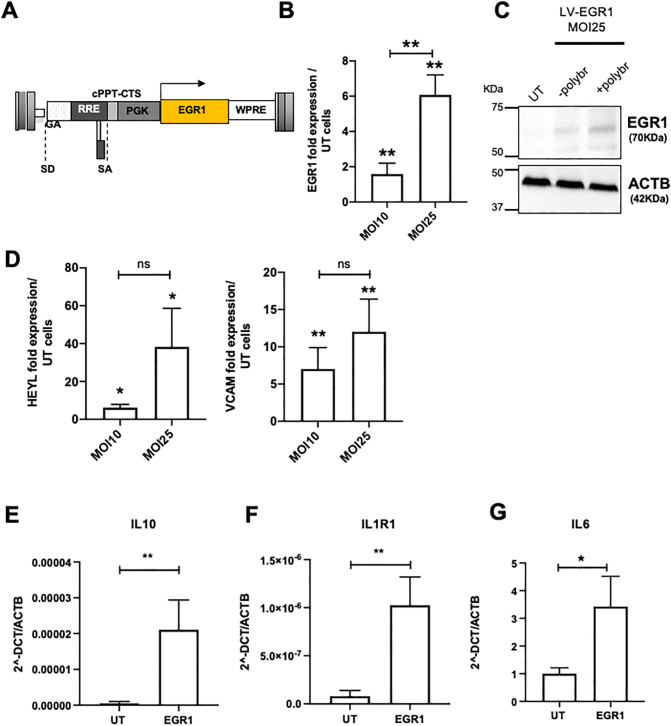
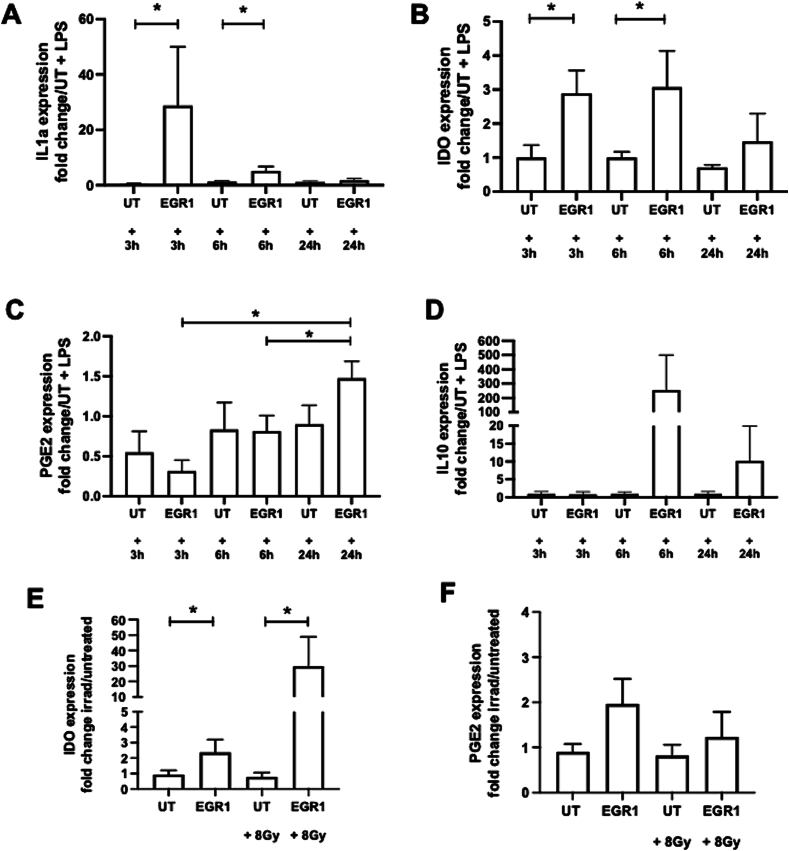
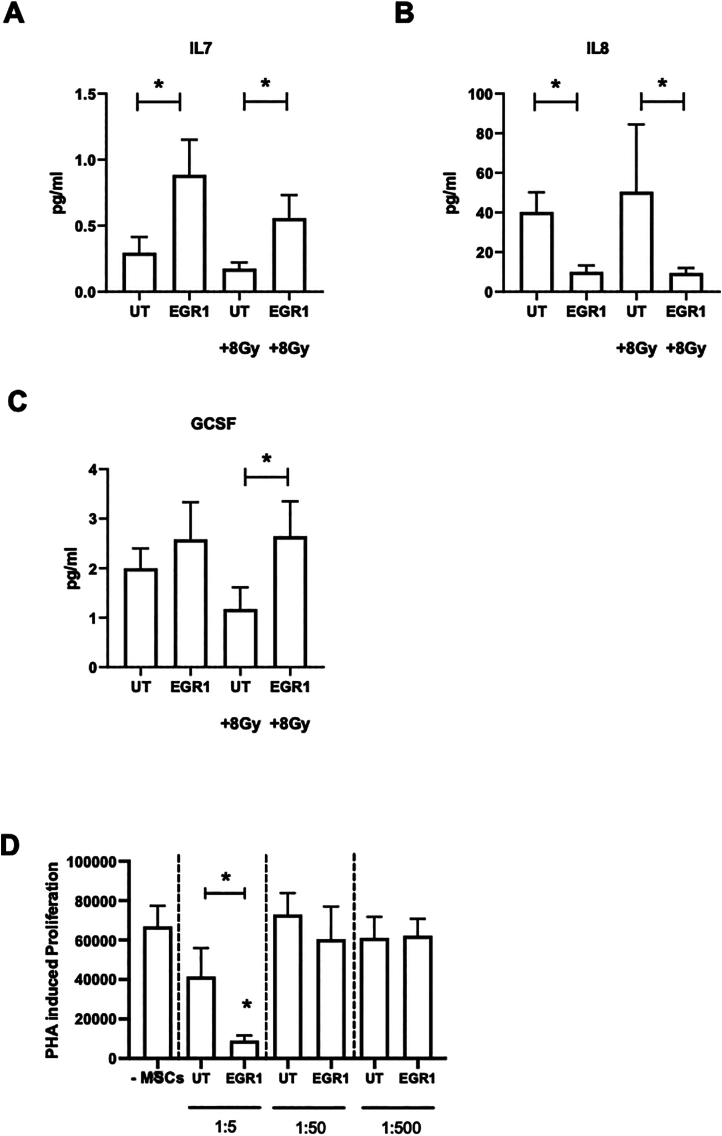
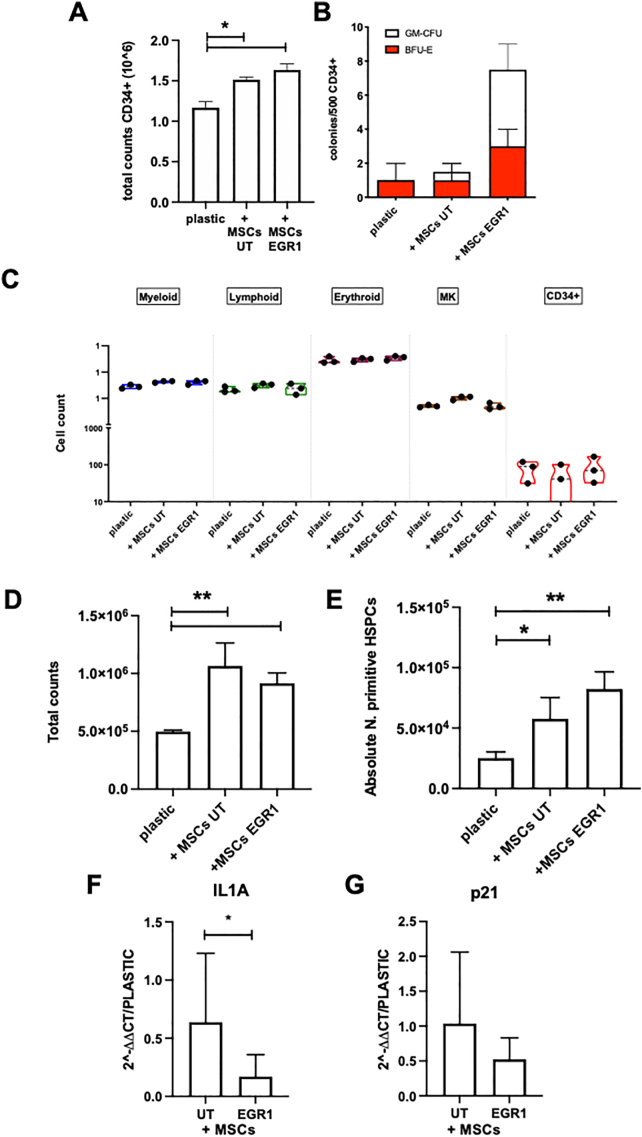
Bone marrow-mesenchymal stromal cells (BM-MSCs) are key components of the BM niche, where they regulate hematopoietic stem progenitor cell (HSPC) homeostasis by direct contact and secreting soluble factors. BM-MSCs also protect the BM niche from excessive inflammation by releasing anti-inflammatory factors and modulating immune cell activity. Thanks to these properties, BM-MSCs were successfully employed in pre-clinical HSPC transplantation models, increasing the rate of HSPC engraftment, accelerating the hematological reconstitution, and reducing the risk of graft failure. However, their clinical use requires extensive in vitro expansion, potentially altering their biological and functional properties. In this work, we analyzed the transcriptomic profile of human BM-MSCs sorted as CD45-, CD105+, CD73+, and CD90+ cells from the BM aspirates of heathy-donors and corresponding ex-vivo expanded BM-MSCs. We found the expression of immune and inflammatory genes downregulated upon cell culture and selected the transcription factor EGR1 to restore the MSC properties. We overexpressed EGR1 in BM-MSCs and performed in vitro tests to study the functional properties of EGR1-overexpressing BM-MSCs. We concluded that EGR1 increased the MSC response to inflammatory stimuli and immune cell control and potentiated the MSC hematopoietic supportive activity in co-culture assay, suggesting that the EGR1-based reprogramming may improve the BM-MSC clinical use.

Keywords: Anti-inflammatory response; Bone marrow-mesenchymal stromal cells (BM-MSCs); Hematopoietic support; MSC reprogramming; Transcriptomic analysis.


Conflict of interest statement

Declaration of competing interest The authors declare no conflicts of interest.

Figures

Fig. 1
Fig. 1
Exploratory analysis of transcriptomic changes in BM-MSCs upon ex-vivo expansion. A) Principal Component Analysis (PCA) of RNA-seq sample, colored by condition: ex-vivo (blue) and primary (red) MSCs (upper panel). Volcano plot showing the modulated gene expression of primary and ex-vivo expanded BM-MSCs (lower panel). B) Heatmap showing the expression of the differentially expressed genes (FDR < 0.01) in the comparison between primary and ex-vivo samples. Genes (rows) and samples (columns) are clustered in an unsupervised way. C) Barplot showing the significant enriched categories (adj. p-value <0.05) from the Hallmark MSigDB on upregulated genes. Terms on the y-axis are sorted according to the gene count (x-axis), while bars are colored by adj. p-value. D) Random walk plots of the significant categories from the Hallmark MSigDB, resulting from the GSEA.
Fig. 2
Fig. 2
Specific analysis of biological pathways differentially utilized by BM-MSCs upon in vitro expansion. A) Heatmap showing the expression of the genes belonging the core-enrichment of the allograft rejection category from the enrichment analysis on the Hallmark MSigDB, in which genes (rows) and samples (columns) are clustered in an unsupervised way (left). On the right panel, qPCR expression analysis of IL7, TLR2, and ICAM1 in primary and ex-vivo BM-MSCs. Gene expression was calculated as 2^-DCT over the ACTB gene. Each error bar shows means ± SEM (n ≥ 4). (*p ≤ 0.05; ** p ≤ 0.01). B) Heatmap showing the expression of the genes belonging the core-enrichment of the inflammatory response category from the enrichment analysis on the Hallmark MSigDB, in which genes (rows) and samples (columns) are clustered in an unsupervised way (left). On the right panel qPCR expression analysis of IL1R1 in primary and ex-vivo BM-MSCs. Gene expression was calculated as 2^-DCT over the ACTB gene. Each error bar shows means ± SEM (n ≥ 4). (** p ≤ 0.01). C) qPCR expression analysis of IL10 in ex-vivo BM-MSCs at basal level and upon treatment with IFNgamma for 24 and 48 h. Data are expressed as fold change over untreated BM-MSCs. DCT was calculated as Ct gene-Ct ACTB gene. Each error bar shows means ± SEM (n ≥ 4). D) Reads Per Kilobase Million (RPKM) of SNAI1, TWIST2, and ZEB2 in primary and ex-vivo BM-MSCs. Each error bar shows means ± SEM (n ≥ 4) (** p ≤ 0.01).
Fig. 3
Fig. 3
Expression analysis of the hematopoietic supportive genes in ex-vivo expanded BM-MSCs compared to primary BM-MSCs. A) Values of Reads Per Kilobase Million (RPKM) of the hematopoietic supportive genes CXCL12, KITL, ANGPT1, VEGFA, and ANG1 in primary and ex-vivo BM-MSCs. Each error bar shows means ± SEM (n ≥ 4) (*p ≤ 0.05; ** p ≤ 0.01). B) Heatmaps showing the expression of the differentially expressed genes (FDR < 0.01) in the comparison between primary and ex-vivo samples, highlighting genes from the cluster enriched in primary (left) and adherent (right) MSCs from (36). Genes (rows) and samples (columns) are clustered in an unsupervised way. C) Values of Reads Per Kilobase Million (RPKM) and D) qPCR expression analysis of EGR1 gene calculated as 2^-DCT over ACTB in primary and ex-vivo BM-MSCs (right panel). Each error bar shows means ± SEM (n ≥ 4) (*p ≤ 0.05; ** p ≤ 0.01).
Fig. 4
Fig. 4
In vitro analysis of EGR1 overexpressing BM-MSCs A) Schematic representation of the third-generation lentiviral vector bearing the EGR1 human transgene (LV-EGR1) under the control of the PGK promoter used to transduce ex-vivo expanded BM-MSCs at different MOIs (10, 25). B) qPCR analysis of EGR1 expression in untransduced and LV-EGR1 transduced BM-MSCs. Each error bar shows means ± SEM (n ≥ 4) (** p ≤ 0.01). Data are represented as fold change over untransduced cells. DCT was calculated as Ct gene - Ct ACTB gene. C) Western blot analysis of EGR1 expression in the protein extract from BM-MSCs transduced with the LV-EGR1 at an MOI of 25 in the presence/absence of polybrene. The protein extract from untransduced cells was used as a control. ACTB protein expression was evaluated as a reference. D) Expression analysis of the EGR1 target genes, HEYL and VCAM, in BM-MSCs transduced with the LV-EGR1 at an MOI of 10 and 25. Each error bar shows means ± SEM (n ≥ 4). (*p ≤ 0.05; ** p ≤ 0.01). E-G) Expression analysis of the IL10 (E), IL1R1 (F), and IL6 (G) genes in BM-MSCs transduced with the LV-EGR1 at an MOI of 25. Untransduced cells were used as controls. Each error bar shows means ± SEM (n ≥ 4). Data are represented as 2^-DCT, with DCT calculated as Ct gene - Ct GAPDH (*p ≤ 0.05; ** p ≤ 0.01).
Fig. 5
Fig. 5
EGR1 overexpressing BM-MSCs showed superior anti-inflammatory and immunomodulatory properties. (A-D) qPCR expression analysis of IL1 A (A), IDO (B), PGE2 (C), and IL10 (D) in untransduced (UT) and LV-EGR1 transduced BM-MSCs upon treatment with LPS (1μg/ml) for 3–6-24 h. E, F) qPCR expression analysis of IDO (E) and PGE2 (F) in untransduced (UT) and EGR1 overexpressing BM-MSCs irradiated in vitro with a dose of 8Gy. In all panels, results are shown as fold change over untransduced cells. DCT was calculated as Ct gene – Ct GAPDH. Each error bar shows mean ± SEM (n ≥ 4). (*p ≤ 0.05; ** p ≤ 0.01).
Fig. 6
Fig. 6
Immunomodulatory function of EGR1 overexpressing BM-MSCs. The levels IL-7 (A), IL-8 (B) and G-CSF (C) were determined in the cell supernatant from untransduced and EGR1 overexpressing BM-MSCs cultured for 48 h and after in vitro irradiation with a dose of 8Gy (48 h after treatment) using Luminex technology. Each error bar shows means ± SEM (n ≥ 3). (*p ≤ 0.05). (D) PHA-induced lymphocyte proliferation assay on lymphocyte from healthy donors in the presence of different doses (1:5, 1:50, and 1:500) of untransduced and LV-EGR1 transduced BM-MSCs. Lymphocytes stimulated in the absence of BM-MSCs were used as controls. Each error bar shows means ± SEM (n ≥ 4).
Fig. 7
Fig. 7
Evaluation of the hematopoietic supportive properties in EGR1 overexpressing BM-MSCs. A, B) Total counts of CD34+ cells (A) and clonogenic assay (B) after 72-h culture on BM-MSC feeders (untransduced or LV-EGR1 transduced BM-MSCs). CD34+ cells maintained in culture on plastic dishes were evaluated as controls. Each error bar shows means ± SEM (n ≥ 4).(*p ≤ 0.05). C) Single-cell differentiation assay performed on CD34+ cells maintained in culture on plastic dishes or on BM-MSC feeders (untransduced or LV-EGR1 transduced BM-MSCs). D, E) Gene-editing CD34+ cells from mobilized peripheral blood were recovered in culture for 72 h on plastic dishes or on BM-MSC feeders. Total CD34+ cell counts (D) and absolute number of CD34+ with a phenotypically primitive phenotype (E) were determined. F, G) qPCR expression analysis of IL-1A (F) and p21 (G) in gene-edited mPB human HSPCs recovered in culture on untransduced or EGR1 overexpressing BM-MSCs. Data show the expression fold change over gene-edited cells maintained in culture on plastic dishes. In all panels, each error bar shows means ± SEM (n ≥ 4). (*p ≤ 0.05; ** p ≤ 0.01).
Unlabelled Image

Similar articles

Cited by

References

    1. Crane G.M., Jeffery E., Morrison S.J. Adult haematopoietic stem cell niches. Nat. Rev. Immunol. 2017;17:573–590. doi: 10.1038/nri.2017.53. - DOI - PubMed
    1. Morrison S.J., Scadden D.T. The bone marrow niche for haematopoietic stem cells. Nature. 2014;505:327–334. doi: 10.1038/nature12984. - DOI - PMC - PubMed
    1. Comazzetto S., Shen B., Morrison S.J. Niches that regulate stem cells and hematopoiesis in adult bone marrow. Dev. Cell. 2021;56:1848–1860. doi: 10.1016/j.devcel.2021.05.018. - DOI - PMC - PubMed
    1. Li T., Wu Y. Paracrine molecules of mesenchymal stem cells for hematopoietic stem cell niche. Bone Marrow Res. 2011;2011 doi: 10.1155/2011/353878. - DOI - PMC - PubMed
    1. Michigami T., Shimizu N., Williams P.J., Niewolna M., Dallas S.L., Mundy G.R., Yoneda T. Cell-cell contact between marrow stromal cells and myeloma cells via VCAM-1 and alpha(4)beta(1)-integrin enhances production of osteoclast-stimulating activity. Blood. 2000;96:1953–1960. - PubMed

Publication types

MeSH terms

Substances

LinkOut - more resources