. 2024 Sep 25;44(39):e0701242024.
doi: 10.1523/JNEUROSCI.0701-24.2024.

GAP43 Located on Corticostriatal Terminals Restrains Novelty-Induced Hyperactivity in Mice

Affiliations

GAP43 Located on Corticostriatal Terminals Restrains Novelty-Induced Hyperactivity in Mice

Irene B Maroto et al. J Neurosci. .

Abstract

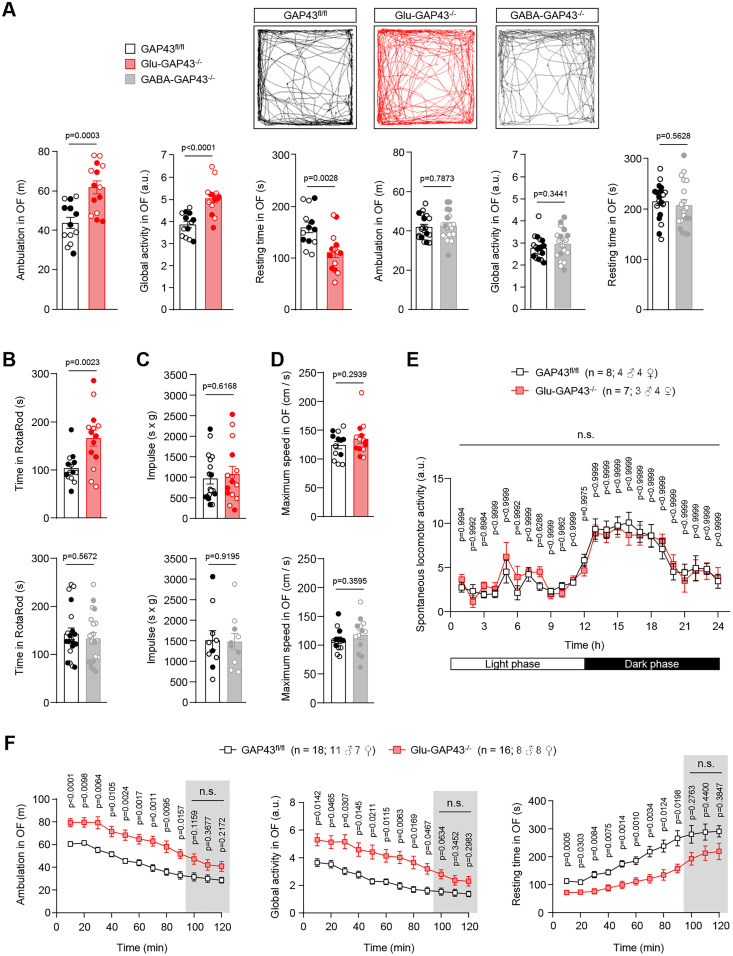
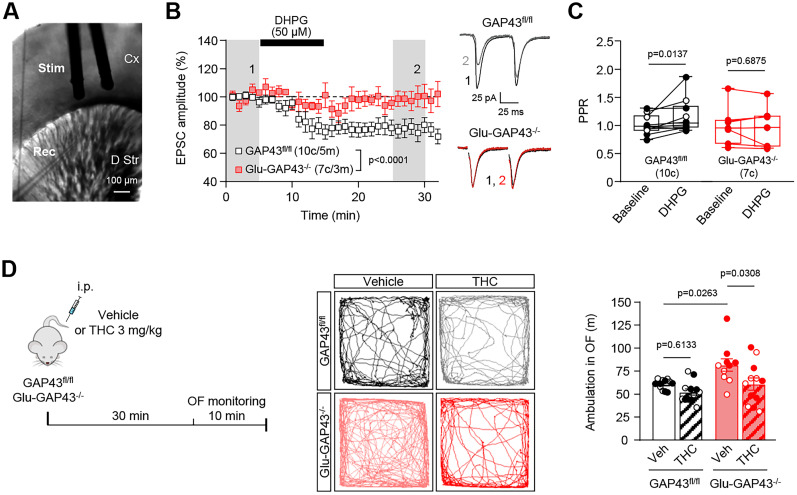
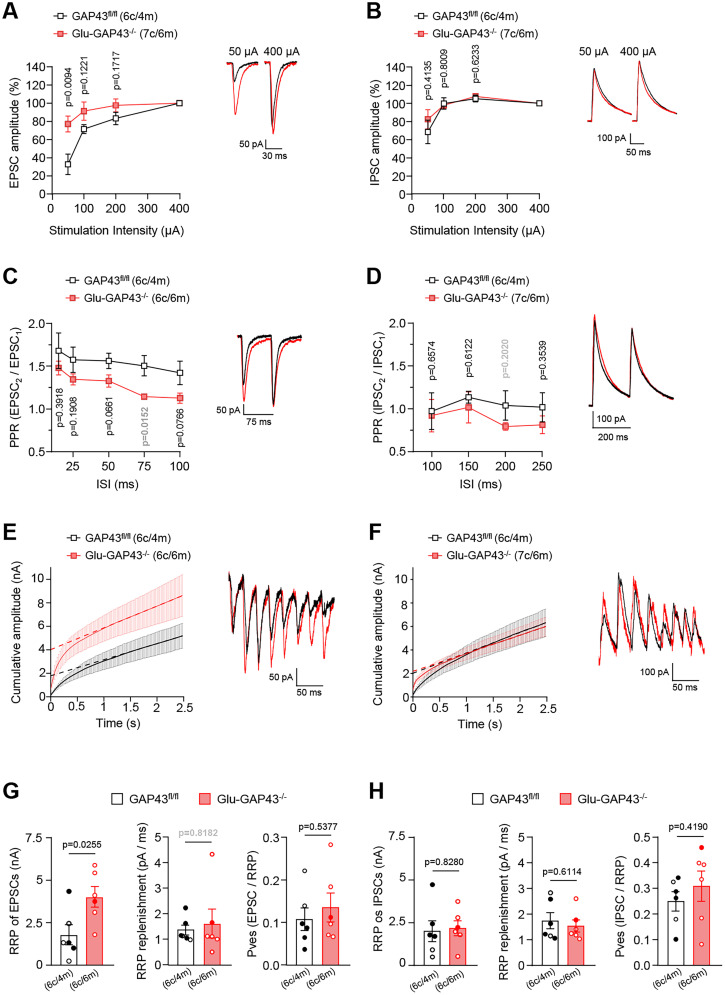
Growth-associated protein of 43 kDa (GAP43) is a key cytoskeleton-associated component of the presynaptic terminal that facilitates neuroplasticity. Downregulation of GAP43 expression has been associated to various psychiatric conditions in humans and evokes hippocampus-dependent memory impairments in mice. Despite the extensive studies conducted on hippocampal GAP43 in past decades, however, very little is known about its roles in modulating the excitatory versus inhibitory balance in other brain regions. We recently generated conditional knock-out mice in which the Gap43 gene was selectively inactivated in either telencephalic glutamatergic neurons (Gap43fl/fl ;Nex1Cre mice, hereafter Glu-GAP43-/- mice) or forebrain GABAergic neurons (Gap43fl/fl ;Dlx5/6Cre mice, hereafter GABA-GAP43-/- mice). Here, we show that Glu-GAP43-/- but not GABA-GAP43-/- mice of either sex show a striking hyperactive phenotype when exposed to a novel environment. This behavioral alteration of Glu-GAP43-/- mice was linked to a selective activation of dorsal-striatum neurons, as well as to an enhanced corticostriatal glutamatergic transmission and an abrogation of corticostriatal endocannabinoid-mediated long-term depression. In line with these observations, GAP43 was abundantly expressed in corticostriatal glutamatergic terminals of wild-type mice. The novelty-induced hyperactive phenotype of Glu-GAP43-/- mice was abrogated by chemogenetically inhibiting corticostriatal afferences with a Gi-coupled "designer receptor exclusively activated by designer drugs" (DREADDs), thus further supporting that novelty-induced activity is controlled by GAP43 at corticostriatal excitatory projections. Taken together, these findings show an unprecedented regulatory role of GAP43 in the corticostriatal circuitry and provide a new mouse model with a delimited neuronal-circuit alteration for studying novelty-induced hyperactivity, a phenotypic shortfall that occurs in diverse psychiatric diseases.

Keywords: GAP43; cannabinoid; corticostriatal circuitry; glutamatergic transmission; long-term depression; motor activity.


Conflict of interest statement

The authors declare no competing financial interests.

Figures

Figure 1.
Figure 1.
Glu-GAP43−/− mice show novelty-induced hyperactivity. A, Ambulation (total distance traveled, m), global activity (a.u.), and resting time (s) in a 10 min open-field (OF) test in Glu-GAP43−/− mice and their GAP43fl/fl littermates (left) and in GABA-GAP43−/− mice and their GAP43fl/fl littermates (right). Representative trajectory maps for each genotype are shown (means ± SEM; n = 13–19 mice per group; males, empty circles; females, filled circles; p values obtained by unpaired Student's t test). B, RotaRod performance (time to fall, s) in the different genotypes (means ± SEM, n = 14–20 mice per group; males, empty circles; females, filled circles; p values obtained by unpaired Student's t test). C, Holding impulse assessing muscle function and coordination (hanging time in s × body weight in g) in the different genotypes (means ± SEM, n = 10–18 mice per group; males, empty circles; females, filled circles; p values obtained by unpaired Student's t test). D, Maximum speed (cm/s) in the OF test in the different genotypes (means ± SEM, n = 13–14 mice per group; males, empty circles; females, filled circles; p values obtained by unpaired Student's t test). E, In-home cage spontaneous locomotor activity in the different genotypes over a 24 h light/dark period (means ± SEM; n = 7–8 mice per group; number of males and females indicated in the figure; p values obtained by two-way ANOVA with Sidak's multiple-comparisons test). F, Ambulation (total distance traveled, m), global activity (a.u.), and resting time (s) in Glu-GAP43−/− mice and their GAP43fl/fl littermates over a 2 h period in an OF. The differences in the three parameters disappeared in the last 30 min, as highlighted by the shaded areas (means ± SEM; n = 16–18 mice per group; n of males and females is indicated; p values obtained by two-way ANOVA with Sidak's multiple-comparisons test).
Figure 2.
Figure 2.
Glu-GAP43−/− mice show alterations in other hyperactivity-associated behavioral parameters. A, Percentage of spontaneous alternation (left) and total number of arm entries (right) in Glu-GAP43−/− mice and their GAP43fl/fl littermates and in GABA-GAP43−/− mice and their GAP43fl/fl littermates (means ± SEM, n = 14–18 mice per group; males, empty circles; females, filled circles; p values obtained by one-sample t test or unpaired Student's t test). B, Anxiety-like behavior expressed as normalized entries to the center of the arena in the open-field (OF) test in Glu-GAP43−/− mice and their GAP43fl/fl littermates (top) and GABA-GAP43−/− mice and their GAP43fl/fl littermates (bottom; means ± SEM, n = 19–22 mice per group; males, empty circles; females, filled circles; p values obtained by unpaired Student's t test). C, D, Sociability (C), expressed as the preference for Subject 1 (S1) over an empty cage (E), and social novelty preference (D), expressed as the preference for a new Subject 2 (S2) over a familiar S1, in Glu-GAP43−/− mice and their GAP43fl/fl littermates (top), and GABA-GAP43−/− mice and their GAP43fl/fl littermates (bottom, means ± SEM, n = 8–12 mice per group; males, empty circles; females, filled circles; p values obtained by one-way ANOVA with Tukey's multiple-comparisons test).
Figure 3.
Figure 3.
Glu-GAP43−/− mice show a striatal-neuron overactivation upon exposure to a novel environment. A, c-Fos immunostaining in the brain is shown in representative brain slices from GAP43fl/fl and Glu-GAP43−/− mice, either naive or after a novel open-field (OF) exposure. The brain regions in which c-Fos-immunopositive cells were analyzed are delimited with a solid white line. B, Left, Black dashed-line boxes on representative brain coronal hemi-sections delimiting the regional location of the high-magnification insets shown. Image credit: Allen Institute. Right, Representative c-Fos high-magnification immunofluorescence images of each analyzed region. C, Quantification of the number of c-Fos-positive cells/mm2 in each of the analyzed areas (means ± SEM, n = 9–14 mice per group; males, empty circles; females, filled circles; p values obtained by two-way ANOVA with Tukey's multiple-comparisons test). PF Cx, prefrontal cortex; M Cx, motor cortex; Ss Cx, somatosensory cortex; D Str, dorsal striatum; Acc, nucleus accumbens; Amy, amygdala; CA1, cornu ammonis 1; CA3, cornu ammonis 3; DG, dentate gyrus.
Figure 4.
Figure 4.
GAP43 is highly expressed in corticostriatal terminals of the mouse brain. A, Top, Expression of GAP43 mRNA (in red) in the brain of GAP43fl/fl, GABA-GAP43−/−, and Glu-GAP43−/− mice. Nuclei were stained with DAPI (blue). The dotted line depicts the high-magnification inset shown aside. Representative images are shown. Bottom, Quantification of GAP43 mRNA levels in the cortex, dorsal striatum, hippocampal granular cell layer, and hilus of the hippocampal dentate gyrus (means ± SEM; n = 4–5 mice per group; males, empty circles; females, filled circles; p values obtained by one-way ANOVA with Tukey's multiple-comparisons test). B, Representative Western blots of GAP43, vGluT1, PSD95 and vGAT proteins in the cortex and dorsal striatum of GAP43fl/fl, GABA-GAP43−/−, and Glu-GAP43−/− mice. Quantification of normalized optical density values of each protein relative to those of the loading control are shown below each representative blot (means ± SEM; n = 4–6 mice per group; males, empty circles; females, filled circles; p values obtained by one-way ANOVA with Tukey's multiple-comparisons test). C, Left, Representative images of GAP43 and vGluT1 immunolocalization in the dorsal striatum of GAP43fl/fl, GABA-GAP43−/−, and Glu-GAP43−/− mice. Filled arrowheads point to representative colocalizing boutons, and empty arrowheads point to representative noncolocalizing boutons. Right, Quantification of GAP43 immunoreactivity and GAP43/vGluT1-colocalizing area in the dorsal striatum (means ± SEM; n = 3–4 mice per group; males, empty circles; females, filled circles; p values obtained by one-way ANOVA with Tukey's multiple-comparisons test). M Cx, motor cortex; D Str, dorsal striatum; GCL, granule cell layer; Hil, hilus; I-VI, cortical layers I to VI. See Extended Data Figure 4-1 for more details.
Figure 5.
Figure 5.
Glu-GAP43−/− mice show an abrogation of corticostriatal endocannabinoid-mediated long-term depression. A, Representative infrared differential interference contrast (DIC) image of a coronal corticostriatal slice showing the position of the stimulating electrode (Stim) and the recording electrode (Rec). Cx, cortex; D Str, dorsal striatum. B, EPSCs recorded from MSNs of the dorsal striatum in whole-cell patch-clamp configuration upon DHPG bath application (50 μM, 10 min). Left, Time course summary plot of EPSC amplitudes, before and after DHPG bath application, in Glu-GAP43−/− and GAP43fl/fl mice (means ± SEM, c, cells; m, mice; shaded areas indicate the time intervals at which the statistical analysis was conducted; p values obtained by paired Student's t test for DHPG vs baseline or by unpaired Student's t test for Glu-GAP43−/− vs GAP43fl/fl mice). Right, Representative EPSC traces. C, Quantification of PPR before (baseline) and after DHPG application in GAP43fl/fl and Glu-GAP43−/− mice (means ± SEM; c, cells; males, empty circles; females, filled circles; p values obtained by Wilcoxon's signed-rank test). D, GAP43fl/fl and Glu-GAP43−/− mice were injected intraperitoneally with vehicle or THC (3 mg/kg), and 30 min later locomotor activity was analyzed (left). Representative trajectory maps of each condition (middle) together with ambulation (total distance traveled, m) in a 10 min open-field (OF) test (right; means ± SEM; n = 10–12 mice per group; males, empty circles; females, filled circles; p values obtained by two-way ANOVA with Tukey's multiple-comparisons test). See Extended Data Figure 5-1 for more details.
Figure 6.
Figure 6.
Glu-GAP43−/− mice show an enhanced glutamatergic transmission at corticostriatal terminals. A, B, EPSC (A) and IPSC (B) amplitude recorded in the dorsal striatum upon increasing stimulation intensities. Left, Summary plot in Glu-GAP43−/− and GAP43fl/fl mice (means ± SEM, c, cells; m, mice; p values obtained by unpaired Student's t test). Right, Representative EPSC and IPSC traces obtained averaging 10 consecutive stimuli delivered at 0.2 Hz. C, D, PPR of the EPSCs (C) and IPSCs (D) in GAP43fl/fl and Glu-GAP43−/− mice at increasing interstimulus intervals (ISI). Left, Summary plot in Glu-GAP43−/− and GAP43fl/fl mice (means ± SEM; c, cells; p values obtained by unpaired Student's t test, shown in black; or Mann–Whitney's U test, shown in bold gray). Right, Representative EPSC and IPSC traces obtained averaging 10 consecutive paired stimuli delivered at 0.2 Hz. E, F, Left, Time course summary plot of EPSC (E) and IPSC (F) cumulative amplitudes in GAP43fl/fl and Glu-GAP43−/− mice during high-frequency trains (100 stimuli at 40 Hz). The y-intercept from a linear fit of the steady-state values is depicted. Right, Representative EPSC and IPSC traces of the first 8 stimuli of the train. G, H, Quantification of the RRP size, the replenishment rate (pA/ms), and the Pves (EPSC or IPSC amplitude value divided by the RRP size) of EPSCs (G) and IPSCs (H) in GAP43fl/fl and Glu-GAP43−/− mice (means ± SEM, c, cells; m, mice; males, empty circles; females, filled circles; p values obtained by unpaired Student's t test, shown in black; or Mann–Whitney's U test, shown in bold gray).
Figure 7.
Figure 7.
Chemogenetic inhibition of corticostriatal afferences reverts the hyperactive phenotype of Glu-GAP43−/− mice. A, Timeline of the experiments. Glu-GAP43−/− or GAP43fl/fl mice were injected stereotaxically in the frontal cortex with AAV8-hSyn-DIO-hM4Di-mCherry (schematic vector is depicted). Three weeks after, animals were injected intraperitoneally with saline vehicle or CNO (2 mg/kg), and 45 min later motor behavior was analyzed. A representative image of an injected brain hemisphere is shown. Cx, cortex; D Str, dorsal striatum; II–III and V–VI, cortical layers II–III and V–VI. B, Representative trajectory maps in a 10 min open-field test of Glu-GAP43−/− and GAP43fl/fl mice treated with saline vehicle or CNO. C, Ambulation (total distance traveled, m), global activity (a.u.), and resting time (s) in a 10 min open-field (OF) test, as well as RotaRod performance (time to fall, s), in Glu-GAP43−/− mice and their GAP43fl/fl littermates (means ± SEM; n = 6–10 mice per group; males, empty circles; females, filled circles; p values obtained by two-way ANOVA with Tukey's multiple-comparisons test).

Similar articles

References

    1. Aitta-Aho T, Maksimovic M, Dahl K, Sprengel R, Korpi ER (2019) Attenuation of novelty-induced hyperactivity of Gria1−/− mice by cannabidiol and hippocampal inhibitory chemogenetics. Front Pharmacol 10:309. 10.3389/fphar.2019.00309 - DOI - PMC - PubMed
    1. Almeida AS, Nunes F, Marques DM, Machado ACL, Oliveira CBA, Porciuncula LO (2023) Sex differences in maternal odor preferences and brain levels of GAP-43 and sonic hedgehog proteins in infant SHR and Wistar Kyoto rats. Behav Brain Res 436:114102. 10.1016/j.bbr.2022.114102 - DOI - PubMed
    1. Armbruster BN, Li X, Pausch MH, Herlitze S, Roth BL (2007) Evolving the lock to fit the key to create a family of G protein-coupled receptors potently activated by an inert ligand. Proc Natl Acad Sci U S A 104:5163–5168. 10.1073/pnas.0700293104 - DOI - PMC - PubMed
    1. Basile GA, Bertino S, Bramanti A, Ciurleo R, Anastasi GP, Milardi D, Cacciola A (2021) Striatal topographical organization: bridging the gap between molecules, connectivity and behavior. Eur J Histochem 65:3284. 10.4081/ejh.2021.3284 - DOI - PMC - PubMed
    1. Benowitz LI, Routtenberg A (1997) GAP-43: an intrinsic determinant of neuronal development and plasticity. Trends Neurosci 20:84–91. 10.1016/S0166-2236(96)10072-2 - DOI - PubMed

LinkOut - more resources