. 2024 Nov;20(8):2303-2317.
doi: 10.1007/s12015-024-10776-6. Epub 2024 Aug 22.

Progesterone receptor is constitutively expressed in induced Pluripotent Stem Cells (iPSCs)

Affiliations

Progesterone receptor is constitutively expressed in induced Pluripotent Stem Cells (iPSCs)

Michele Manganelli et al. Stem Cell Rev Rep. 2024 Nov.

Abstract

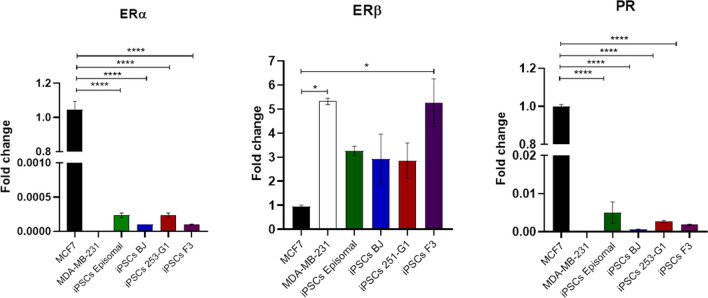
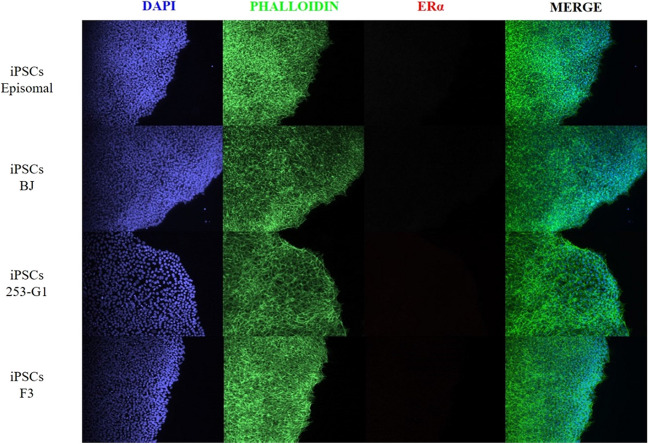
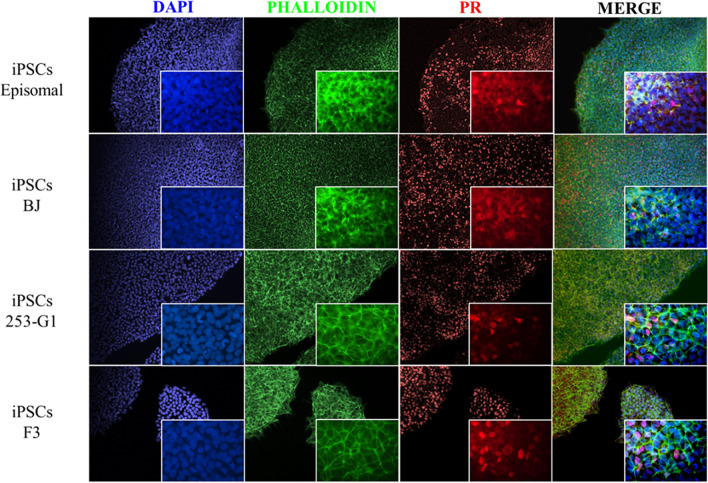
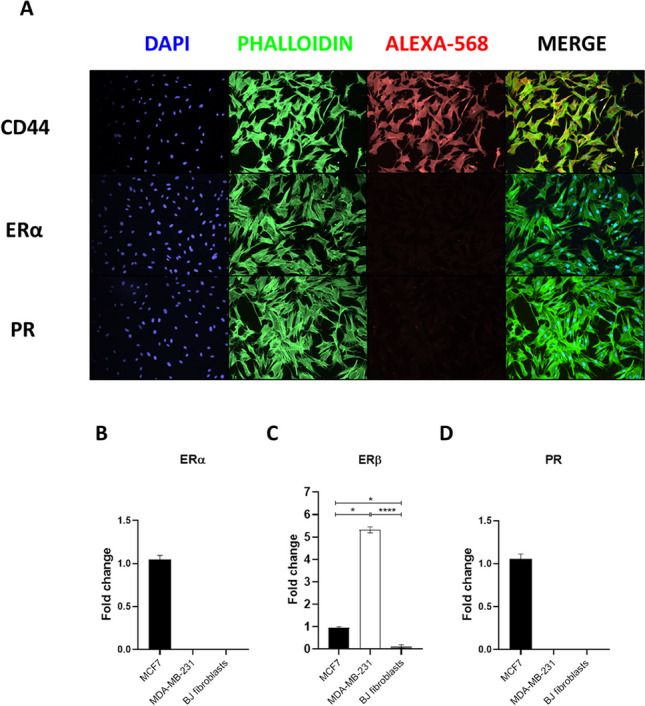
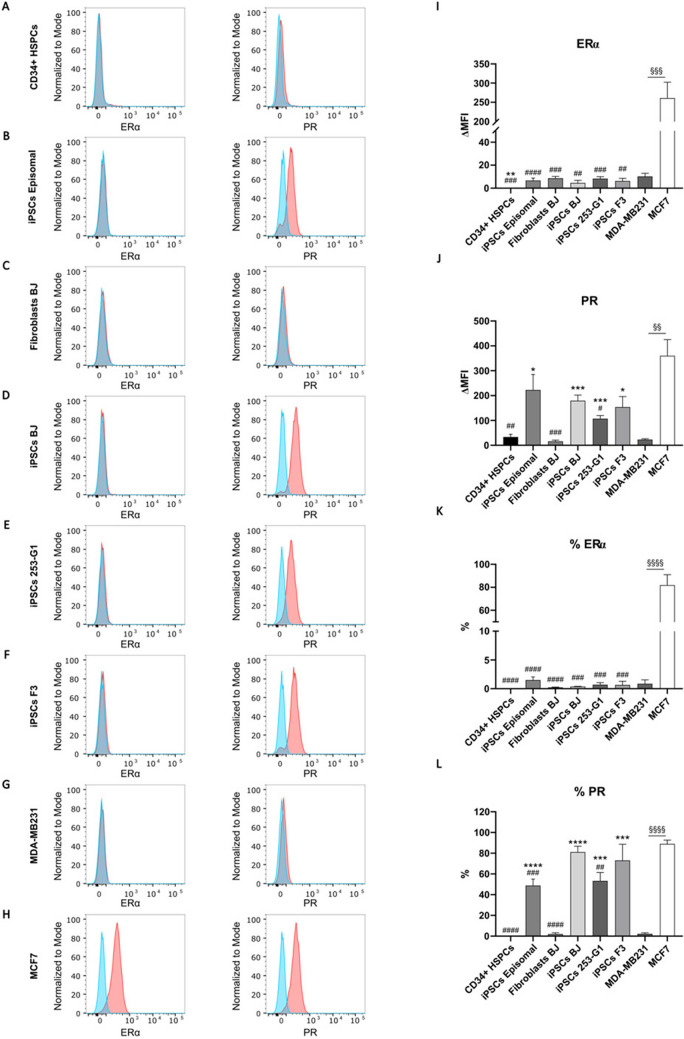
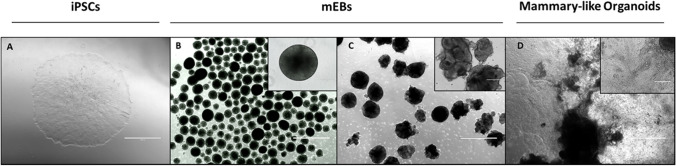
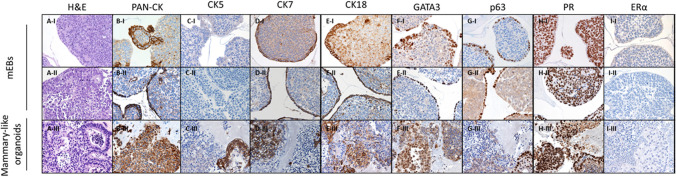
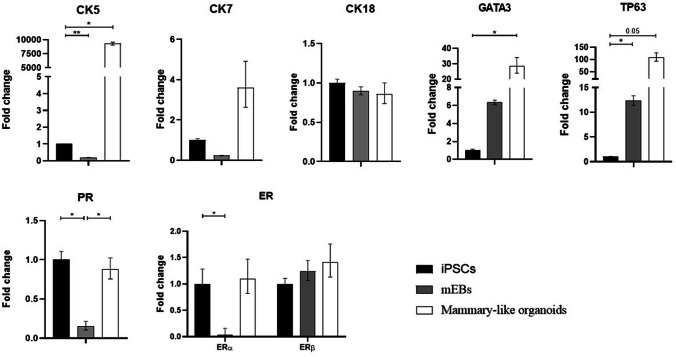
Induced Pluripotent Stem Cells (iPSCs) are nowadays a common starting point for wide-ranging applications including 3D disease modeling (i.e. organoids) and in future regenerative medicine. Physiological processes like homeostasis, cell differentiation, development and reproduction are tightly regulated by hormones through binding to their transmembrane or nuclear receptors of target cells. Considering their pleiotropic effect, take into account also their expression in an iPSCs-based disease modeling would better recapitulate the molecular events leading to 3D organoid development and disease study. Here we reported the expression pattern of estrogen receptor (ERα) and progesterone receptor (PR) in four different iPSCs, obtained from CD34 + progenitor cells and skin fibroblasts with four different methods. Expression of ERα and PR mRNA were significantly downregulated in iPSCs as well as fibroblasts compared to MCF7 positive control. Immunofluorescence (IF) staining detected only the expression of PR protein in all the different iPSCs cell lines, while ERα was not detectable. By flow cytometry analysis we observed that the ~ 65% of the total population of iPSCs cells expressed only PR, with 100% fold increase compared to HSPCs and fibroblasts, while ERα was not expressed. Our results collectively demonstrated for the first time that the reprogramming of somatic cells into iPSCs leads to the expression of PR receptor.

Keywords: CD34; Differentiation; Estrogen receptor; Fibroblasts; Induced pluripotent stem cells (iPSCs); Progesterone receptor.


Conflict of interest statement

Declarations Conflicts of Interest The authors declare no conflict of interest. Data Availability The data supporting the findings of this study are contained within the contents of this article. The datasets generated during this study will be freely provided by the corresponding author upon request. Informed Consent Informed consent was obtained from all subjects involved in the study. Institutional Review Board Statement The study was conducted according to the guidelines of the Declaration of Helsinki and approved by the Ethics Committees of ASST Spedali Civili of Brescia (NP3426).

Figures

Fig. 1
Fig. 1
Expression profile of ERα/β and PR receptors in iPSCs compared to MCF7 and MDA-MB-231. A ERα mRNA in iPSCs cell lines compared to MCF7 positive and MDA-MB-231 negative control. B ERβ mRNA in iPSCs cell lines compared to MCF7 negative and MDA-MB-231 positive control. C PR mRNA in iPSCs cell lines compared to MCF7 positive and MDA-MB-231 negative control. Histograms represent fold-change in the gene expression of three independent experiments, while error bars represent ± SEM. One-way ANOVA followed by Tukey’s post-hoc test. **** p < 0.0001
Fig. 2
Fig. 2
Detection of ERα in iPSCs cell lines. Immunofluorescent (IF) staining for the detection of ERα among the different iPSCs cell lines. Nuclei were counterstained in blue (DAPI), while cytoskeleton in green (phalloidin-488) and ERα in red (Alexa-568). Magnification 10X
Fig. 3
Fig. 3
Detection of PR in iPSCs cell lines. Immunofluorescent (IF) staining for the detection of PR among the different iPSCs cell lines. Nuclei were counterstained in blue (DAPI), while cytoskeleton in green (phalloidin-488) and PR in red (Alexa-568). Pictures were acquired at 10X (background) and 60X (foreground) magnification respectively. Representative images of at least 4 independent fields of two independent experiments
Fig. 4
Fig. 4
CD44, ERα/β and PR in BJ human foreskin fibroblasts. A Immunofluorescent (IF) staining. Nuclei were counterstained in blue (DAPI) and cytoskeleton in green (phalloidin-488), while CD44, ERα and PR in red (Alexa-568). Magnification 10X. B-C Gene expression analysis of ERα/β in MCF7, MDA-MB-231 and BJ fibroblasts. D Gene expression analysis of PR in MCF7, MDA-MB-231 and BJ fibroblasts. Histograms represent fold-change in the gene expression of three independent experiments, while error bars represent ± SEM
Fig. 5
Fig. 5
Flow cytometry analysis for the detection of ERα and PR in mobilized-PB, fibroblasts, and iPSCs. A-H: representative images of ERα (left) and PR (right) expression in G-CSF mobilized-PB (gated on CD34 + HSPCs, A, Episomal iPSCs (B), BJ fibroblasts (C), BJ iPSCs (D), 253-G1 iPSCs (E), F3 iPSCs (F), and in MDA-MB231 negative control (G) and MCF7 positive control (H); red = aspecific fluorescence, blue = FITC-labeled target. I-L: Histograms representing either ΔMFI = median fluorescence intensity (I,J) or percentage (K,L) of ERα (I,K) and PR expression (J,L) in G-CSF mobilized-PB (gated on CD34 + HSPCs), Episomal iPSCs, BJ fibroblasts, BJ iPSCs, 253-G1 iPSCs, F3 iPSCs, and in MDA-MB231 negative control and MCF7 positive control. Bars represent the mean ± SEM from at least three independent experiments.*, # p < 0.05, **, ##, §§ p < 0.01, ***, ###, §§§ p < 0.001, ****, ####, §§§§ p < 0.0001; * vs MDA-MB231; # vs MCF7; § MDA-MB231 vs MCF7
Fig. 6
Fig. 6
Representative images of morphological changes during mammary-like organoids generation from iPSCs. A iPSCs colony; B 1-d mEBs differentiation; C 10-d mEBs differentiation; D Mammary-like organoids. Pictures were acquired at 4X (background) and 20X (foreground) magnification respectively
Fig. 7
Fig. 7
H&E and IHC staining. A) H&E stain; B) PAN-CK; C-D-F) Luminal (CK5/7 + and GATA3 +) and E–G) basal cells markers (CK18 + and TP63 +); H) PR and I) ERα. Representative images of mEBs obtained from iPSCs Episomal (I); mEBs obtained from iPSCs BJ (II); mammary-like organoids (III) differentiation
Fig. 8
Fig. 8
Gene expression analysis of luminal (CK5/7 + and GATA3 +) and basal markers (CK18 + and TP63 +) markers, PR, ERα and ERβ in iPSCs, 10d-mEBs and 20-d mammary-like organoids. Histograms represent fold-change in the gene expression, while error bars represent ± SEM. *p < 0.05, **p < 0.01

References

    1. Takahashi, K.; Tanabe, K.; Ohnuki, M.; Narita, M.; Ichisaka, T.; Tomoda, K.; Yamanaka, S. Induction of Pluripotent Stem Cells from Adult Human Fibroblasts by Defined Factors. Cell2007, 131, 10.1016/j.cell.2007.11.019. - PubMed
    1. Giallongo, S.; Rehakova, D.; Raffaele, M.; Lo Re, O.; Koutna, I.; Vinciguerra, M. Redox and Epigenetics in Human Pluripotent Stem Cells Differentiation. Antioxidants Redox Signal. 2021, 34. - PubMed
    1. Scesa, G.; Adami, R.; Bottai, D. iPSC preparation and epigenetic memory: Does the tissue origin matter? Cells 2021, 10. - PMC - PubMed
    1. Liu, G.; David, B.T.; Trawczynski, M.; Fessler, R.G. Advances in Pluripotent Stem Cells: History, Mechanisms, Technologies, and Applications. Stem Cell Rev. Reports 2020, 16. - PMC - PubMed
    1. Rowe, R.G.; Daley, G.Q. Induced pluripotent stem cells in disease modelling and drug discovery. Nat. Rev. Genet. 2019, 20. - PMC - PubMed

Publication types

MeSH terms

LinkOut - more resources