Clinical Trial
. 2024 Aug 21;15(1):7187.
doi: 10.1038/s41467-024-49842-5.

A gut microbiota rheostat forecasts responsiveness to PD-L1 and VEGF blockade in mesothelioma

Affiliations
Clinical Trial

A gut microbiota rheostat forecasts responsiveness to PD-L1 and VEGF blockade in mesothelioma

Min Zhang et al. Nat Commun. .

Abstract

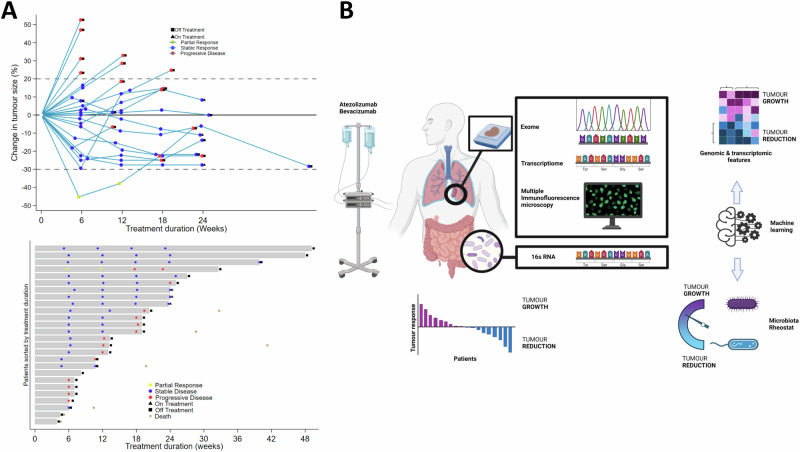
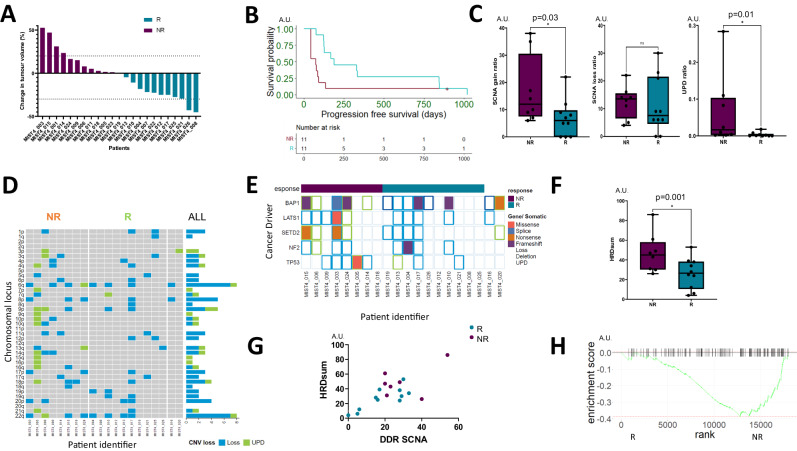
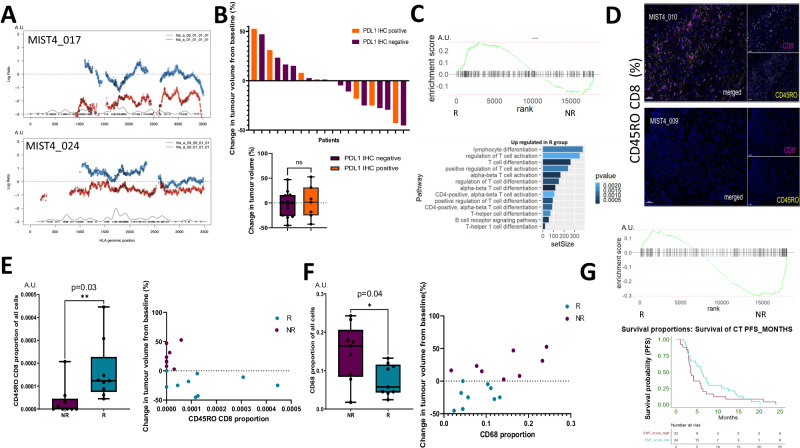
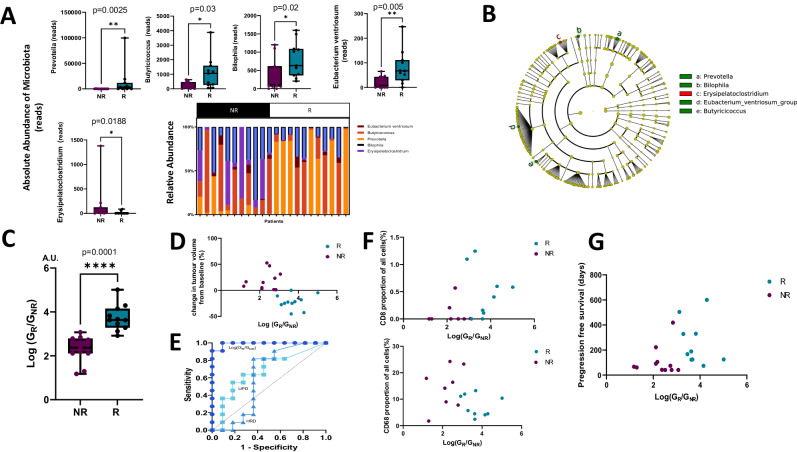
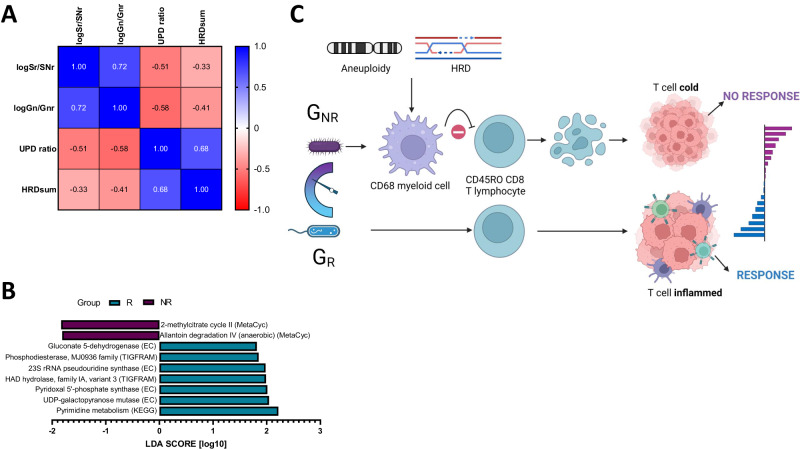
Malignant mesothelioma is a rare tumour caused by asbestos exposure that originates mainly from the pleural lining or the peritoneum. Treatment options are limited, and the prognosis is dismal. Although immune checkpoint blockade (ICB) can improve survival outcomes, the determinants of responsiveness remain elusive. Here, we report the outcomes of a multi-centre phase II clinical trial (MiST4, NCT03654833) evaluating atezolizumab and bevacizumab (AtzBev) in patients with relapsed mesothelioma. We also use tumour tissue and gut microbiome sequencing, as well as tumour spatial immunophenotyping to identify factors associated with treatment response. MIST4 met its primary endpoint with 50% 12-week disease control, and the treatment was tolerable. Aneuploidy, notably uniparental disomy (UPD), homologous recombination deficiency (HRD), epithelial-mesenchymal transition and inflammation with CD68+ monocytes were identified as tumour-intrinsic resistance factors. The log-ratio of gut-resident microbial genera positively correlated with radiological response to AtzBev and CD8+ T cell infiltration, but was inversely correlated with UPD, HRD and tumour infiltration by CD68+ monocytes. In summary, a model is proposed in which both intrinsic and extrinsic determinants in mesothelioma cooperate to modify the tumour microenvironment and confer clinical sensitivity to AtzBev. Gut microbiota represent a potentially modifiable factor with potential to improve immunotherapy outcomes for individuals with this cancer of unmet need.


Conflict of interest statement

D.A.F. reports grants from Aldeyra, Astex Therapeutics, Bayer, BMS and Boehringer Ingelheim, Owkin; non-financial support from BerGenBio, Clovis, Eli Lilly, MSD, Roche, and Tesaro GSK; personal fees from Aldeyra, Cambridge Clinical Laboratories, Ikena, Opna Bio, Owkin, RS Oncology, Roche, MSD, during the conduct of the study. All other authors declare no competing interests.

Figures

Fig. 1
Fig. 1. Efficacy and multi-omic analysis workflow in MIST4.
A Upper panel. Spider plot showing the change in tumour size (% assessed by modified RECIST) against time (weeks) within 24 weeks. Dashed lines show threshold corresponding to partial response (−30% lower band) or disease progression (+20% upper band). Lower panel. Swimmer plot showing the duration of treatment measured within 24 weeks. B 26 patients with either pleural or peritoneal mesothelioma were recruited into MIST4 and received atezolizumab and bevacizumab (AtzBev), administered intravenously every 21 days until disease progression. Response to treatment was dichotomised into two groups; showing tumour reduction (blue) or growth (purple) as the best response, respectively. Diagnostic tumour blocks were subjected to whole exome and transcriptome sequencing. Spatial phenotyping by multiplex immunofluorescence was used to interrogate the immune landscape, and gut microbiota was 16S RNA sequenced. Features enriched in tumours showing either growth or reduction were inferred by ensemble machine learning (random forests, extreme gradient boosting).
Fig. 2
Fig. 2. Efficacy and genomic correlates of response to dual PD-L1-VEGF inhibition.
A Waterfall plot showing the best response within 24 weeks for patients enrolled into the MIST4 clinical trial. Response was dichotomised into two equal subgroups; those patients with no tumour reduction (purple, NR) and those with tumour reduction (blue, R). The upper dotted line marks the 20% threshold for progressive disease by modified RECIST 1.1 (mRECIST) and the bottom dotted line, partial response (−30% threshold). B R-subgroup patients exhibited longer progression-free and overall survival (PFS and OS respectively) in the R (blue) versus the NR-subgroup (purple). Median PFS was 188 days in the R subgroup and 74 in the NR-subgroup (two-sided Mantel–Cox test p = 0.02). C Boxplots showing the relative somatic copy number alteration frequency in tumours associated in R- vs NR-subgroup. SCNA gains (left panel; for NR n = 8 patients and for R n = 10 patients) were higher in NR vs R but not losses (middle panel; for NR n = 8 patients and for R n = 10 patients), p = 0.03 vs 0.56, respectively. Uniparental disomy (UPD) was higher in the R group compared to the NR group (for NR n = 8 donors and for R n = 9 patients) (p = 0.01). Data were analysed with a two-sided Mann–Whitney U test and data are presented as median value ± IQR. D Heatmap showing UPD enrichment in the NR vs R-groups. Cumulative frequency of UPD and SCNA losses are shown in the histogram to the right of the heatmap. E Heatmap showing enrichment of tumour suppressor driver alterations involving SETD2, p53 and LATS2 somatic alterations in the NR-(purple) vs R- (blue) subgroup. F Boxplot showing enrichment of HRD (HRDsum, comprising the sum of LOH, TAI, and LST signatures) in the NR vs the R subgroup (for NR n = 8 patients and for R n = 10 patients) (p = 0.001). Data were analysed with a two-sided Mann–Whitney U test and data are presented as median value ± IQR. G SCNAs involving DNA damage response genes (DDR) were positively correlated (r = 0.73 p = 0.03; a two-sided Mann–Whitney U test) with the combined HRD signature (HRDsum), comprising the sum of sub-signatures LOH, TAI, LST. R subgroup is denoted in blue and the NR-subgroup in purple. H Gene set enrichment plot showing reduced transcriptional enrichment of DNA repair genes in the NR vs the R subgroup (Benjamini–Hochberg adjusted p = 0.002).
Fig. 3
Fig. 3. Immune landscape and radiological response in MIST4.
A Histogram showing allele-specific loss of heterozygosity of the human leucocyte antigen relative LOHHLA involving two MIST4 patients (patients MIST4-017 and MIST4-024). B Top panel. Waterfall plot showing the expression of PD-L1 (35% overall, orange). Lower panel. Boxplot summarising the PD-L1 expression positive (n = 7 patients) in orange vs negative (n = 13 patients) in purple (p = 0.7). Data were analysed with a two-sided Mann–Whitney U test and data are presented as median value ± IQR. No significant association between PD-L1 TPS and response measured as the change in tumour volume (%) by modified RECIST 1.1. C Upper panel. GSEA enrichment plot showing significant enrichment of the hallmark inflammatory response signature in the R- vs NR-subgroup (Benjamini–Hochberg adjusted p = 0.04). Lower panel. Relative activation of immune signatures in R- vs NR- subgroups supporting constitutive T-cell activation in the R subgroup. D Immunofluorescence microscopy comparing the proportion of antigen-experienced CD45RO+ CD8+T-lymphocytes in an exemplary R-group patient (MIST4-010) with an NR-subgroup patient (MIST4-09). Bar represents 50 μM. E Left panel. Boxplot showing greater proportion of CD45RO+ CD8+ effector T-cells in the R- vs NR-subgroup (for NR n = 9 patients and for R n = 9 patients p = 0.03); the boxplot is bounded by the 25TH/75TH percentiles, showing the median (horizontal line), maximum (upper whisker) and minimum (lower whisker). Data were analysed with a two-sided Mann–Whitney U test and data are presented as median value ± IQR. Right panel. Scatter plot showing a correlation between CD45RO+ CD8+ effector T-cells and tumour reduction (r = −0.52, p = 0.03). Data were analysed with a two-sided Spearman r test. F Left panel. Boxplot showing greater proportion of CD68+ myeloid cells in the R- vs NR-subgroup (for NR n = 9 patients and for R n = 9 patients p = 0.04; the boxplot is bounded by the 25th/75th percentiles, showing the median (horizontal line), maximum (upper whisker) and minimum (lower whisker)). Data were analysed with a two-sided Mann–Whitney U and data are presented as median value ± IQR. Right panel. Scatter plot showing the correlation between CD68+ monocytes with tumour growth (r = 0.51, p = 0.03; two-sided Spearman r test.). Blue points correspond to the R subgroup and purple to the NR-subgroup. G Top panel. Gene set enrichment plot showing EMT enrichment in the NR- subgroup. Lower panel. Kaplan–Meier curves showing shorter overall survival (3.5 for high EMT vs 6.1 months, HR 0.77) for patients exhibiting EMT enrichment signature in an independent cohort.
Fig. 4
Fig. 4. Gut microbiota ratio of R- vs NR-subgroups predicts response and shapes the immune microenvironment.
A Boxplots showing the comparative proportion of genera in the two subgroups (Prevotella (p = 0.002), Butyricioccus (p = 0.03), Eubaterium ventriosum (p = 0.005), biophilia (p = 0.02), erysipeloclostridium (p = 0.018)). For each analysis, n = 11 patients from the NR-subgroup and n = 11 patients from the R subgroup have been used. Data were analysed with a two-sided Mann–Whitney U test and data are presented as median value ± IQR. The boxplots are bounded by the 25th/75th percentiles, showing the median (horizontal line), maximum (upper whisker) and minimum (lower whisker). B Microbiota cladogram showing the phylogenetic distance of R- vs NR-subgroup enriched genera. C Boxplot showing a significantly higher logarithmic ratio of enriched gut microbial genera, log (GR/GNR) in the R subgroup (blue) compared with the NR-subgroup (purple), p < 0.0001. For each analysis, n = 11 patients from the NR-subgroup and n = 11 patients from the R subgroup have been used. Data were analysed with a two-sided Mann–Whitney U test and data are presented as median value ± IQR. The boxplot is bounded by the 25th/75th percentiles, showing the median (horizontal line), maximum (upper whisker) and minimum (lower whisker). D Scatter plot showing the correlation between log(GR/GNR) and radiological response (r = −0.72 p = 0.002). Blue points correspond to the R subgroup and purple to the NR-subgroup. Data were analysed with a two-sided Spearman r test. E Receiver operator curve corresponding to log(GR/GNR) versus response. Area under the ROC curve is 0.94 computed with k-fold cross-validation (95% confidence limits 0.82–0.94). ROC curves are superimposed for UPD and HRD (AUC. F Top panel. Scatter plot showing a positive correlation between log(GR/GNR) and CD8+ T-lymphocytes (r = 0.48, p = 0.05). Data were analysed with a two-sided Spearman r test). Lower panel. Scatter plot showing a negative correlation between log(GR/GNR) and CD68+ monocytes (r = −0.38 p = 0.13). Data were analysed with a two-sided Spearman r test. Blue points correspond to the R subgroup and purple to the NR-subgroup. G Scatter plot showing a positive correlation between log(GR/GNR) and progression-free survival (r = 0.47, p = 0.034). Data were analysed with a two-sided Spearman r test. Blue points correspond to the R subgroup and purple to the NR-subgroup.
Fig. 5
Fig. 5. Gut microbiota correlates with genomic instability and exhibits AtzBev response-specific metabolic profiles.
A Correlation matrix showing negative correlations between Log (GR/GNR) and UPD (r = −0.58, p = 0.008), HRDsum (r = −0.41, p = 0.05) respectively. UPD and HRDsum were positively correlated (r = 0.68, p = 0.003). Data were analysed with a two-sided Spearman r test. Predictive metagenomic analysis identifies differential microbial pathway enrichment in R- vs NR patients in MIST4. B Histogram showing the linear discriminant analysis related metabolic process enrichment in the NR- vs the R subgroup. C Model to illustrate a possible link between the gut microbiota rheostat log (GR/GNR) and mesothelioma response in MIST4.

References

    1. Baas, P. et al. First-line nivolumab plus ipilimumab in unresectable malignant pleural mesothelioma (CheckMate 743): a multicentre, randomised, open-label, phase 3 trial. Lancet397, 375–386 (2021). - PubMed
    1. Fennell, D. A. et al. Nivolumab versus placebo in patients with relapsed malignant mesothelioma (CONFIRM): a multicentre, double-blind, randomised, phase 3 trial. Lancet Oncol.22, 1530–1540 (2021). - PMC - PubMed
    1. Hmeljak, J. et al. Integrative molecular characterization of malignant pleural mesothelioma. Cancer Discov.8, 1548–1565 (2018). - PMC - PubMed
    1. Zhang, M. et al. Clonal architecture in mesothelioma is prognostic and shapes the tumour microenvironment. Nat. Commun.12, 1751 (2021). - PMC - PubMed
    1. Klampatsa, A. et al. Phenotypic and functional analysis of malignant mesothelioma tumor-infiltrating lymphocytes. Oncoimmunology8, e1638211 (2019). - PMC - PubMed

Publication types

MeSH terms

LinkOut - more resources