. 2024 Aug 21;15(1):6989.
doi: 10.1038/s41467-024-51185-0.

In-depth analysis of transcriptomes in ovarian cortical follicles from children and adults reveals interfollicular heterogeneity

Affiliations

In-depth analysis of transcriptomes in ovarian cortical follicles from children and adults reveals interfollicular heterogeneity

Ilmatar Rooda et al. Nat Commun. .

Abstract

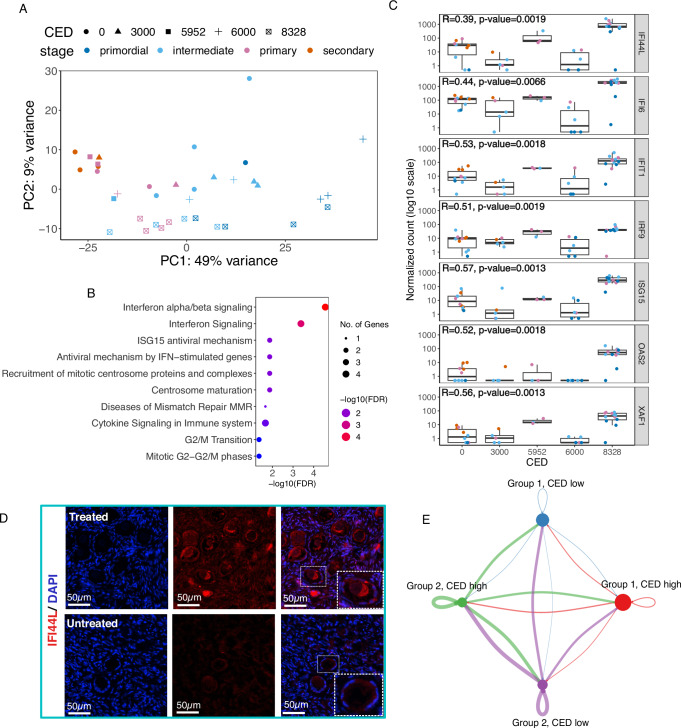
The ovarian cortical reserve of follicles is vital for fertility. Some medical treatments are toxic to follicles, leading to premature ovarian insufficiency. Ovarian tissue cryopreservation is an established method to preserve fertility in adults and even applied in prepuberty despite unproven efficacy. Here, we analyze transcriptomes of 120 cortical follicles from children and adults for detailed comparison. We discover heterogeneity with two main types of follicles in both age groups: one with expected oocyte-granulosa profiles and another with predicted role in signaling. Transcriptional changes during growth to the secondary stage are similar overall in children and adults, but variations related to extracellular matrix, theca cells, and miRNA profiles are found. Notably, cyclophosphamide dose correlates with interferon signaling in child follicles. Additionally, morphology alone is insufficient for follicle categorization suggesting a need for additional markers. Marker genes for early follicle activation are determined. These findings will help refine follicular classification and fertility preservation techniques across critical ages.


Conflict of interest statement

The authors declare no competing interests.

Figures

Fig. 1
Fig. 1. Experimental setup.
Human ovarian tissue was collected from adults undergoing gender reassignment surgery and from children undergoing fertility preservation. Cryopreserved cortical tissue samples were thawed and subsequently dissociated for the manual isolation of cortical follicles under a stereomicroscope. A total of 120 viable follicles, as confirmed by neutral red staining and regular morphology, were chosen for single follicle analysis. Each follicle was individually lysed, and the cell lysate was divided into polyA-RNA sequencing following the Smart-seq2 protocol, and short RNA sequencing using the QIAseq small RNA kit. Created with BioRender.com released under a Creative Commons Attribution-NonCommercial-NoDerivs 4.0 International license.
Fig. 2
Fig. 2. Human ovarian cortex contains two distinct populations of follicles.
120 follicles of normal morphology isolated from children and adults were analyzed via polyA-RNA and miRNA. After quality control, 109 and 113 follicles remained in the analysis, respectively. A Principal component analysis (PCA) and B uniform manifold approximation and projection (UMAP) visualization showed two follicle groups based on polyA-RNA expression, with child and adult follicles equally present. Group 1 included all developmental stages, while Group 2 had growing follicles only. C PCA based on miRNA expression did not group the follicles but aligned PC1 with developmental stages from primordial to secondary follicles. D Volcano plot showed a marked upregulation of genes in Group 1 follicles compared to Group 2, Wald test, adjusted using Benjamini–Hochberg (BH) method. E Similar expression profiles were found when specific follicle growth stages were compared; here, primary follicles of Group 1 vs Group 2. F Differentially expressed genes (DEGs) between Group 1 and Group 2 follicles included recognized oocyte (above red line) and granulosa (under red line) cell markers. Group 1 exhibited an upregulation of traditional oocyte markers, whereas Group 2 had upregulation of typical granulosa cell markers. G The top enriched Gene Ontologies (GO), KEGG, and Reactome pathways in Group 1 follicles suggested enrichment in reproductive processes, meiotic cell cycle, and steroidogenesis. Group 2 displayed enrichment in cell communication, developmental processes, and extracellular matrix organization, Fisher’s one-tailed test, adjusted using BH method. H When analyses were restricted to primary follicles only, similar results were obtained. I Immunofluorescence staining of adult and child ovarian cortical tissues revealed follicles with varying DDX4 oocyte marker expression (high expression, green arrows; low expression, blue arrows). J Quantification of the immunofluorescent signal from 343 follicles across two adults and one child presented a bimodal distribution, suggesting the presence of two follicle groups based on their DDX4 expression levels (red line). K Scatter plot of follicle-to-follicle communications in a 2D space. The dot size reflects the number of inferred links associated with each follicle group. Group 2 primary and intermediary follicles were predominant signal senders, while Group 1 primary follicles were the main signal receivers. NS- non-significant. Source data are provided as a Source Data file.
Fig. 3
Fig. 3. Transcriptional dynamics of primordial to secondary follicle development in children and adults.
Gene expression changes during follicle development up to the secondary stage in children and adults were studied using data from Group 1 follicles (n = 70). A Principal component analysis showed that PC1 was primarily driven by the morphologically determined maturation stage of the follicles in both age categories. B Comparative analysis of different follicular stages revealed thousands of differentially expressed genes (DEGs, FDR < 0.05) in children and adults, with many of these changes occurring during the transition from dormancy (primordial stage) to active growth (primary stage). C Comparison of DEGs between children and adults revealed minor overlap, with the majority of DEGs being significant only in one age group. D Separate pattern analysis based on DEGs in adults and DEGs in children revealed that most genes were upregulated, while some were downregulated. The corresponding genes in the other age group are shown for comparison in the plots, demonstrating that the overall regulations are similar despite statistical testing suggesting the genes are regulated in one age group only. Despite these overall similarities, multiple smaller groups of genes showed differing patterns (bottom row). Comprehensive patterns can be found in Supplementary Fig. 4. In box plots, the center line represents the median, the hinges correspond to the first and third quartiles (interquartile range), and the whiskers extend to 1.5 times the interquartile range from the hinges. E Genes displaying upregulation during follicle development (adult pattern 2 + child pattern 1) were enriched in Gene Ontologies (GO) related to extracellular matrix organization and developmental processes. F Conversely, genes exhibiting downregulation (adult pattern 6 + child pattern 3) were linked to GO categories related to cell cycle processes, chromosome segregation, and cytoskeleton organization. G Changes in miRNA levels were comparatively subtle. H The majority of miRNAs were significant only in one age group. I Predicted adult miRNA targets showed over-representation in the PI3K-Akt, FoxO, and HIF-1 signaling pathways, while child miRNAs displayed over-representation in the PI3K-Akt, HIF-1, Jak-STAT, and VEGF pathways. All DEGs have been adjusted for patient-specific variation. Source data are provided as a Source Data file.
Fig. 4
Fig. 4. Divergence in gene expression between child and adult follicles.
Gene expression variation between child and adult follicles at corresponding developmental stages was examined. A Comparison of the same-stage follicles revealed the most pronounced differences between the age groups at the secondary stage in both polyA-RNA and miRNA expression. B Top enriched Gene Ontologies (GO), KEGG, and Reactome pathways in adult follicles pertained to hormones, signaling, cell adhesion, and reproduction, Fisher’s one-tailed test, adjusted for multiple comparisons using Benjamini–Hochberg (BH) method, while C differentially expressed genes (DEGs) upregulated in child follicles were related to calcium ion transport, adhesion, and glycosylation, Fisher’s one-tailed test, adjusted for multiple comparisons using BH method. D Immunostaining of selected DEGs belonging to the top enriched processes of signaling (ACTA2, increased in adult), development and adhesion (ASTN1, increased in child; SPARCL1, increased in adult), and development and morphogenesis (HIF3a, increased in child), validated the anticipated differences at the protein level (adult n = 2 and child n = 2). E Dot plot displaying the differentially regulated miRNAs. The profile transitioned from an upregulation of miRNAs in child primordial follicles to an upregulation of an alternate set of miRNAs in adult secondary follicles. F In primordial follicles, predicted targets exhibiting negative correlations with miRNA expression values were enriched in O-linked glycosylation of mucins pathway, Fisher’s one-tailed test, adjusted for multiple comparisons using BH method. Additionally, in secondary follicles, negative correlations were observed in the context of TGF-beta signaling and the triglyceride biosynthetic process (for a comprehensive list, see Supplementary Data 10A, B). Source data are provided as a Source Data file.
Fig. 5
Fig. 5. Heterogeneity in gene expression of morphologically similar primordial follicles.
Gene expression variation within the set of 15 primordial follicles was further inspected. A Principal component analysis (PCA) based on polyA-RNA expression divided the primordial follicles into two clusters by PC1, with child and adult follicles present in both. B In terms of morphology, the follicles from the two clusters were indistinguishable (adult n = 7 and child n = 8). C The two clusters differed by 636 differentially expressed genes (DEGs), with the majority being upregulated in one of the clusters. D The top DEGs included many genes with known roles in follicle growth and activation (adult n = 7 and child n = 8). In box plots, the center line represents the median, the hinges correspond to the first and third quartiles (interquartile range), and the whiskers extend to 1.5 times the interquartile range from the hinges. E The associated enriched gene ontologies related to the regulation of proliferation, development, motility, and adhesion, suggesting that some of the primordial follicles had exited dormancy despite not showing morphological signs of activation. F Immunofluorescence staining of adult ovarian tissue (n = 1) with antibodies targeting YAP1 suggested the presence of dormant (no staining, red arrow) and activated primordial follicles (positive staining in granulosa cells, blue arrow). Source data are provided as a Source Data file.
Fig. 6
Fig. 6. Chemotherapy alters gene expression in viable child ovarian follicles of good morphology.
Since some child patients had received first-line chemotherapy prior to fertility preservation, the potential effects of the cumulative dose of alkylating chemotherapy (CED, cyclophosphamide equivalent dose) on follicle gene expression were examined. A Principal component analysis displayed the expected division of follicles by developmental stage across PC1, while PC2 distributed the follicles by the level of chemotherapy treatment. B When comparing gene expression between patients at low risk of gonadal damage (CED 0–3000 g/m2) to those at high risk (CED ≥6000 g/m2), 166 differentially expressed genes were identified with significant enrichment of pathways related to interferon signaling. C Expression of selected interferon signaling pathway genes correlated with CED exposure levels based on Spearman coefficients (CED 0 n = 10; CED 3000 n = 5; CED 5952 n = 3; CED 6000 n = 6; and CED 8328 n = 12). In box plots, the center line represents the median, the hinges correspond to the first and third quartiles (interquartile range), and the whiskers extend to 1.5 times the interquartile range from the hinges. D Immunofluorescence staining for IFI44L in an independent set of samples (untreated, 6 years old, CED = 0; treated, 6 years old, CED = 4200 g/m2) confirmed upregulation in follicles at the protein level. E The circle plot illustrating follicle-to-follicle communication based on secreted signals reveals that the communication strength of Group 2 follicles is comparable under both low and high CED exposure. The line thickness indicates the strength of the communication, color specifies the group, and the size of the dots relates to the number of follicles in each group. Box plots display the median, interquartile range, and minimum and maximum (whiskers) values of the normalized count. Source data are provided as a Source Data file.

References

    1. Wallace, W. H. B. & Kelsey, T. W. Human ovarian reserve from conception to the menopause. PloS One5, e8772 (2010). 10.1371/journal.pone.0008772 - DOI - PMC - PubMed
    1. McGee, E. A. & Hsueh, A. J. W. Initial and cyclic recruitment of ovarian follicles*. Endocr. Rev.21, 200–214 (2000). - PubMed
    1. Gougeon, A. Dynamics of follicular growth in the human: a model from preliminary results. Hum. Reprod.1, 81–87 (1986). 10.1093/oxfordjournals.humrep.a136365 - DOI - PubMed
    1. Terasawa, E. & Fernandez, D. L. Neurobiological mechanisms of the onset of puberty in primates*. Endocr. Rev.22, 111–151 (2001). - PubMed
    1. Chen, Y. et al. The factors and pathways regulating the activation of mammalian primordial follicles in vivo. Front. Cell Dev. Biol.8, 575706 (2020). 10.3389/fcell.2020.575706 - DOI - PMC - PubMed