. 2024 Aug 21;15(1):7181.
doi: 10.1038/s41467-024-51354-1.

A class I PI3K signalling network regulates primary cilia disassembly in normal physiology and disease

Affiliations

A class I PI3K signalling network regulates primary cilia disassembly in normal physiology and disease

Sarah E Conduit et al. Nat Commun. .

Abstract

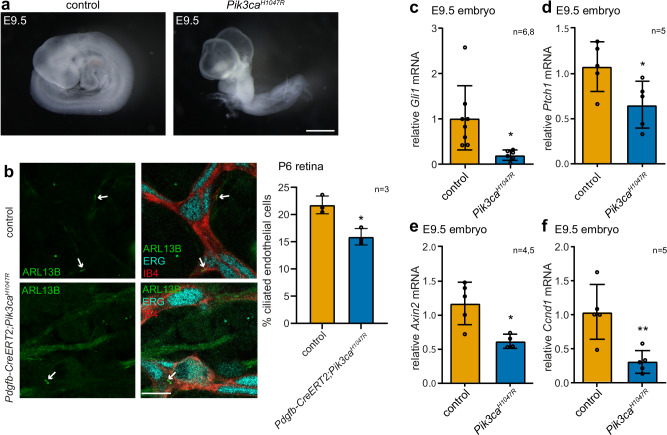
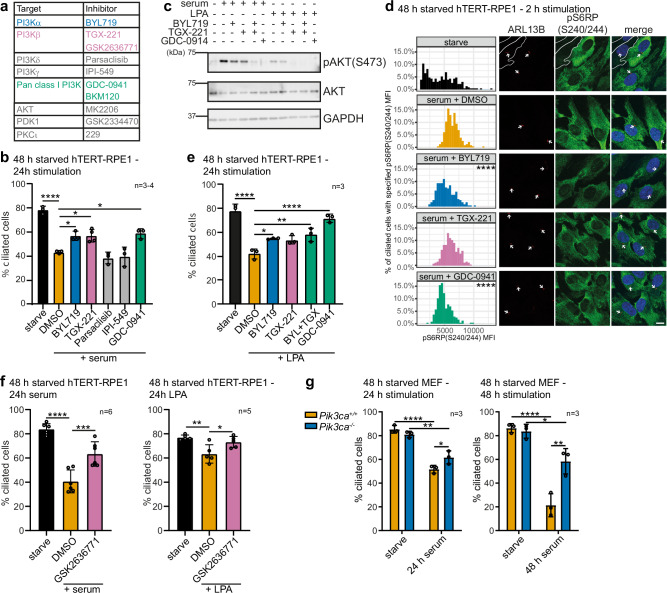
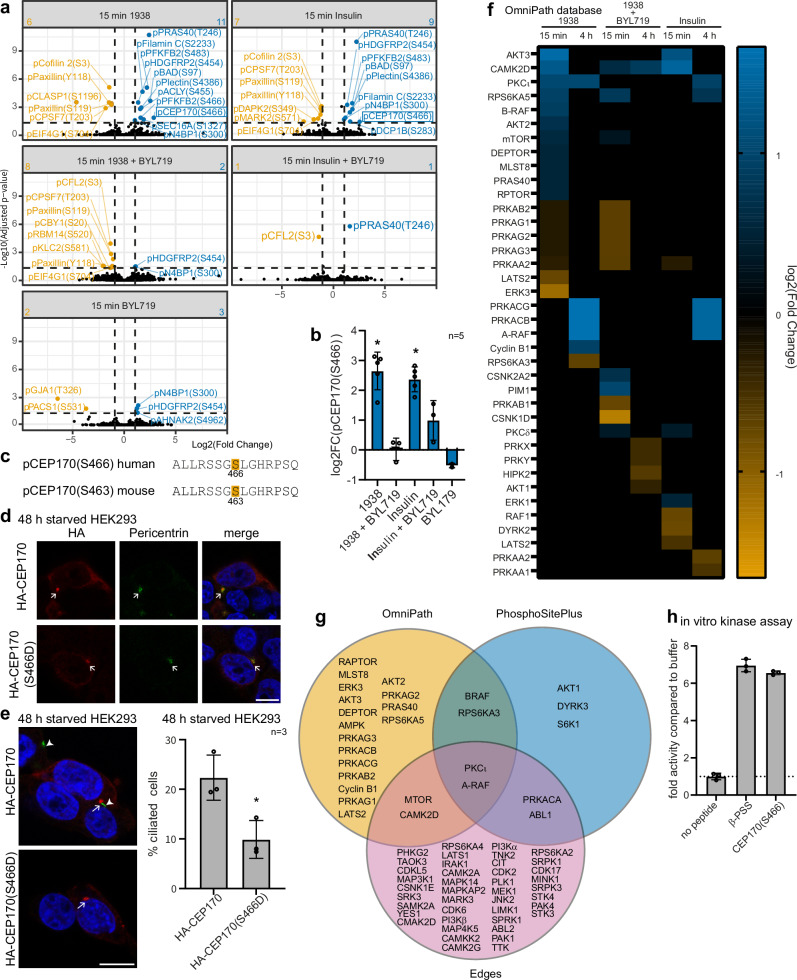
Primary cilia are antenna-like organelles which sense extracellular cues and act as signalling hubs. Cilia dysfunction causes a heterogeneous group of disorders known as ciliopathy syndromes affecting most organs. Cilia disassembly, the process by which cells lose their cilium, is poorly understood but frequently observed in disease and upon cell transformation. Here, we uncover a role for the PI3Kα signalling enzyme in cilia disassembly. Genetic PI3Kα-hyperactivation, as observed in PIK3CA-related overgrowth spectrum (PROS) and cancer, induced a ciliopathy-like phenotype during mouse development. Mechanistically, PI3Kα and PI3Kβ produce the PIP3 lipid at the cilia transition zone upon disassembly stimulation. PI3Kα activation initiates cilia disassembly through a kinase signalling axis via the PDK1/PKCι kinases, the CEP170 centrosomal protein and the KIF2A microtubule-depolymerising kinesin. Our data suggest diseases caused by PI3Kα-activation may be considered 'Disorders with Ciliary Contributions', a recently-defined subset of ciliopathies in which some, but not all, of the clinical manifestations result from cilia dysfunction.


Conflict of interest statement

B.V. is a consultant for iOnctura (Geneva, Switzerland), Pharming (Leiden, the Netherlands) and shareholder of Open Orphan and Poolbeg Pharma (Dublin, Ireland), P.J.P. is a consultant for Apollo Therapeutics and Phoremost. P.R.C. is a co-founder and director of Kinomica Ltd, a company active in the area of phosphoproteomic diagnostics. The remaining authors declare no competing interests.

Figures

Fig. 1
Fig. 1. Constitutive activation of PI3Kα in vivo induces ciliopathy phenotypes and repression of cilia-dependent signalling.
a Whole mount images of E9.5 control and Pik3caH1047R embryos, scale bar: 500 μm, representative of n = 59 (control), n = 48 (Pik3caH1047R) embryos. b Retinas from Pik3caH1047R and Pdgfb-CreERT2;Pik3caH1047R mice treated with 4-hydroxytamoxifen at P1 were harvested at P6, immunostained with ARL13B, IB4 and ERG antibodies and imaged by confocal microscopy, scale bar: 10 um. The proportion of ciliated endothelial cells was scored, bars represent mean ± SD, ≥397 cells were scored per mouse for n = 3 mice/genotype, *p < 0.05 (two-sided Student’s t-test, p = 0.0104). E9.5 control and Pik3caH1047R embryos were lysed and (c) Gli1 or (d) Ptch1 mRNA levels quantified by qRT-PCR relative to Gapdh, bars represent mean ± SD, (c) n = 6,8, (d) n = 5 mice of each genotype, *p < 0.05 (two-sided Student’s t-test, (c) p = 0.0130, (d) p = 0.0365). E9.5 control and Pik3caH1047R embryos were lysed and (e) Axin2 or (f) Ccnd1 mRNA levels quantified by qRT-PCR relative to Gapdh, bars represent mean ± SD, (e) n = 4,5, (fn = 5 mice of each genotype, *p < 0.05, **p < 0.01 (two-sided Student’s t-test, (ep = 0.0113, (fp = 0.0059). Source data are provided as a Source Data file.
Fig. 2
Fig. 2. Cilia disassembly stimuli activate PI3K/AKT, MAPK, PKC and PKA signalling.
a Layout of experimental induction and analysis of serum starvation-induced cilia assembly and stimulation-induced cilia disassembly. b Experimental design and workflow of phosphoproteomic experiment in hTERT-RPE1 cells. Cells were serum-starved for 48 h and stimulated with 10% serum or 2 μM LPA ± 0.5 μM GDC-0941 for 15 min or 2 h and processed for phosphoproteomic analysis. 10067 phosphosites from 2937 proteins were analysed by MSstats, 427 phosphosites were significantly regulated which were used for comparison with cilia proteome databases and for KSEA (n = 5 independent experiments). c Venn diagram showing phosphosites regulated by serum or 2 μM LPA ± 0.5 μM GDC-0941 of 48 h serum-starved hTERT-RPE1 cells relative to DMSO. 10067 phosphosites were quantified by phosphoproteomics of which 427 were differentially regulated. Phosphosites in cilia-associated proteins (as defined by SYSCILIA version 2 or CiliaCarta) are listed. d Heatmap displaying phosphosites from cilia-associated proteins (as defined by SYSCILIA) regulated by 15 min or 2 h serum or 2  μM LPA stimulation ± 0.5 μM GDC-0941 in 48 h serum-starved hTERT-RPE1 cells relative to DMSO. e Heatmaps displaying KSEA (using the OmniPath, Edges and PhosphoSitePlus database) of kinases for which the substrate groups were differentially regulated by 15 min or 2 h serum or 2 μM LPA stimulation ± 0.5 μM GDC-0941 in 48 h serum-starved hTERT-RPE1 cells relative to DMSO. Kinases for which the adjusted p-values (using the Kolmogorov–Smirnov test, adjusted for multiple comparisons with Benjamini-Hochberg principle (5% FDR)) relative to DMSO control were less than p = 0.05 were considered significantly regulated.
Fig. 3
Fig. 3. Inhibition of PI3Kα or PI3Kβ impairs cilia disassembly in hTERT-RPE1 cells.
a Inhibitors used. b Cells were serum-starved for 48 h, pre-treated with inhibitors or DMSO for 1 h and stimulated with serum in the presence of inhibitors for 24 h. % ciliated cells was scored, bars: mean ± SD, 100 cells/condition for n = 3,4 independent experiments, *p < 0.05, ****p < 0.0001 (one-way ANOVA, p = 3.3 × 10−7). c Cells were serum-starved for 48 h, pre-treated with inhibitors or DMSO for 1 h and then stimulated with LPA or serum in the presence of inhibitors for 2 h. Lysates were immunoblotted with pAKT(S473), AKT and GAPDH antibodies, representative of n = 3 independent experiments. d Cells were serum-starved for 48 h, pre-treated with inhibitors or DMSO for 1 h and then stimulated with serum in the presence of inhibitors for 2 h. Cells were stained with ARL13B and pS6RP(S240/244) antibodies and DAPI and imaged by confocal microscopy, arrows: cilia, bar: 10 μm, cells with low pS6RP(S240/244) are indicated by a white outline. pS6RP(S240/244) MFI was measured in ciliated cells and presented as a histogram. n = 223–254 cells/condition from 3 independent experiments ****p < 0.0001 (Kruskal-Wallis test, p = 2.59 × 1053). e Cells were serum-starved for 48 h, pre-treated with inhibitors or DMSO for 1 h and then stimulated with LPA in the presence of inhibitors for 24 h. % ciliated cells was scored, bars indicate mean ± SD, 100 cells/condition for n = 3 independent experiment, *p < 0.05, **p < 0.01, ****p < 0.0001 (one-way ANOVA, p = 5.032 × 106). f Cells were serum-starved for 48 h, pre-treated with GSK2636771 or DMSO for 1 h and then stimulated with serum (left) or LPA (right) in the presence of inhibitors for 24 h. % ciliated cells was scored, bars: mean ± SD, 100 cells scored/condition for n = 6 (left), n = 5 (right) independent experiments, *p < 0.05, **p < 0.01, ***p < 0.001, ****p < 0.0001 (one-way ANOVA, left 1.06 × 10−6, right p = 0.0043). g Pik3ca+/+/Pik3ca-/- MEFs were serum-starved for 48 h, ± 24 or 48 h serum stimulation. % ciliated cells was scored, bars: mean±SD, 100 cells/condition for n = 3 independent experiments, *p < 0.05, **p < 0.01, ****p < 0.0001 (two-way ANOVA, left interaction p = 0.0155, row p = 2.072 × 10−6, column p = 0.2335, right interaction p = 0.00267, row p = 1.022 × 10−5, column p = 0.00598). Source data are provided as a Source Data file.
Fig. 4
Fig. 4. Basal ciliary PIP3 is produced by PI3Kβ in hTERT-RPE1 cells, with both PI3Kα and PI3Kβ contributing to the stimulus-induced ciliary PIP3 increase.
hTERT-RPE1 cells were serum-starved for 48 h and treated with BYL719, TGX-221, GDC-0941 or DMSO for 1 h. Cells were, stained with ARL13B and (a) PIP3 or (b) PI(3,4)P2 antibodies and DAPI and imaged by confocal microscopy, bar: 1 μm. PI MFI was measured, (a) n > 75 or (b) n = 54–55 cells/condition from 3 independent experiments *p < 0.05, **p < 0.01, ***p < 0.001, ****p < 0.0001 relative to DMSO control (Kruskal-Wallis test, (a) p = 8.440 × 10−21, (b) p = 1.30 × 10−4). hTERT-RPE1(Vector/PIK3CAH1047R) (c), MEFs (d) or hTERT-RPE1 (e) cells were serum-starved for 48 h (c) with doxycycline or (d, e) stimulated with 1938 or DMSO for 15 or 5 min. Cells were stained with ARL13B and PIP3 antibodies and DAPI and imaged by confocal microscopy, bar: 1 μm, arrowhead: ciliary PIP3. PIP3 MFI was measured, (c) n = 90, (d) n = 105 or (e) n = 131–133 cells/condition from 3 independent experiments *p < 0.05, **p < 0.01, ****p < 0.0001 (two-sided Kolmogorov-Smirnov test (c) p = 0.0042, (d) p = 5.907 × 10−10 (e) p = 0.0437). f MEFs(Pik3ca+/+/Pik3ca-/-) were serum-starved for 48 h and EGF stimulated for 2 h. Cells were stained with ARL13B and PIP3 antibodies and DAPI and imaged by confocal microscopy, bar: 1 μm. PIP3 MFI was measured, n = 80–85 cells/condition from 3 independent experiments **p < 0.01 relative to untreated control cells (Kruskal-Wallis test, p = 8.836 × 1013). MEFs were serum-starved for 48 h, treated with (g) BYL719, (h) TGX-221 or DMSO for 1 h and stimulated ± EGF for 2 h in the presence or absence of inhibitors. Cells were, stained with ARL13B and PIP3 antibodies and DAPI and imaged by confocal microscopy, bar: 1 μm. PIP3 MFI was measured, n = 90 cells/condition from 3 independent experiments ****p < 0.0001 relative to DMSO control (Kruskal-Wallis test, (g) p = 9.870 × 109, (h) p = 5.869 × 109). ah For all PI imaging experiments using different treatments, the laser intensity, gain and brightness were adjusted independently to optimise the dynamic range of the experiment and applied to all conditions within the experiment. To measure the ciliary PI MFI, for each cilium, a box of standardised size was placed at the base of the ARL13B demarked axoneme centred around the highest intensity PI pixel and MFI within the box measured and presented as a histogram.
Fig. 5
Fig. 5. PI3Kα activation initiates cilia disassembly.
a hTERT-RPE1(Vector/PIK3CAH1047R) cells were serum-starved for 48 h with doxycycline and treated ± BYL719 for the final 24 h. % ciliated cells was scored, bars indicate mean ± SD, 100 cells scored/condition for n = 3 independent experiments, **p < 0.01, ***p < 0.001 (two-way ANOVA, interaction p = 0.0017, row p = 9.117 x 105, column p = 0.0053). b hTERT-RPE1(Vector/PIK3CAH1047R) cells were treated with doxycycline for 48 h in complete media. % of ciliated cells was scored, bars indicate mean ± SD, 100 cells scored/condition for n = 4 independent experiments, *p < 0.05 (two-sided Student’s t-test, p = 0.0108). c hTERT-RPE1(Vector/PIK3CAH1047R) cells were treated with doxycycline for 24 h in complete media then serum starved for up to 48 h. Cilia length was measured, line: mean, cilia from ≥13 cells/condition for n = 3 independent experiments. d MEFs were serum-starved for 48 h and stimulated with 1938 or DMSO for 24 h. % ciliated cells was scored, bars indicate mean ± SD, 100 cells scored/condition for n = 3 independent experiments, *p < 0.05 (one-way ANOVA, p = 0.0167). e hTERT-RPE1 cells were serum-starved for 48 h and stimulated with serum, 1938 or DMSO for up to 24 h. Left, cells immunoblotted with pAKT(S473), AKT and GAPDH antibodies, blots representative of n = 3 independent experiments. Right, % of ciliated cells was scored, bars: mean ± SD, 100 cells/condition for n = 3 independent experiments, *p < 0.05, **p < 0.01, ****p < 0.0001 (one-way ANOVA, post hock test relative to DMSO treatment at each time point, 2 h p = 0.0026, 4 h p = 0.0013, 8 h p = 0.0011, 24 h p = 1.533 × 105). f BPH1 cells were treated with BKM120 for 8 h, stained with acetylated tubulin and γ tubulin antibodies and DAPI, bar: 10 μm, arrows: cilia. Right, % ciliated cells was scored. Bars represent mean ± SD, ≥ 237 cells from 20 micrographs pooled from 3 independent experiments, ****p < 0.0001 (two-sided Student’s t-test p = 8.588 × 105). g BPH1 cells were treated with BKM120 for 8 h and cell cycle distribution assessed by flow cytometry of propidium iodide-stained cells. Bars: mean ± SD, n = 3 independent experiments, *p < 0.05, (two-way ANOVA, interaction p = 0.0013, row p = 0.0012, column p = 0.7914). h A549 cells were serum-starved for 72 h ± BYL719, TGX-221, GDC-0941 or DMSO and % ciliated cells scored, bars: mean ± SD, 100 cells/condition for n = 4 independent experiments, **p < 0.01 (one-way ANOVA, p = 0.0007). i A549(PIK3CA+/+/PIK3CA-/-) cells were serum-starved for 24 h and % ciliated cells scored, bars represent mean ± SD, 100 cells scored/condition for n = 3 independent experiments, *p < 0.05 (two-sided Student’s t-test p = 0.0379). Source data are provided as a Source Data file.
Fig. 6
Fig. 6. PI3Kα signalling induces CEP170 phosphorylation and PKCι activation.
a, b Phosphoproteomic analysis of hTERT-RPE1 cells serum-starved for 24 h and stimulated with 1938 or insulin ± BYL719 for 15 min (p-value calculated using the group comparison function within MSstats and adjusted using the Benjamini-Hochberg procedure, n = 5 independent experiments). a Volcano plot of phosphosites differentially regulated by 1938 or insulin ± BYL719 relative to DMSO-treated cells. Numbers in the top corners indicate numbers of phosphosites significantly up- or down-regulated relative to DMSO b Log2(FC) of pCEP170(S466), bars: mean ± SD, *p < 0.05 (1938 vs DMSO p = 0.01438, insulin vs DMSO p = 0.04240). c Sequence alignment of human and mouse CEP170(S466/S463). HEK293 cells were transfected with HA-CEP170 or HA-CEP170(S466D) plasmids, serum-starved for 48 h, fixed and stained with HA and (d) pericentrin or (e) ARL13B antibodies and DAPI, bar: 10 μm, arrows indicate centrosomes, arrowheads: cilia axonemes. d Representative of n = 3 independent experiments. e The % of ciliated transfected cells was scored, bars: mean ± SD, ≥21 transfected cells scored/condition for n = 3 independent experiments, *p < 0.05 (two-sided Student’s t-test, p = 0.0221). f, g KSEA (OmniPath) of kinases for which the substrate groups are differentially regulated by 15 min or 4 h 1938 or Insulin stimulation ± BYL719 in 24 h serum-starved hTERT-RPE1 cells relative to DMSO. As few phosphosites were altered by 1938 or insulin treatment, kinases for which the raw p-values relative to DMSO (using the Kolmogorov–Smirnov test) relative to DMSO control were p < 0.05 were considered significantly regulated. f Heatmap. g Venn diagram showing overlap of kinases differentially regulated in KSEA (OmniPath vs Edges vs PhosphoSitePlus database). h In vitro kinase assay for purified recombinant PKCι kinase domain (phosphorylated at activation loop and turn motif priming sites) with β-PSS positive control (pseudosubstrate sequence of PKCβ, with alanine mutated to phosphoacceptor serine, containing the PKCι recognition motif; Phenylalanine at -5 and Arginine at -3 with respect to the phospho-acceptor) and CEP170(S466) peptides, bars represent mean ± SD, n = 3 technical replicates, data representative of 2 independent experiments. Source data are provided as a Source Data file.
Fig. 7
Fig. 7. PDK1, PKCι, CEP170 and KIF2A drive cilia loss induced by PI3Kα activation.
hTERT-RPE1(Vector/PIK3CAH1047R) cells were serum-starved for 48 h with doxycycline and treated ± (a) GSK2334470, (b) MK2206 or (c) 229 for the final 24 h, or transfected with non-targeted control, (d) siPRKCI, (e) siCEP170 or (f) siKIF2A, fixed, stained with ARL13B and pericentrin antibodies and DAPI and the % ciliated cells scored, bars: mean ± SD, 100 cells scored/condition for n = 3 independent experiments, *p < 0.05, **p < 0.01, ***p < 0.001 ****p < 0.0001 (two-way ANOVA (a) interaction p = 0.0002, row factor p = 0.0002, column factor p = 0.0003, (b) interaction p = 0.0336, row factor p = 0.0006, column factor p = 0.0092, (c) interaction p = 0.002, row factor p = 1.196 × 105, column factor p = 7.744 × 10−4, (d) interaction p = 0.0018, row factor 4.962 × 10−5, column factor p = 0.4681, (e) interaction p = 0.0295, row factor p = 5.185 × 105, column factor p = 0.0295, (f) interaction p = 0.0403, row factor p = 0.0002, column factor p = 0.0264). g hTERT-RPE1(Vector/PIK3CAH1047R) cells were serum-starved for 48 h with doxycycline and treated with BYL719, TGX-221, GDC-0941, GSK2334470, MK2206, 229 or DMSO. Cells were fixed, stained with ARL13B and pericentrin antibodies and DAPI and the % ciliated cells scored, bars: mean ± SD, 100 cells scored/condition for n = 3 independent experiments, ***p < 0.001, ****p < 0.0001 (one-way ANOVA, p = 3.217 × 107). h hTERT-RPE1 cells were serum-starved for 48 h, pre-treated with BYL719, TGX-221, GDC-0941, GSK2334470, MK2206, 229 or DMSO for 1 h and then stimulated with serum in the presence of inhibitors for 24 h. Left, cells were fixed, stained with ARL13B and pericentrin antibodies and DAPI and the % ciliated cells scored, bars: mean ± SD, 100 cells scored/condition for n = 5 independent experiments, *p < 0.05, **p < 0.01, ***p < 0.001, ****p < 0.0001 (one-way ANOVA, p = 2.092 × 109). Right, cells were lysed and immunoblotted with pAKT(S473), AKT and GAPDH antibodies, blots representative of n = 3 independent experiments. i Model for PI3K/PIP3-driven regulation of cilia disassembly. Source data are provided as a Source Data file.

References

    1. Anvarian, Z., Mykytyn, K., Mukhopadhyay, S., Pedersen, L. B. & Christensen, S. T. Cellular signalling by primary cilia in development, organ function and disease. Nat. Rev. Nephrol.15, 199–219 (2019). - PMC - PubMed
    1. Wheway, G. & Mitchison, H. M. Opportunities and Challenges for Molecular Understanding of Ciliopathies-The 100,000 Genomes Project. Front Genet.10, 127 (2019). - PMC - PubMed
    1. Lovera, M. & Lüders, J. The ciliary impact of nonciliary gene mutations. Trends Cell Biol.31, 876–887 (2021). - PubMed
    1. Hua, K. & Ferland, R. J. Primary cilia proteins: ciliary and extraciliary sites and functions. Cell Mol. Life Sci.75, 1521–1540 (2018). - PMC - PubMed
    1. Guadiana, S. M. et al. Arborization of dendrites by developing neocortical neurons is dependent on primary cilia and type 3 adenylyl cyclase. J. Neurosci.33, 2626–2638 (2013). - PMC - PubMed

LinkOut - more resources