. 2024 Aug 21;15(1):7154.
doi: 10.1038/s41467-024-51328-3.

Limb reduction in an Esco2 cohesinopathy mouse model is mediated by p53-dependent apoptosis and vascular disruption

Affiliations

Limb reduction in an Esco2 cohesinopathy mouse model is mediated by p53-dependent apoptosis and vascular disruption

Arielle S Strasser et al. Nat Commun. .

Abstract

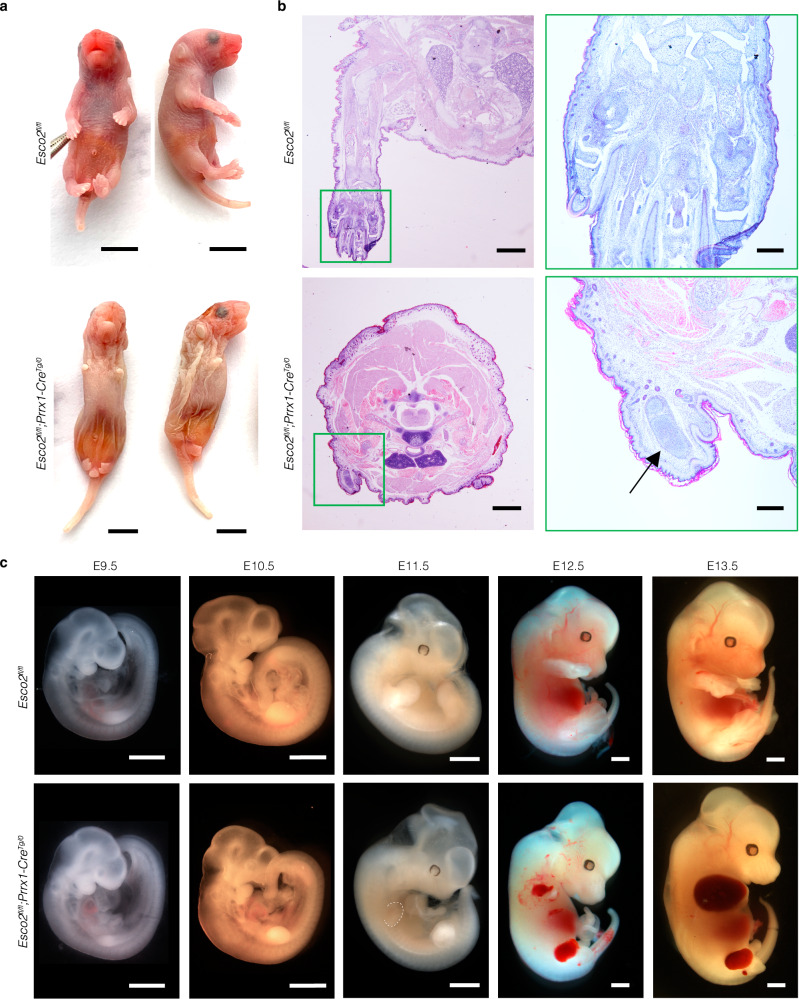
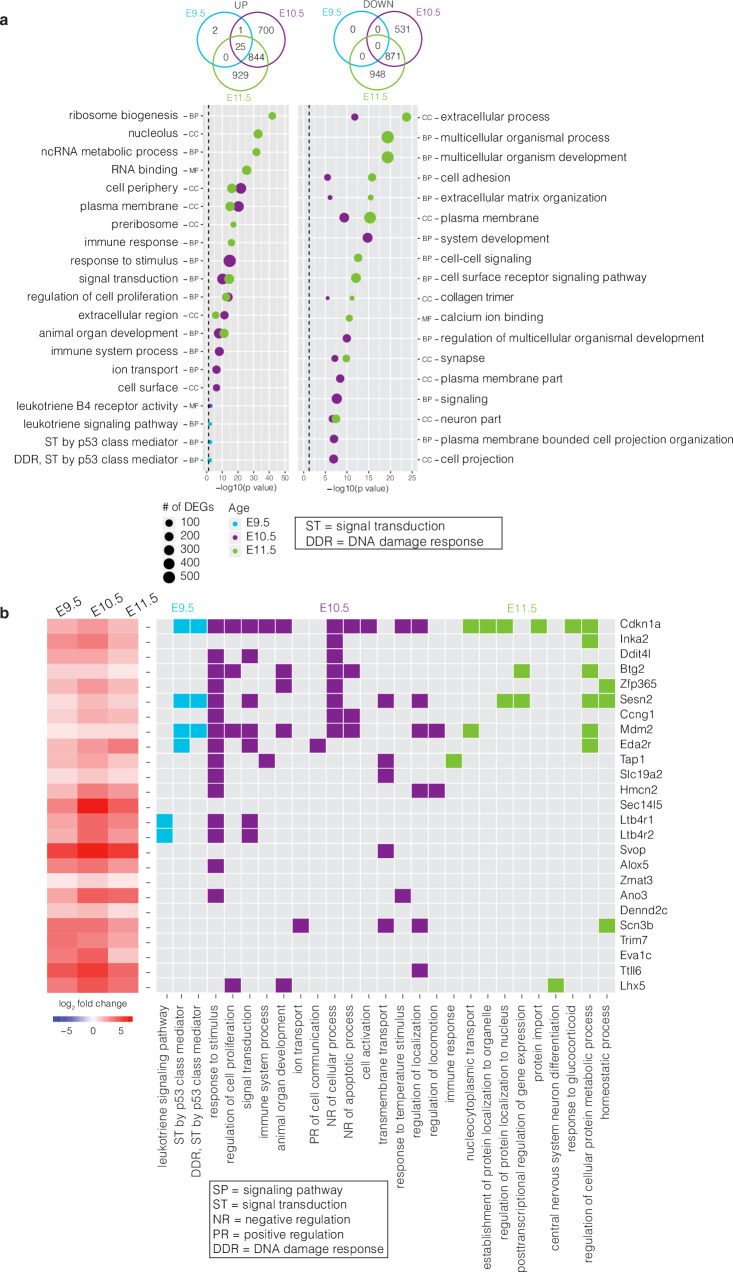
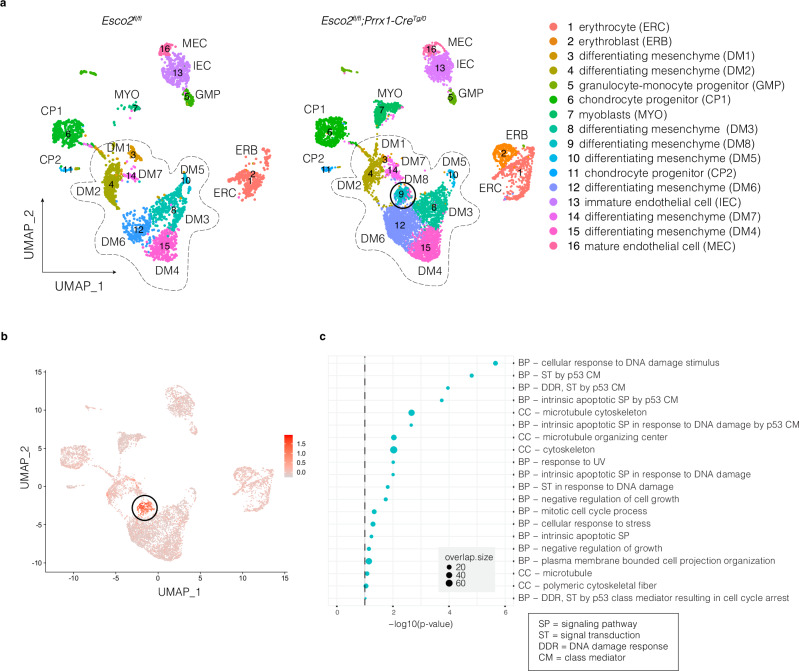
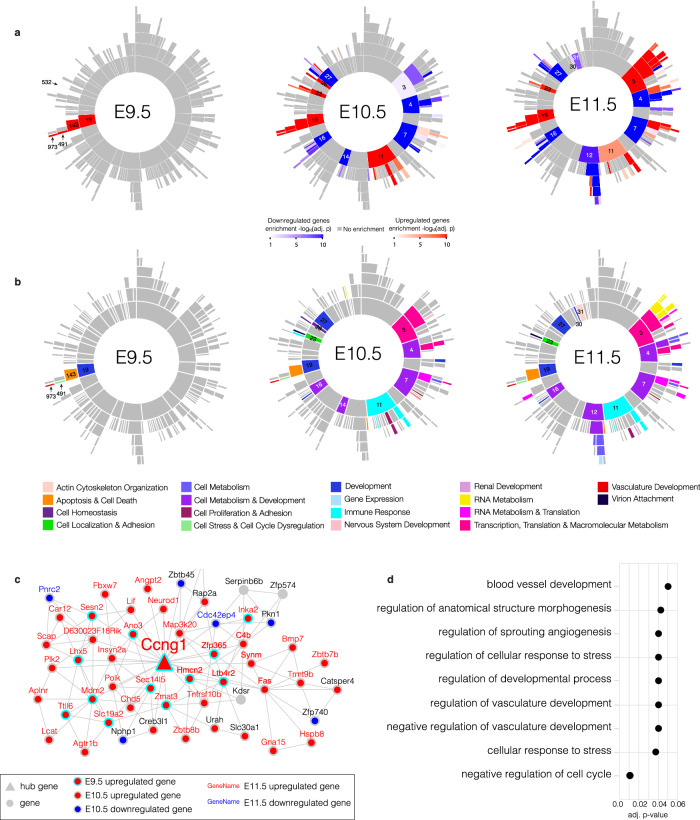
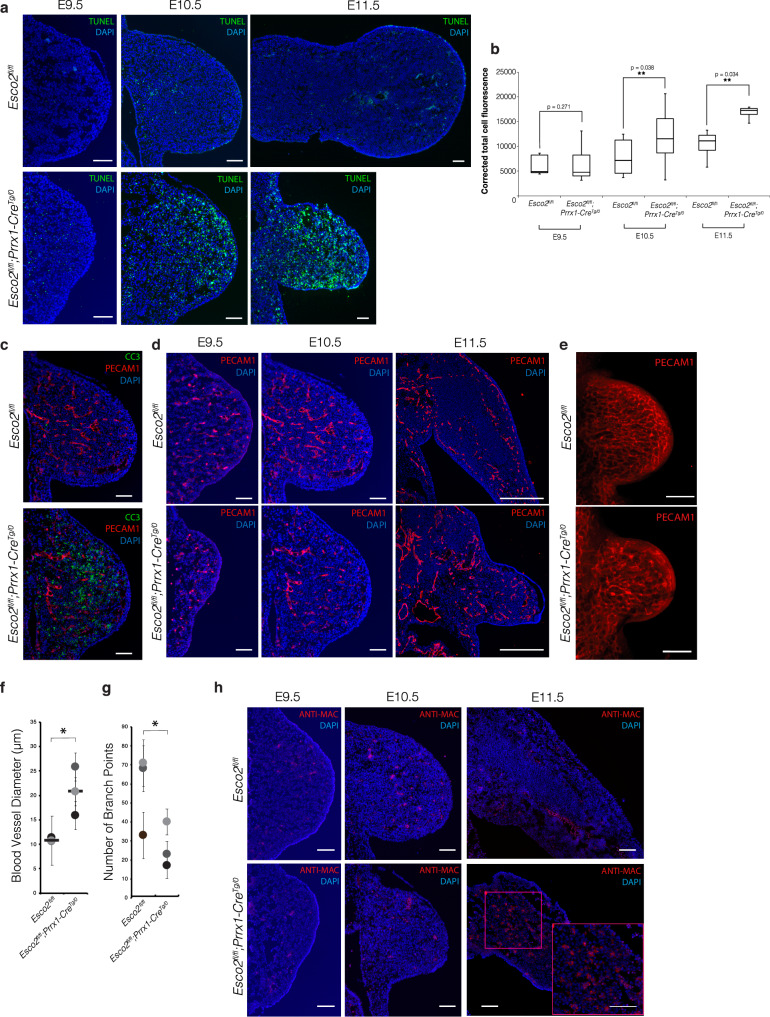
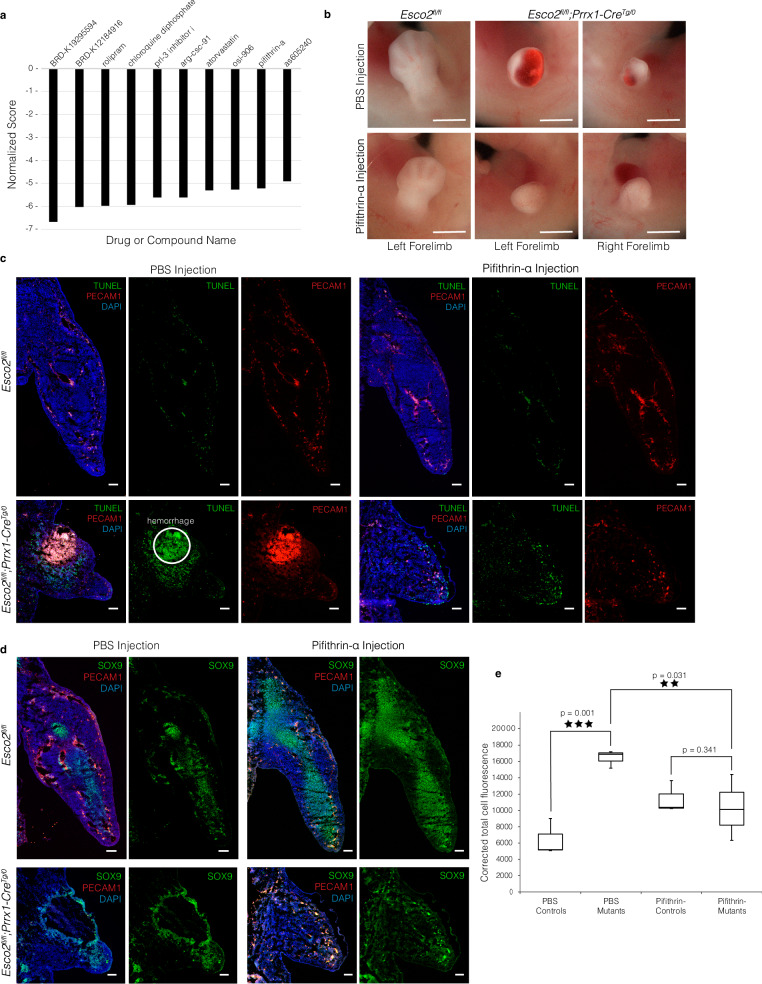
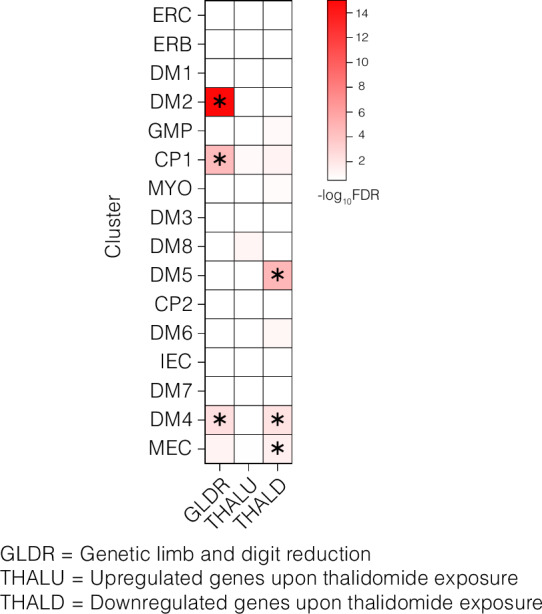
Roberts syndrome (RBS) is an autosomal recessive disorder with profound growth deficiency and limb reduction caused by ESCO2 loss-of-function variants. Here, we elucidate the pathogenesis of limb reduction in an Esco2fl/fl;Prrx1-CreTg/0 mouse model using bulk- and single-cell-RNA-seq and gene co-expression network analyses during embryogenesis. Our results reveal morphological and vascular defects culminating in hemorrhage of mutant limbs at E12.5. Underlying this abnormal developmental progression is a pre-apoptotic, mesenchymal cell population specific to mutant limb buds enriched for p53-related signaling beginning at E9.5. We then characterize these p53-related processes of cell cycle arrest, DNA damage, cell death, and the inflammatory leukotriene signaling pathway in vivo. In utero treatment with pifithrin-α, a p53 inhibitor, rescued the hemorrhage in mutant limbs. Lastly, significant enrichments were identified among genes associated with RBS, thalidomide embryopathy, and other genetic limb reduction disorders, suggesting a common vascular etiology among these conditions.


Conflict of interest statement

The authors declare no competing interests.

Figures

Fig. 1
Fig. 1. Esco2fl/fl;Prrx1-CreTg/0 mouse model of Roberts syndrome.
a P0 mice in dorsal and lateral views with indicated genotypes. Mutant mice present with phocomelia and craniofacial abnormalities including skull flattening and micrognathia. Scale bar: 5000 µm. b Hematoxylin and eosin (H&E) staining of coronal sections of Esco2fl/fl (n = 3) and Esco2fl/fl;Prrx1-CreTg/0 (n = 3) forelimbs displayed in Fig. 1a. Scale bar: 1000 µm. Higher magnification of control and mutant forelimbs in outlined green boxes. Arrow points to islands of disorganized chondrocytes and palely amphophilic chondroid matrix. Humeral, radial, and ulna bones are unidentifiable in mutant compared to control pups. Scale bar: 5000 µm. c Gross morphology of E9.5–E13.5 embryos post-harvesting with indicated genotypes. Notably smaller limbs with hemorrhaging in mutant compared to control embryos. Dashed white line outlines E11.5 forelimb with edema. Scale bar: 1000 µm.
Fig. 2
Fig. 2. Bulk RNA-seq profiling of Esco2fl/fl and Esco2fl/fl;Prrx1-CreTg/0 developing limbs from E9.5-E11.5.
a Venn diagram (top) and gene ontology (GO) enrichment (bottom) for upregulated (left) and downregulated (right) DEGs at E9.5 (blue), E10.5 (purple), and E11.5 (green). Gene Ontology enrichment analysis was performed with a p-value ranked query and multiple testing correction by the g:SCS method (p ≤ 0.05). Dashed line indicates the threshold of significance (0.05). BP, Biological Process; CC, Cellular Compartment; MF, Molecular Function. b Heatmap of the average expression changes (log2 fold change) of the 25 overlapping upregulated genes across the three ages. Gene names are to the right of the matrix and GO terms below.
Fig. 3
Fig. 3. Single-cell RNA-seq characterization of Esco2fl/fl and Esco2fl/fl;Prrx1-CreTg/0 clusters at E9.5.
a Uniform Manifold Approximation and Projection (UMAP) plot of cell clusters detected by unsupervised graph clustering of cell populations from Esco2fl/fl (left) and Esco2fl/fl;Prrx1-CreTg/0 (right) limb buds. b UMAP of the 25 marker genes expressed in DM8 that intersect with the DEGs identified in the bulk RNA-seq data at E9.5. c Gene ontology (GO) enrichment for upregulated and downregulated markers in DM8. Gene Ontology enrichment analysis was performed with a p-value ranked query and multiple testing correction by the g:SCS method (p ≤ 0.05). Dashed line indicates the threshold of significance (0.05).
Fig. 4
Fig. 4. Multi-scale embedded gene co-expression network analysis from E9.5-E11.5.
a Sunburst plots of the MEGENA based on bulk RNA-seq data from Esco2fl/fl and Esco2fl/fl;Prrx1-CreTg/0 limb buds from E9.5-E11.5. The inner most ring represents the root and largest parent modules, which branch off in hierarchical fashion to smaller child modules. Color intensity of red (upregulated) or blue (downregulated) is proportional to −log10(corrected FET p-value). Significant correlations between gene pairs were identified using the Pearson method with FDR < 0.05. b Sunburst plots with significant modules colored according to the most significantly enriched GO BP from E9.5-E11.5. c Module 973 (M973) from E9.5-E11.5. Hub genes and genes are marked by triangles and circles, respectively. Upregulated genes at E9.5 are marked by a red circle with a cyan border. Up- and down-regulated genes at E10.5 are marked by a red or blue circle with a gray border, respectively. Up- or down-regulated genes at E11.5 are marked by red or blue gene names, respectively. Gray circles are genes that are not enriched for DEGs. Hub gene name for Ccng1 is enlarged. d GO enrichment for BPs of M973 (adj. p-values ≤ 0.05). Gene set enrichment was performed against using Fisher’s exact test and Bonferroni correction to account for multiple hypothesis testing.
Fig. 5
Fig. 5. In vivo validation of differential gene expression from bulk and single-cell RNA-seq analysis.
a TUNEL assay of Esco2fl/fl limb buds (n = 3) and Esco2fl/fl;Prrx1-CreTg/0 limb buds (n = 3) from E9.5-E11.5 in the coronal plane. Scale bar: 100 µm. b Corrected total cell fluorescence (CTCF) of TUNEL+ signal between Esco2fl/fl and Esco2fl/fl;Prrx1-CreTg/0 limbs at E9.5, E10.5 and E11.5. n = 4 for Esco2fl/fl and Esco2fl/fl;Prrx1-CreTg/0 limb buds at E9.5, n = 5 for each genotype at E10.5, and n = 2 for each genotype at E11.5. In each box plot, the center line indicates the median, the edges of the box represent the first and third quartiles, and the whiskers extend to span a 1.5 interquartile range from the edges. Asterisk indicates a significant difference using a one-tailed, Student’s t-test (p ≤ 0.05; p = 0.271, p = 0.038, p = 0.034 for E9.5, E10.5, and E11.5 respectively). c Immunofluorescent staining of Esco2fl/fl (n = 3) and Esco2fl/fl;Prrx1-CreTg/0 (n = 3) limb buds at E10.5 (coronal plane) with cleaved-caspase 3 (CC3) and PECAM1. All samples were co-stained with DAPI. Scale: 100 µm. d Immunofluorescent staining of Esco2fl/fl (n = 3) and Esco2fl/fl;Prrx1-CreTg/0 (n = 3) limb buds at E9.5 (coronal plane), E10.5 (coronal plane) and E11.5 (transverse plane) with PECAM1. All samples were co-stained with DAPI. Scale: 200 µm. e Whole mount immunofluorescent staining of Esco2fl/fl and Esco2fl/fl;Prrx1-CreTg/0 limb buds at E10.5. Scale: 20 mm. f Average blood vessel diameter (µm) of Esco2fl/fl (n = 3) and Esco2fl/fl;Prrx1-CreTg/0 (n = 3) limb buds at E10.5. Littermate pairs are color matched by gray-scale. Data shown are the average measurements from each sample with mean ± SD. Black bar indicates median. Asterisk indicates a significant difference using a one-tailed, Student’s t-test (p ≤ 0.05; p = 0.013). g Number of branch points per sample of Esco2fl/fl (n = 3) and Esco2fl/fl;Prrx1-CreTg/0 (n = 3) limb buds at E10.5. Littermate pairs are color matched by gray-scale. Data shown are the total measurements from each sample with mean ± SD. Asterisk indicates a significant difference using a one-tailed, Student’s t-test (p ≤ 0.05; p = 0.047). h Immunofluorescent staining of Esco2fl/fl (n = 3) limb buds and Esco2fl/fl;Prrx1-CreTg/0 (n = 3) limb buds from E9.5–E11.5 with Anti-macrophage in the coronal plane. Scale: 100 µm. All samples were co-stained with DAPI. Magenta box delineates region with high density of macrophages, magnified in bottom right corner. Source data for 5b, 5f, and 5 g are provided with this paper.
Fig. 6
Fig. 6. Rescue of hemorrhage in Esco2fl/fl;Prrx1-CreTg/0 limbs by pifithrin-α treatment.
a Bar chart of normalized scores for top 10 drug candidates identified by EMUDRA. Drugs are ranked by score with more negative values indicating stronger association. b Gross morphology of Esco2fl/fl;Prrx1-CreTg/0 and Esco2fl/fl embryonic limb buds at E12.5 treated with either PBS (top) or pifithrin-α (bottom). Scale bar: 1 mm. c TUNEL assay co-stained with PECAM1 of Esco2fl/fl (n = 3) and Esco2fl/fl;Prrx1-CreTg/0 (n = 3) limbs treated with PBS (left) or pifithrin-α (right) at E12.5 in the transverse plane. Scale bar: 100 µm. d Immunofluorescent staining of Esco2fl/fl (n = 3) and Esco2fl/fl;Prrx1-CreTg/0 (n = 3) limbs treated with PBS (left) or pifithrin-α (right) for SOX9 and PECAM1 at E12.5 in the transverse plane. Scale: 100 µm. e Box and whisker plot showing the corrected total cell fluorescence (CTCF) of TUNEL+ signal between Esco2fl/fl (n = 3) and Esco2fl/fl;Prrx1-CreTg/0 (n = 3) limbs treated with PBS or pifithrin-α. In each box plot, the center line indicates the median, the edges of the box represent the first and third quartiles, and the whiskers extend to span a 1.5 interquartile range from the edges. Asterisk indicates a significant difference using a one-tailed, Student’s t-test (p ≤ 0.05; p = 0.001 for PBS comparisons, p = 0.341 for pifithrin-α comparisons, and p = 0.031 for Esco2fl/fl;Prrx1-CreTg/0 comparisons between PBS and pifithrin-α groups). Source data are provided with this paper.
Fig. 7
Fig. 7. Cluster marker enrichment for human genetic limb reduction disorders and thalidomide embryopathy genes.
Heatmap of -log10FDR. Each row represents a single cell cluster, and each column represents a gene list associated with downregulated genes that cause genetic limb reduction disorders (GLRD), and upregulated (THALU) or downregulated (THALD) genes associated with thalidomide exposure. Significantly enriched clusters are asterisked (p ≤ 0.05). P-values for enrichment were determined with a one-sided Fisher’s exact test, with Bonferroni correction for multiple testing.

References

    1. Skibbens, R. V. et al. Cohesinopathies of a feather flock together. PLoS Genet9, e1004036 (2013). 10.1371/journal.pgen.1004036 - DOI - PMC - PubMed
    1. Banerji, R., Skibbens, R. V. & Iovine, M. K. How many roads lead to cohesinopathies? Dev. Dyn.246, 881–888 (2017). 10.1002/dvdy.24510 - DOI - PubMed
    1. McNairn, A. J. & Gerton, J. L. Cohesinopathies: one ring, many obligations. Mutat. Res–Fund. Mol. M.647, 103–111 (2008).10.1016/j.mrfmmm.2008.08.010 - DOI - PubMed
    1. Piché, J., Van Vliet, P. P., Pucéat, M. & Andelfinger, G. The expanding phenotypes of cohesinopathies: one ring to rule them all! Cell Cycle18, 2828–2848 (2019). 10.1080/15384101.2019.1658476 - DOI - PMC - PubMed
    1. Kantaputra, P. N. et al. Juberg-Hayward syndrome is a cohesinopathy, caused by mutation in ESCO2. Eur. J. Orthod.43, 45–50 (2021). 10.1093/ejo/cjaa023 - DOI - PubMed

MeSH terms

Supplementary concepts