. 2024 Aug 21;15(1):7121.
doi: 10.1038/s41467-024-51447-x.

The effects of ENDOG on lipid metabolism may be tissue-dependent and may not require its translocation from mitochondria

Affiliations

The effects of ENDOG on lipid metabolism may be tissue-dependent and may not require its translocation from mitochondria

Marta Llovera et al. Nat Commun. .
No abstract available


Conflict of interest statement

The authors declare no competing interests.

Figures

Fig. 1
Fig. 1. Altered lipid distribution and accumulation associated with ENDOG deficiency in different tissues and cellular contexts: comparative of data from Wang et al. and our laboratory.
a In Fig. 1a, Wang et al. show TEM images of liver preparations from Endog+/- and Endog-/- mice fasted for 24 h. LD: lipid droplets; N: nucleus. b Bodipy lipid staining of livers from Endog+/- and Endog-/- mice from Wang et al., Fig. 1e. c Differences in triglyceride accumulation between ENDOG-deficient (KO) HepG2 cells and wild type (WT) cells were calculated using the source data from Wang et al., Fig. 1i of cells in control conditions (CT) and cells cultured in the presence of 200 µmol/L oleic acid (OA); bars: SD. Unpaired t-test p = 0.109. d Oil Red O staining of myocardial histological preparations from adult Endog+/+ and Endog-/- mice in the same C56BL/6 genetic background as Wang et al., fed standard diet. e Oil Red O lipid staining of hepatic histological preparations from Endog+/+ and Endog-/- adult mice. f Bodipy immunofluorescence images of lipid in livers of Endog+/+ and Endog-/- adult mice (Bodipy lipid staining, green; Hoechst nuclear staining, blue), bar size = 20 µm.
Fig. 2
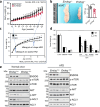
Fig. 2. Comparison of body weight gain and white adipose tissue depot size between high-fat diet (HFD)-fed animals from Wang et al. and normal diet-fed mice from our lab.
Characterization of the mTORC2-AKT-ACLY lipogenic pathway by Wang et al. emphasizes the role of ENDOG expression in pathway activation, independently of the diet. a Body weight follow-up of adult Endog+/- and Endog-/- female mice during a 14-week period feeding a high-fat diet (HFD) shown in Wang et al., Fig. 3a. b Inguinal white adipose tissue (iWAT) depots and WAT weight at the end of the HFD period from Wang et al., Fig. 3c, d. c Body weight progression of Endog+/+ (WT) and Endog-/- (KO) male mice reproduced from Pardo et al. with permission from the Publisher. Arrows indicate the age range during which Wang’s HFD experiment took place. d Tissue weights of 4–5 months old Endog+/+ (WT) and Endog-/- (KO) male mice. e In Supplementary Fig. S24, Wang et al. show western blot images from livers of Endog+/- and Endog-/- female mice fed a control diet or HFD, comparing phosphorylated and total protein abundance of the mTOR/AKT/ACLY pathway.
Fig. 3
Fig. 3. Analysis of the experimental evidences provided by Wang et al. on ENDOG protein exit from mitochondria after oleic acid exposure of the HepG2 cell line.
a Wang et al. Western blot of cytosolic and mitochondrial extracts from HepG2 after being treated with 200 μmol/L oleic acid for 24 h (Fig. 4d) and source file of the long ENDOG exposure (ENDOG antibody from Cell Signaling Technology, Cat: #4969), b Wang et al. western blots of subcellular fractions of HepG2 cells including cells pretreated with 20 μMVBIT-12 (VDAC inhibitor) for 4 h and then treated with 200 μM oleic acid for 24 h from Fig. 7b. S, short time exposure; L, long time exposure and source file of the long exposure to detect ENDOG for comparison. *At similar band intensity in mitochondrial extracts (Mito.), no cytosolic ENDOG is observed. Yellow arrow: approximate size of ENDOG. Blue arrows: bands behaving as the band identified as ENDOG. c Immunofluorescence images of HepG2 cells stained with the mitochondrial marker TIM23 and ENDOG from Wang et al., Fig. 4f using an ENDOG antibody (Novus Biological NBP1-76657), whose specificity is not assessed. Yellow square signals punctuated green staining interpreted by the authors as ENDOG translocation to the cytoplasm (CT, control conditions; OA, 200 µmol/L Oleic acid, 24 h).

Similar articles

References

    1. Wang, W. et al. Cytoplasmic endonuclease G promotes nonalcoholic fatty liver disease via mTORC2-AKT-ACLY and endoplasmic reticulum stress. Nat. Commun.14, 6201 (2023). 10.1038/s41467-023-41757-x - DOI - PMC - PubMed
    1. Côté, J. & Ruiz-Carrillo, A. Primers for mitochondrial DNA replication generated by endonuclease G. Science261, 765–769 (1993). 10.1126/science.7688144 - DOI - PubMed
    1. Tomkinson, A. E. & Linn, S. Purification and properties of a single strand-specific endonuclease from mouse cell mitochondria. Nucleic Acids Res.14, 9579–9593 (1986). 10.1093/nar/14.24.9579 - DOI - PMC - PubMed
    1. Li, L. Y., Luo, X. & Wang, X. Endonuclease G is an apoptotic DNase when released from mitochondria. Nature412, 95–99 (2001). 10.1038/35083620 - DOI - PubMed
    1. Bahi, N. et al. Switch from caspase-dependent to caspase-independent death during heart development: Essential role of endonuclease G in ischemia-induced DNA processing of differentiated cardiomyocytes. J. Biol. Chem.281, 22943–22952 (2006). 10.1074/jbc.M601025200 - DOI - PubMed

LinkOut - more resources