. 2024 Aug 21;15(1):7169.
doi: 10.1038/s41467-024-51286-w.

Altered assembly paths mitigate interference among paralogous complexes

Affiliations

Altered assembly paths mitigate interference among paralogous complexes

Chi-Wei Yeh et al. Nat Commun. .

Abstract

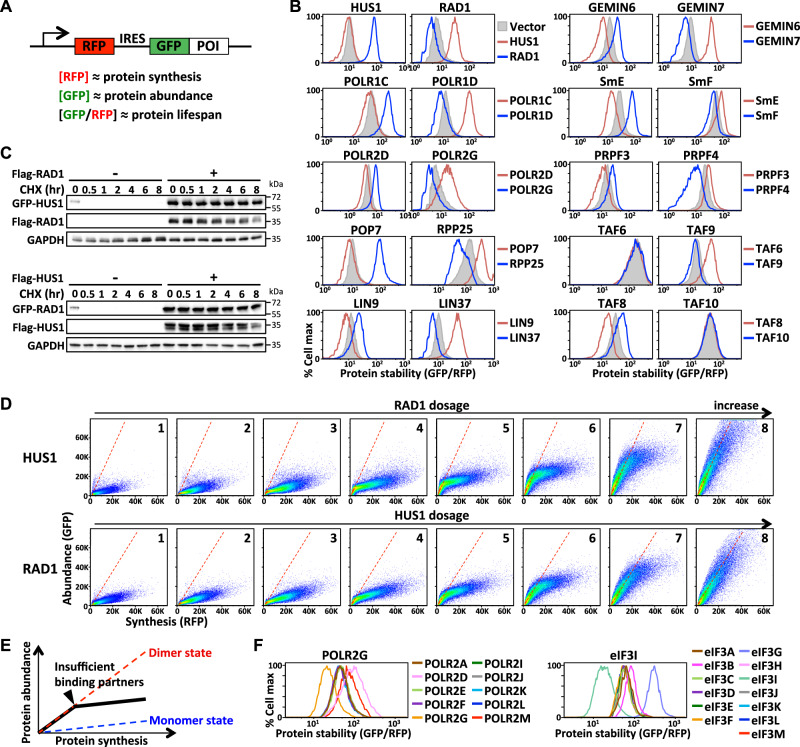
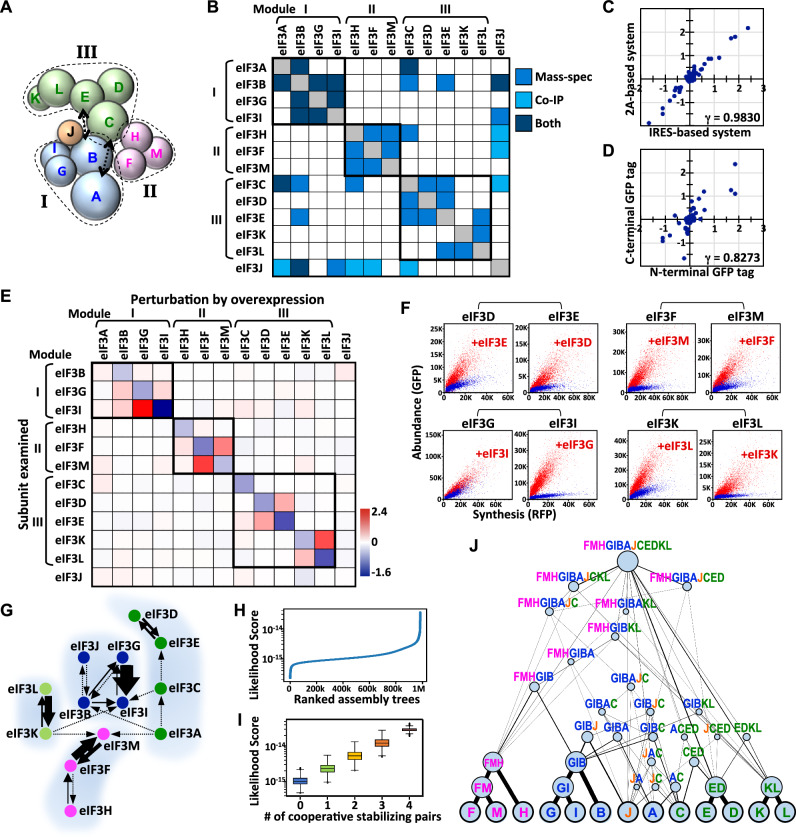
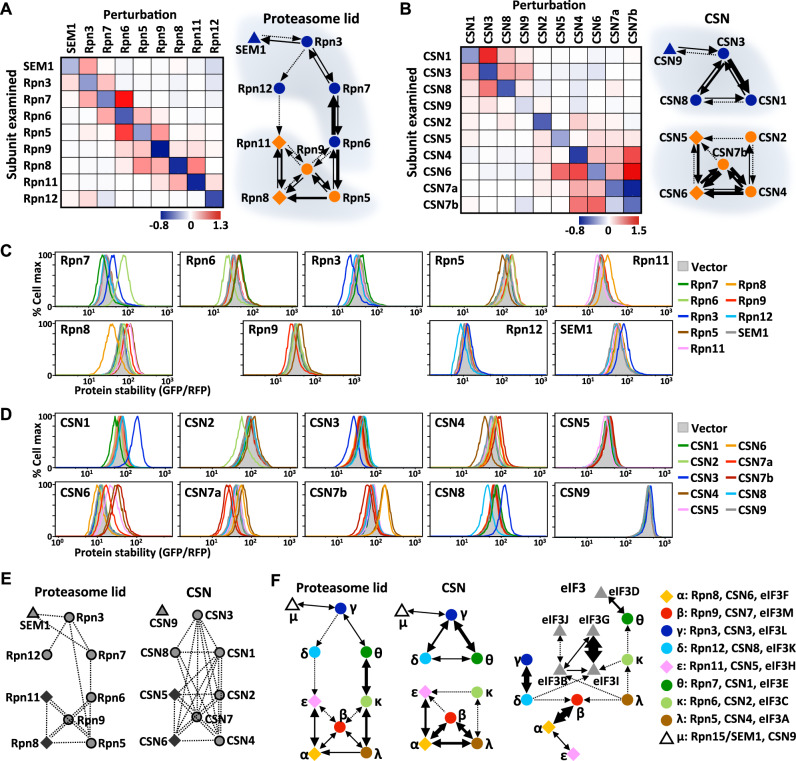
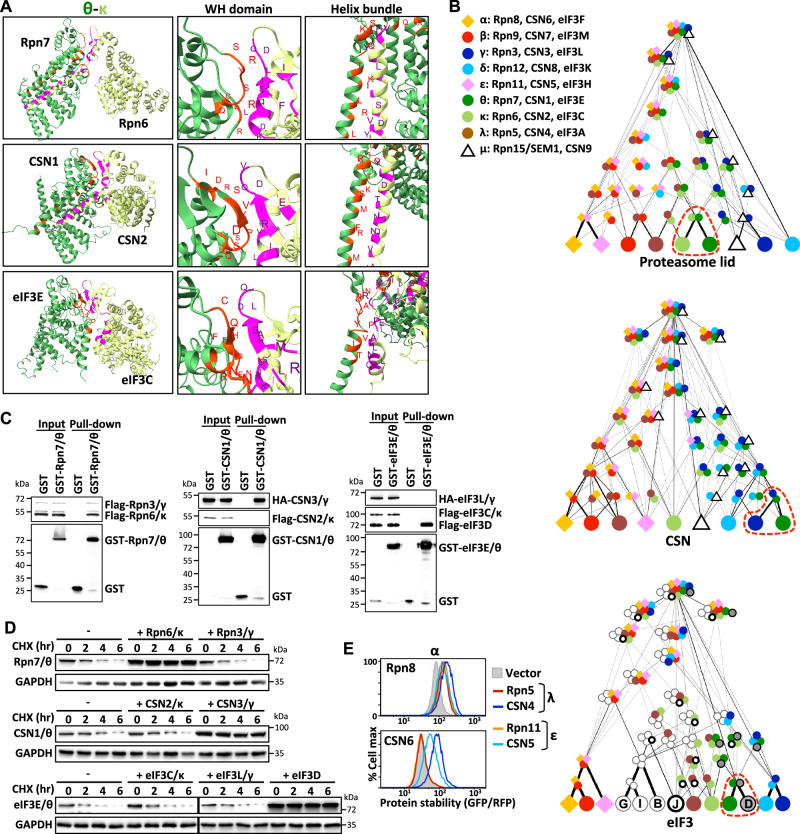
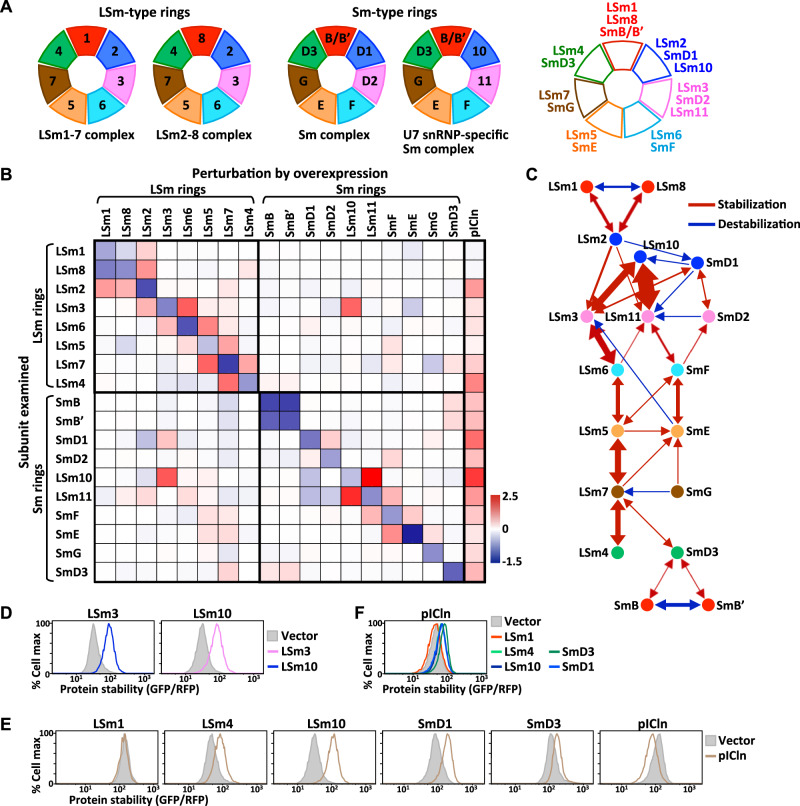
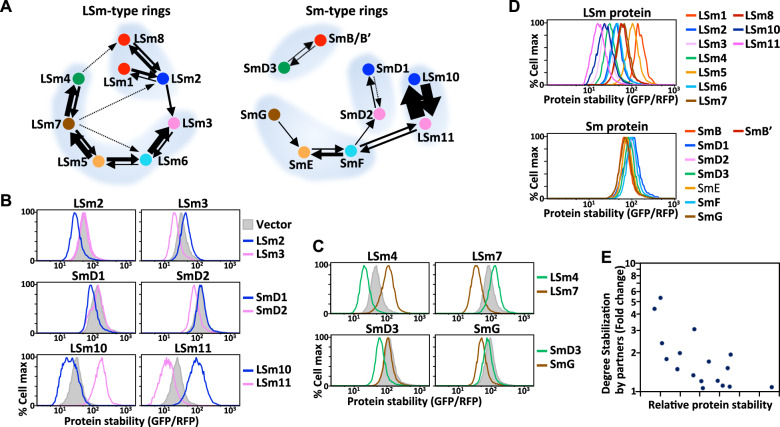
Protein complexes are fundamental to all cellular processes, so understanding their evolutionary history and assembly processes is important. Gene duplication followed by divergence is considered a primary mechanism for diversifying protein complexes. Nonetheless, to what extent assembly of present-day paralogous complexes has been constrained by their long evolutionary pathways and how cross-complex interference is avoided remain unanswered questions. Subunits of protein complexes are often stabilized upon complex formation, whereas unincorporated subunits are degraded. How such cooperative stability influences protein complex assembly also remains unclear. Here, we demonstrate that subcomplexes determined by cooperative stabilization interactions serve as building blocks for protein complex assembly. We further develop a protein stability-guided method to compare the assembly processes of paralogous complexes in cellulo. Our findings support that oligomeric state and the structural organization of paralogous complexes can be maintained even if their assembly processes are rearranged. Our results indicate that divergent assembly processes by paralogous complexes not only enable the complexes to evolve new functions, but also reinforce their segregation by establishing incompatibility against deleterious hybrid assemblies.


Conflict of interest statement

The authors declare no competing interests.

Figures

Fig. 1
Fig. 1. Cooperative stabilization interactions are prevalent among proteins that form a stable complex.
A A schematic depiction of the GPS reporter system. The fluorescent signal intensities of RFP, GFP, and the GFP/RFP ratio represent proxies for measuring the protein synthesis, abundance, and stability, respectively, of the protein of interest (POI). B GPS analysis of the proteins labeled above the plots co-expressing the proteins labeled at right. C Cycloheximide (CHX)-chase analysis of HUS1 (top panel) or RAD1 (bottom panel) with/without RAD1 or HUS1 co-expression, respectively. GAPDH serves as a loading control. Blots are representative of three independent experiments. D The synthesis-abundance relationships of HUS1 (top panel) and RAD1 (bottom panel) in response to increasing dosages of RAD1 and HUS1 co-expression (plot 1 to plot 8), respectively, as measured by FACS. Each dot represents data from a single cell. Red dashed lines indicate the expected synthesis-abundance relationship when RAD1 and HUS1 form a heterodimer. E A schematic diagram illustrating the nonlinear synthesis-abundance correlation of a subunit due to an inadequate supply of stabilizing partners. The biphasic profile (black line) represents the differential stability of assembled and free subunits. F GPS analysis of POLR2G and eIF3I with co-expression of indicated RNA polymerase II and eIF3 subunits, respectively. Source data are provided as a source data file.
Fig. 2
Fig. 2. Inferring the eIF3 assembly process based on cooperative stabilization interactions.
A Model of eIF3 subunit architecture based on dissociation and mass spectrometry analyses. Subunits of modules I, II, and III are colored blue, magenta, and green, respectively. Black arrows denote physical interactions not readily presented in this model. B The eIF3 physical interaction map according to the available literature. Different detection methods (shown at right) are colored differently. C, D Correlation analyses for results generated from IRES- versus 2A-based GPS systems, and N- versus C-terminal GFP-tagged eIF3 subunits. Data points represent fold-changes in protein stability (GFP/RFP ratio). E The eIF3 subunit stability connectivity map, as measured by the IRES-based GPS system. The matrix heatmap represents a log2-fold-change in the value of protein stability (GFP/RFP ratio) for the eIF3 subunit indicated on the left in response to overexpressing the eIF3 subunit indicated on top. F The synthesis-abundance correlation of the eIF3 subunit indicated on top with (red) or without (blue) providing the eIF3 subunit indicated on the plot. G Louvain network modularity analysis of data shown in (E). Arrows represent stabilization interactions. X→Y indicates that X stabilizes Y, whereas X↔Y denotes that X and Y mutually stabilize each other. The thickness of the arrows is proportional to the intensity of protein stabilization. Subunits in the same network cluster are shown in the same color and surrounded by a light gray shadow. H The score distribution for all possible binary eIF3 assembly trees. I Correlation analysis between likelihood scores and the presence of intermediate subcomplexes formed by cooperative stabilization partners (eIF3D-E, G-I, F-M, K-L). The box plots illustrate the 25th and 75th percentiles, and the whiskers extend to 1.5 times of the interquartile range (IQR). Horizontal lines within the box plots represent medians. Outliers are plotted as individual points. The number of points for each box plot from left to right, are 357,194,157,953, 66,973,726,080, 5,272,663,680, 211,003,200, and 3,752,640, respectively. J DAG presentation of the top 1000 ranked binary eIF3 assembly trees. The thickness of lines and the size of circles are proportional to the likelihood. Source data are provided as a source data file.
Fig. 3
Fig. 3. Cooperative stabilization network rewiring in PCI complexes.
A, B The protein stability-based interaction map of the proteasome lid (A) and CSN (B) complexes. Louvain network modularity analysis of the data is shown on the right. Proteins with PCI or MPN domains or without these domains are denoted as circles, diamonds, or triangles, respectively. C, D Protein stability analysis of the subunit indicated on the plot upon supplying the subunit indicated at right. E A schematic to summarize the inter-subunit physical associations in the proteasome lid and CSN complexes identified by previous mass spectrometry analyses and co-immunoprecipitation experiments. F Cooperative stabilizing network topologies for the three PCI complexes. Paralogous subunits are represented in the same color and denoted according to the Latin alphabet indicated at left. Arrows denote directional cooperative stabilization interactions, with line thickness proportionally reflecting the intensity of protein stabilization. Source data are provided as a source data file.
Fig. 4
Fig. 4. Divergent assembly strategies adopted by PCI complexes.
A The binding interface between the θ and κ subunits of PCI complexes (PDB: 5L4K, 4D10, 6YBD). Residues of the θ and κ subunits involved in the binding interface are labeled red and magenta, respectively. B Comparison of the assembly process of PCI complexes based on their cooperative stabilization interactions. The assembly process of each complex is presented as a DAG, in which nodes are subunits/subcomplexes and edges are interactions between two partners. The edges have been weighted according to the frequencies at which they occurred within the top-ranking assembly trees. Red dashed circles mark the preferred assembly partner of the θ subunit at the initial assembly step. C GST pull-down analysis of the θ (Rpn7/CSN1/eIF3E) subunit of the proteasome lid, CSN and eIF3 complexes. Blots are representative of three independent experiments. D CHX-chase analysis of the θ (Rpn7/CSN1/eIF3E) subunits with/without κ (Rpn6/CSN2/eIF3C), γ (Rpn5/CSN4/eIF3A) or eIF3D co-expression. GAPDH serves as a loading control. Blots are representative of three independent experiments. E Cross-complex interactions between α and λ or ε paralogs. Source data are provided as a source data file.
Fig. 5
Fig. 5. Protein stability connectivity map of LSm and Sm proteins.
A Schematic depiction of the subunit arrangement of the LSm- and Sm-type complexes. Paralogous proteins are represented by the same colors. The paralogous relationships between LSm and Sm proteins are indicated at right. B The protein stability-based interaction map of LSm/Sm proteins. The matrix heatmap represents log2-fold-change in protein stability of the protein indicated at left upon overproducing the protein indicated on top. LSm/Sm subunits are ordered according to the complex they are associated with and the subunit arrangement in the corresponding complex shown in (A). C A network diagram depicting the entire LSm/Sm protein stability-based interaction network, in which nodes are subunits and edges are interactions between two partners. Paralogous proteins are shown in the same colors. Positive/stabilization or negative/destabilization interactions are indicated as red or blue arrows, respectively. X→Y indicates that supplying X stabilizes/degrades Y, whereas X↔Y denotes that X and Y are mutually stabilizing/degrading. The thickness of the arrow lines is weighted according to the degree of interaction. D Protein stability analysis of LSm3 and LSm10 by GPS assays. E Protein stability analysis of proteins indicated on top with or without providing pICln. F Protein stability analysis of pICln with or without co-expressing the LSm/Sm proteins indicated at right. Source data are provided as a source data file.
Fig. 6
Fig. 6. Divergence of protein stability-guided modularity in LSm- and Sm-type complexes.
A Louvain two-nearest-neighbor analysis of LSm- and Sm-type complexes based on data shown in Fig. 5B. Nodes of the same color denote paralogous proteins, and black arrows represent directional cooperative stabilization interactions. The thickness of the arrow lines proportionally reflects the degree of protein stabilization. Subunits forming the same network cluster are surrounded by a light gray shadow. B, C Comparison of paralogous interactions within LSm and Sm complexes in terms of cooperative stabilization. Protein stability analysis by GPS assay of proteins indicated on top with or without co-expressing the proteins indicated at right. D Comparison of protein stability among various LSm and Sm proteins upon their low-level expression (from a single copy of the GPS reporter). GFP was tagged at the C-termini of LSm/Sm proteins. E Correlation analysis between the stability of unassembled LSm/Sm proteins and their degrees of stabilization by corresponding partners.

Similar articles

Cited by

References

    1. Pereira-Leal, J. B., Levy, E. D., Kamp, C. & Teichmann, S. A. Evolution of protein complexes by duplication of homomeric interactions. Genome Biol.8, R51 (2007). 10.1186/gb-2007-8-4-r51 - DOI - PMC - PubMed
    1. Mallik, S., Tawfik, D. S. & Levy, E. D. How gene duplication diversifies the landscape of protein oligomeric state and function. Curr. Opin. Genet. Dev.76, 101966 (2022). 10.1016/j.gde.2022.101966 - DOI - PMC - PubMed
    1. Szklarczyk, R., Huynen, M. A. & Snel, B. Complex fate of paralogs. BMC Evol. Biol.8, 337 (2008). 10.1186/1471-2148-8-337 - DOI - PMC - PubMed
    1. Mallik, S. & Tawfik, D. S. Determining the interaction status and evolutionary fate of duplicated homomeric proteins. PLoS Comput. Biol.16, e1008145 (2020). 10.1371/journal.pcbi.1008145 - DOI - PMC - PubMed
    1. Kuzmin, E., Taylor, J. S. & Boone, C. Retention of duplicated genes in evolution. Trends Genet.38, 59–72 (2022). 10.1016/j.tig.2021.06.016 - DOI - PMC - PubMed

LinkOut - more resources