. 2024 Aug 22;15(1):7205.
doi: 10.1038/s41467-024-51611-3.

Time-of-day effects of cancer drugs revealed by high-throughput deep phenotyping

Affiliations

Time-of-day effects of cancer drugs revealed by high-throughput deep phenotyping

Carolin Ector et al. Nat Commun. .

Abstract

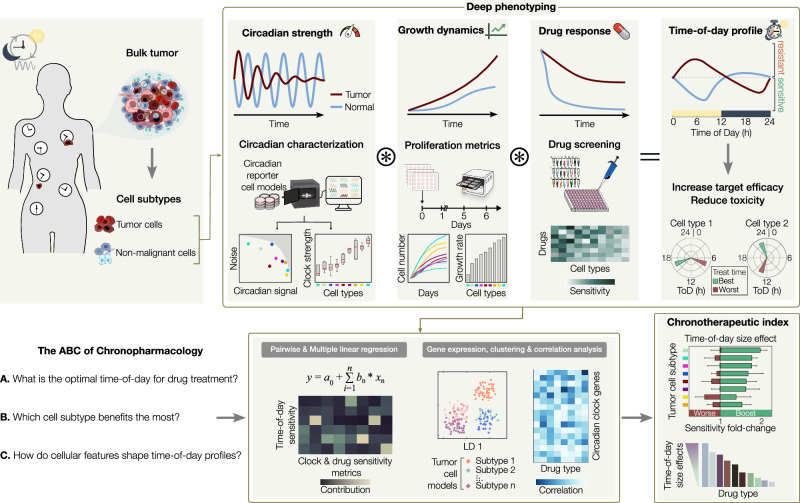
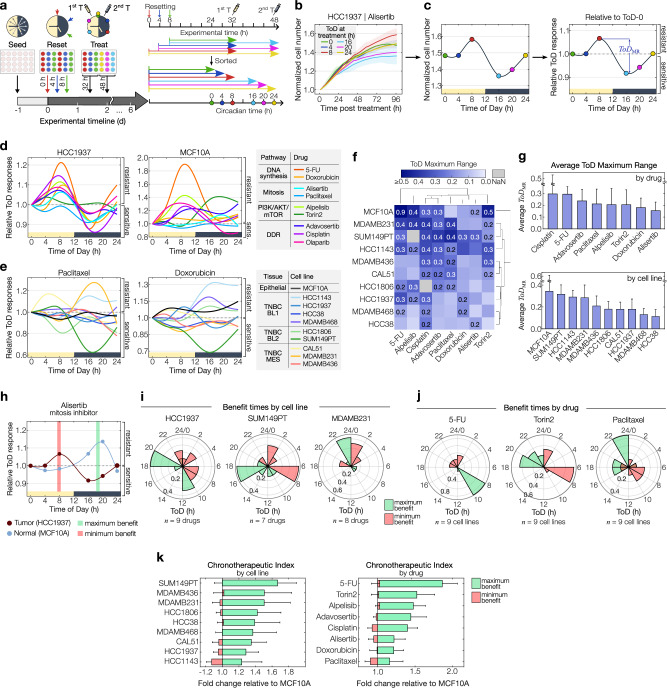
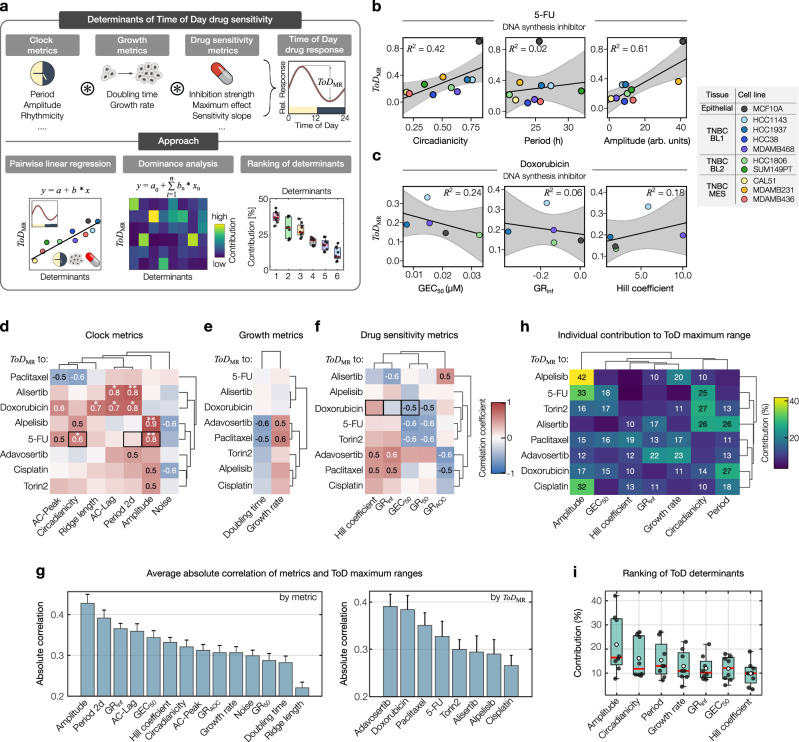
The circadian clock, a fundamental biological regulator, governs essential cellular processes in health and disease. Circadian-based therapeutic strategies are increasingly gaining recognition as promising avenues. Aligning drug administration with the circadian rhythm can enhance treatment efficacy and minimize side effects. Yet, uncovering the optimal treatment timings remains challenging, limiting their widespread adoption. In this work, we introduce a high-throughput approach integrating live-imaging and data analysis techniques to deep-phenotype cancer cell models, evaluating their circadian rhythms, growth, and drug responses. We devise a streamlined process for profiling drug sensitivities across different times of the day, identifying optimal treatment windows and responsive cell types and drug combinations. Finally, we implement multiple computational tools to uncover cellular and genetic factors shaping time-of-day drug sensitivity. Our versatile approach is adaptable to various biological models, facilitating its broad application and relevance. Ultimately, this research leverages circadian rhythms to optimize anti-cancer drug treatments, promising improved outcomes and transformative treatment strategies.


Conflict of interest statement

The authors declare no competing interests.

Figures

Fig. 1
Fig. 1. Framework for identifying optimal treatment times in cancer and healthy tissue models.
Schematic of the experimental and computational framework to thoroughly characterize time-of-day drug responses in a variety of cell subtypes, such as cancer and non-malignant cell models. A combination of live recordings is implemented for the deep phenotyping of circadian strength, growth dynamics, and drug responses that shape time-of-day profiles. Using a novel streamlined experimental approach, time-of-day sensitivity profiles are obtained in tumor and non-malignant cell models, providing best and worst timings for increased efficacy and reduced toxicity (top panel). A tandem computational pipeline integrates the deep phenotyping metrics as well as gene expression data of circadian clock genes to quantitatively address three fundamental questions in chronopharmacology (bottom panel). Combining multiple signatures, we define a chronotherapeutic index, ranking cellular models and drug agents by their size-effect gains from drug treatments aligned with the circadian clock (bottom right panel).
Fig. 2
Fig. 2. Determining circadian clock strength in cancer and healthy tissue cell models.
a Schematic of the deep circadian phenotyping approach. b Simplified circadian feedback loops involving Bmal1 and Per2. c Raw and processed signals from MDAMB468-Bmal1/Per2-Luc cells. d Example of autocorrelation (AC) analysis. The arrow indicates 2nd peak and abscissa (lag). Dashed lines = 95% CI. e Boxplot of AC values and (f) lags of signals from various cell models. g Wavelet power spectrum (bottom) from continuous wavelet transform (CWT) showing time-resolved periods of detrended-amplitude-normalized signals from MDAMB468-Bmal1-Luc cells (top). Red line = main oscillatory component (ridge). h Boxplot of CWT ridge lengths from various cell models. Box bounds in (e, f, h) are defined by the 25th and 75th percentiles. Extending whiskers represent data points within 1.5 times the interquartile range from lower and upper quartiles. Red lines and crosses denote the median and outliers, respectively. n = 12 samples, collected from Bmal1-/Per2-reporters, with 6 samples per reporter (n = 2 biological replicates á technical triplicates or duplicates [HCC1806 Per2-Luc]). n = 6 for U-2 OS KO-lines (Bmal1-Luc-only) and MCF10A (single experiment). n = 9 for MDAMB468 (Per2-Luc: single experiment). n = 17 for SH-SY5Y (biological triplicates with technical triplicates or duplicates). i Multiresolution analysis (MRA) of detrended MDAMB468-Bmal1-Luc signal. % = fraction to signal. j Scatterplot of normalized MRA noise versus circadianicity components from the indicated cell models. The shaded area covers an unattainable range. Data represents the mean ± s.d. of multiple samples per reporter cell line (see above). k Bar diagram ranking cell models by global circadian strength, integrating min-max scaled parameters from AC (peak), CWT (ridge), and MRA (circadianicity) for Bmal1-Luc and, where applicable, Per2-Luc signals. Data represents mean ± s.d of scaled parameters (n = 6, except U-2 OS knockouts where n = 3 parameters). Only the positive s.d. is shown. Color coding in (bI, k) corresponds to Bmal1 (yellow) and Per2 (blue) reporters. Color coding of cell models in (e, f, h, j, k) corresponds to tissue origin. One-way ANOVA and Tukey’s post-hoc test compared U-2 OS WT and KO cell lines, where **, ***, and **** indicate p-values of 5.7 × 10−3, 4.8 × 10−4 and ≤ 0.0001, respectively. n.s. = non-significant. Source data for (ck) are provided as a Source Data file.
Fig. 3
Fig. 3. Unraveling growth and drug response dynamics through long-term live-cell imaging.
a Schematic of the experimental setup. NLS = nuclear localization sequence. b Snapshots of MDAMB468 growth in brightfield (top) and red-fluorescent channel (bottom). Ruler = 400 µM. c MDAMB468 confluency (black) and cell numbers (red) over time. d Normalized growth curves of indicated cell models. BL1, BL2, and MES refer to TNBC subtypes basal-like-1/-2, and mesenchymal-like, respectively. EP = epithelial. e Exponential fit (solid line) for MDAMB468 growth curves, yielding growth rate (k), and fit accuracy (R2). Dots represent normalized cell numbers averaged across 9 images taken per well. The shaded area represents the standard deviation. f Bar diagrams of doubling times and growth rates, sorted in descending order from highest to lowest growth rates. Parameters calculated from growth curves, averaged across 9 images taken per well (CAL51, HCC38, HCC1806, HCC1937, MDAMB231, MDAMB468), or across six control wells from later described time-of-day experiments. g Schematic of pathways targeted by drugs used in this study. h Cell numbers and growth rates of MDAMB468 cells treated with varying olaparib doses (color-coded) or solvent (dashed line). Data represents the mean±s.d. of two plates. i Dose-response curve of GR-values, highlighting various drug sensitivity metrics. The underlying data corresponds to the example shown in (h). Error bars=95% CI. j Normalized cell numbers of MDAMB468 treated with approximate GRinf doses of the indicated drugs. Data represents the mean ± s.d. of two plates or mean±s.e.m of 9 images taken on a single plate (cisplatin). km Hierarchical clustering of drug sensitivity parameters across cell-drug combinations. GEC50-values are shown relative to the approximate GRinf dose. n Pearson’s correlation coefficients of sensitivity parameters shown in (km) and additional combinations (Supplementary Data 1; n = 50 cell-drug combinations per parameter, except for EC50-values where n = 49 due to fitting constraints). Denoted are significant pairwise correlation coefficients (two-sided test with no adjustments made), where * indicate p-values of 0.03 (Hill coeff. vs. GRAOC) or 0.018 (Hill coeff. vs. GR50), **p-value of 0.0016, ***p-value of 0.0015, and ****p-values ≤ 0.0001. Data in (kn) is based on the mean of two plates, or 9 images taken per well on a single plate (cisplatin). Source data for (bf, hn) are provided as a Source Data file.
Fig. 4
Fig. 4. Time-of-day drug sensitivity is drug and tissue model dependent.
a Schematic of the experimental setup to screen for time-of-day (ToD) responses. Three clock-resetting steps are performed in 4-h intervals. Drugs are administered 32 or 48 hours post initial reset, resulting in six circadian times (0, 4, 8, 16, 20, 24 h). Growth is monitored by long-term live-cell imaging. Timelines on the right depict experimental (top) and relative circadian times (bottom), color-coded by each ToD tested. b Cell counts of HCC1937 treated with alisertib at different times of the day. Normalization to the respective time of treatment. c Cell numbers 4 days post-treatment versus treatment times, corresponding to (b) (left). ToD response curve (ToD-RC) depicting relative responses to ToD 0 h. Blue arrows mark the maximum ToD response range (ToDMR) (right). d ToD-RCs for HCC1937 (left) or MCF10A (right) cells treated with different drugs (color-coded). e ToD-RCs for 10 cell models treated with paclitaxel (left) or doxorubicin (right). Color coding of cell models according to tissue origin. f Hierarchical clustering of ToDMR-values across drug-cell combinations. Values above 0.2 are shown. Data clustering with the UPGMA method and Euclidian distance. g Bar diagrams ranking ToDMR-values per drug (top) and cell model (bottom). h ToD-RCs for alisertib-treated HCC1937 tumor and MCF10A non-tumor cells overlaid, yielding maximum and minimum benefit times. Data shown in (bh) represents the mean ( ± s.d.) of two plates. i Polar histograms for benefit times across cell models (n = 7–9 drugs, as indicated in the figure) and j, drugs (n = 9 cell models). k Butterfly charts depicting fold changes relative to MCF10A at benefit times, averaged per cancer cell model (left,) and drug (right). Color-coding of maximum and minimum benefit times is shown in (hk) in green and red, respectively. Data are shown in (g and k represents mean ± s.d. of tested cell models per drug (n = 9 cell models; alpelisib and cisplatin: n = 8) and vice versa (n = 8 drugs; HCC1806 and SUM149PT: n = 7). For clarity, one-sided error bars are shown. Source data for (bk are provided as a Source Data file.
Fig. 5
Fig. 5. Clock and drug sensitivity metrics shape ToD curves.
a Computational approach to investigate how circadian rhythms, cell growth dynamics, and drug sensitivity factors influence the time-of-day (ToD) drug efficacy. b and c Example of linear correlations between ToDMR and circadian (b) or drug sensitivity parameters (c), for 5-FU (n = 10 cell models) and cisplatin (n = 5 cell models), respectively. Color coding of cell models according to tissue origin. The central black line represents the regression line. Gray-shaded area = 95% CI of the linear regression fit. Model accuracy is indicated by R2-values. df Hierarchical clustering of Pearson correlation coefficients (r) between ToDMR-values of different drugs (rows) and the respective metric (columns) for clock strength (d, n = 10 cell models), growth (e, n = 10 cell models) or drug sensitivity (f, n = 5 cell models). r-values ≥ 0.5 and ≤ -0.5 are shown. Black rectangles indicate examples shown in (b and c). Significant pairwise correlations (two-sided test with no adjustments made) are indicated by stars, where *, and **, denote p-values ≤ 0.05 and 0.01, respectively. Exact p-values: Alisertib-AC-Lag = 0.011; Alisertib-Period-2d = 0.004; Doxorubicin-Ridgelength = 0.030; Doxorubicin-AC-Lag = 0.014; Doxorubicin-Period-2d = 0.012; Alpelisib-Amplitude = 0.002; 5-FU-Circadianicity = 0.044; 5-FU-Amplitude = 0.007. Note: sample size in (df) for alpelisib = n-1; and for cisplatin =9. g Bar diagrams ranking the absolute correlation between ToDMR-values, and each metric depicted in (df), ranked by metric (n = 8 drugs) or by drug (n = 14 metrics). Data represents the mean ± s.e.m. For clarity, one-sided error bars are shown. h Hierarchical clustering of the dominance analysis matrix showing the individual contribution of the circadian clock, growth, and drug sensitivity parameters (columns) in predicting drug-dependent ToDMR-values (rows). Colors indicate the percentage contribution, as detailed in the color bar. See key for d–f for sample sizes (n). i Boxplot of the overall contribution of cellular metrics to predict ToDMR-values, corresponding to (h). Box bounds are defined by the 25th and 75th percentiles. Extending whiskers represent data points within 1.5 times the interquartile range from lower and upper quartiles. Red lines denote the data’s median, and white circles the mean. Source data for b–i are provided as a Source Data file.
Fig. 6
Fig. 6. Gene expression analysis unveils diverse roles of circadian genes in determining time-of-day patterns.
a Approach to identify the role of core clock genes in determining the strength of time-of-day (ToD) drug sensitivity. b Hierarchical clustering of Spearman rank correlation coefficients between drug-dependent ToDMR-values (rows) and core clock genes (columns). Black boxes indicate examples shown in (c). Statistical significance of the correlations are indicated as stars, where * and **, denote p-values  ≤ 0.05 and 0.01, respectively. Exact p-values: Paclitaxel-Per3 = 0.002; Paclitaxel -Dbp = 0.030; Cisplatin-Dbp = 0.021; Torin2-Dbp = 0.036; 5-FU-Per2 = 0.050; Alpelisib-Bmal1 = 0.021; Alpelisib-Per2 = 0.047. Cisplatin and alpelisib: n = 8 cell lines, else n = 9 cell lines. c Example of linear correlation analysis between paclitaxel ToDMR-values and Per3 or Dbp expression levels measured as log2(TPM). Color-coded data points indicate different cancer cell models. The gray continuous line indicates the normal distribution fit of the samples. Gray-shaded area = 95% CI of the linear regression fit. Model accuracy is indicated by R2-values. Top and lateral histograms indicate the count of samples along the range of gene expression, and ToDMR-values, respectively. n = 9 cell lines. d Linear discriminant analysis (LDA) on median-based binarized ToDMR-values for paclitaxel. Cell models with ToDMR-values below or above the median (M) are colored in blue and red, respectively (middle and left panel). The contribution to the obtained discriminative information is shown in percentage for each of the circadian clock genes (right panel). e Boxplot showing the mean-based ranking of overall discriminative contributions of each circadian clock gene across all tested drugs. n = 8 drugs. Box bounds are defined by the 25th and 75th percentiles. Extending whiskers represent data points within 1.5 times the interquartile range from lower and upper quartiles. Red lines denote the data’s median, and white circles the mean. Source data for b–e are provided as a Source Data file.

References

    1. Chaix, A., Zarrinpar, A. & Panda, S. The circadian coordination of cell biology. J. Cell Biol.215, 15–25 (2016). 10.1083/jcb.201603076 - DOI - PMC - PubMed
    1. Zhang, R., Lahens, N. F., Ballance, H. I., Hughes, M. E. & Hogenesch, J. B. A circadian gene expression atlas in mammals: implications for biology and medicine. Proc. Natl. Acad. Sci. USA111, 16219–16224 (2014). 10.1073/pnas.1408886111 - DOI - PMC - PubMed
    1. Mure, L. S. et al. Diurnal transcriptome atlas of a primate across major neural and peripheral tissues. Science359, 10.1126/science.aao0318 (2018). - PMC - PubMed
    1. Saini, C. et al. A functional circadian clock is required for proper insulin secretion by human pancreatic islet cells. Diabetes Obes. Metab.18, 355–365 (2016). 10.1111/dom.12616 - DOI - PubMed
    1. Neufeld-Cohen, A. et al. Circadian control of oscillations in mitochondrial rate-limiting enzymes and nutrient utilization by PERIOD proteins. Proc. Natl. Acad. Sci. USA113, E1673–E1682 (2016). 10.1073/pnas.1519650113 - DOI - PMC - PubMed

MeSH terms

Substances

LinkOut - more resources