. 2024 Aug 21;15(1):7194.
doi: 10.1038/s41467-024-51402-w.

Palmitoylation of ULK1 by ZDHHC13 plays a crucial role in autophagy

Affiliations

Palmitoylation of ULK1 by ZDHHC13 plays a crucial role in autophagy

Keisuke Tabata et al. Nat Commun. .

Erratum in

Abstract

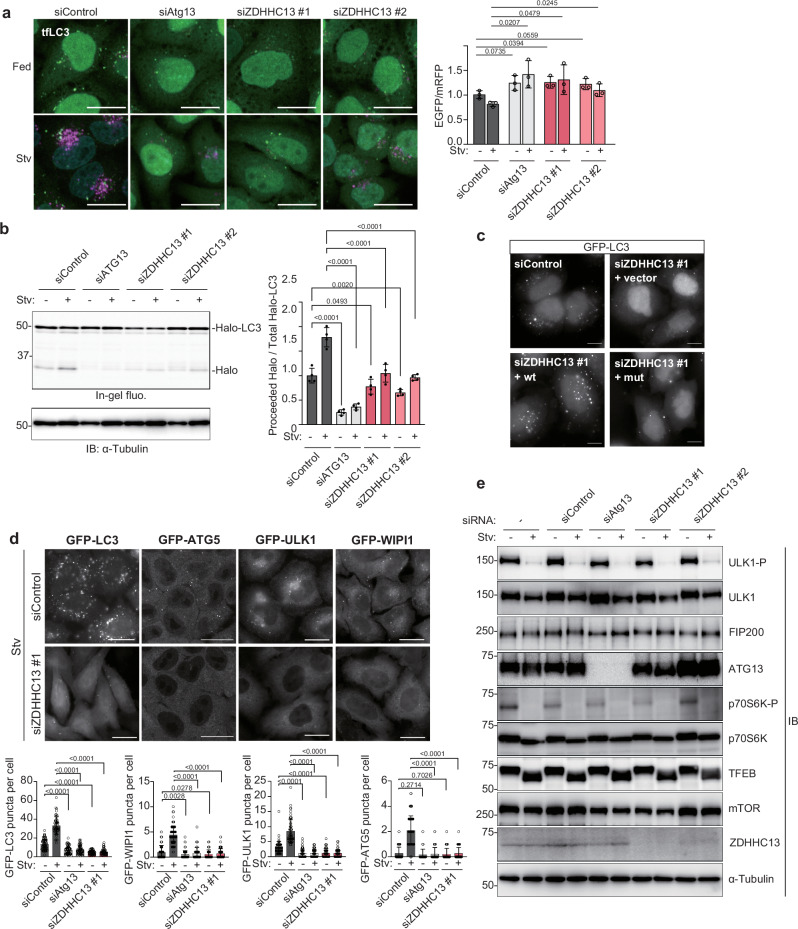
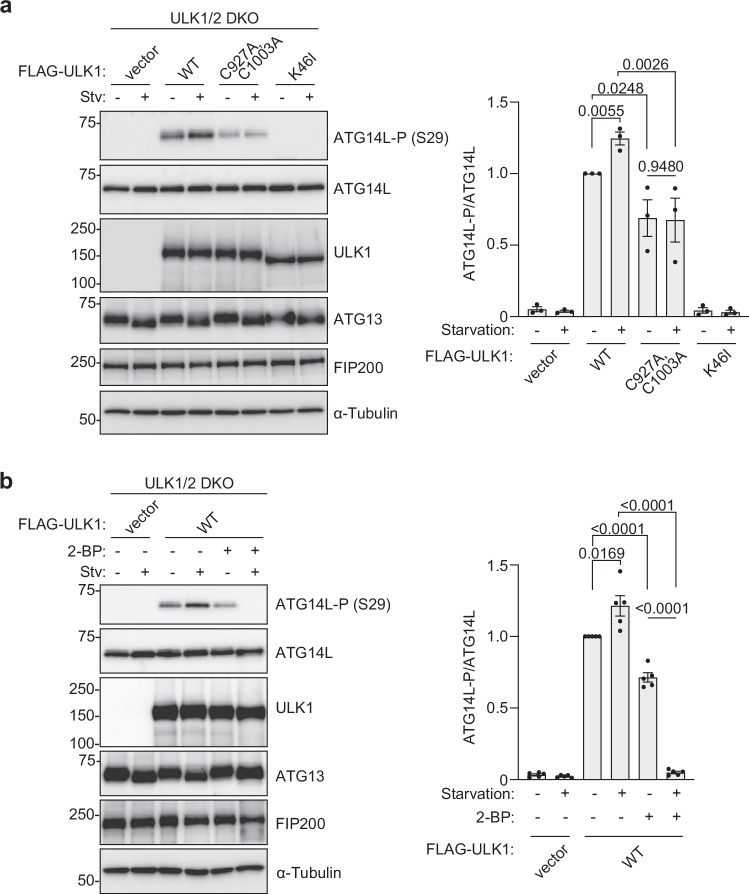
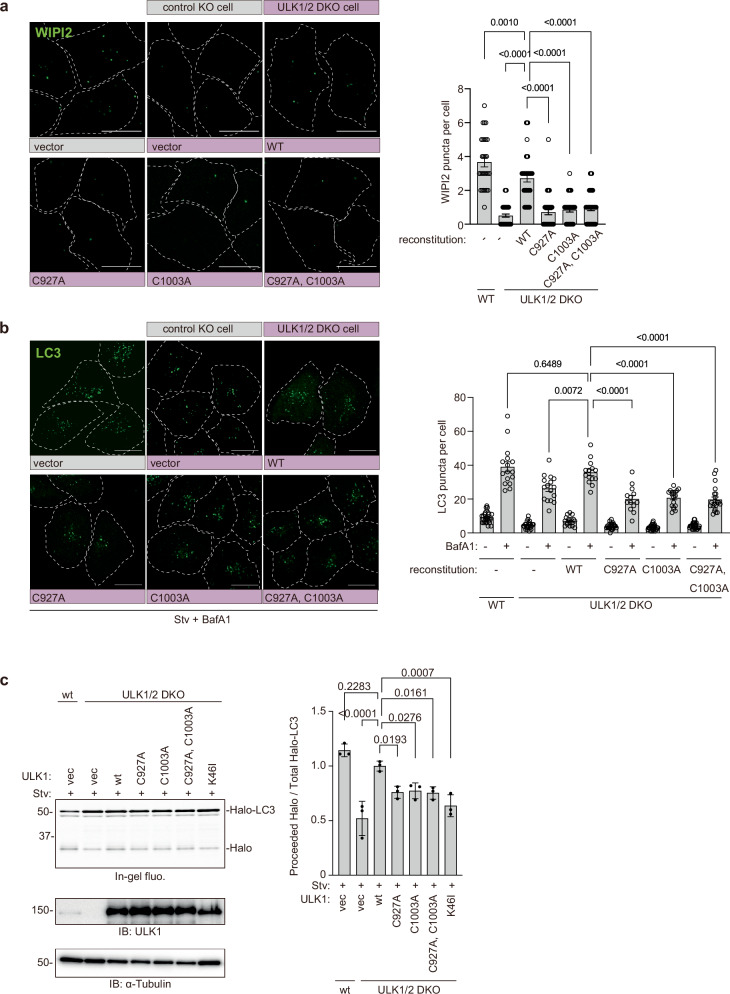
Autophagy is a highly conserved process from yeast to mammals in which intracellular materials are engulfed by a double-membrane organelle called autophagosome and degrading materials by fusing with the lysosome. The process of autophagy is regulated by sequential recruitment and function of autophagy-related (Atg) proteins. Genetic hierarchical analyses show that the ULK1 complex comprised of ULK1-FIP200-ATG13-ATG101 translocating from the cytosol to autophagosome formation sites as a most upstream ATG factor; this translocation is critical in autophagy initiation. However, how this translocation occurs remains unclear. Here, we show that ULK1 is palmitoylated by palmitoyltransferase ZDHHC13 and translocated to the autophagosome formation site upon autophagy induction. We find that the ULK1 palmitoylation is required for autophagy initiation. Moreover, the ULK1 palmitoylated enhances the phosphorylation of ATG14L, which is required for activating PI3-Kinase and producing phosphatidylinositol 3-phosphate, one of the autophagosome membrane's lipids. Our results reveal how the most upstream ULK1 complex translocates to the autophagosome formation sites during autophagy.


Conflict of interest statement

The authors declare no competing interests.

Figures

Fig. 1
Fig. 1. ZDHHC13 knockdown impaired autophagy at an early step.
a Monitoring autophagy flux in HeLa cells stably expressing tfLC3. The siRNA-treated cells were incubated in a growth medium (Stv: -) or starvation medium (EBSS, Stv: +) for 4 h. After fixation, EGFP/mRFP intensity was calculated from three independent experiments and shown as mean ± SD. Scale bars indicate 20 μm. A two-tailed unpaired t-test calculated significance. b In-gel fluorescence and Immunoblotting of total cell lysates from each knockdown cell stably expressing Halo-LC3. Cells were pulse-labeled for 20 min with TMR-conjugated ligands and incubated in a growth medium or starvation medium for 6 h. Representative images from immunoblotting are shown on the left. The graph is represented as mean ± SD from four experiments. Significance was calculated by one-way ANOVA. c HeLa cells stably expressing GFP-LC3 were transfected with siControl or siZDHHC13 and further transfected with a plasmid harboring siRNA-resistant ZDHHC13 wt or catalytic mutant (mut) the next day. After 2 days, the cells were incubated in EBSS for 4 h and subjected to confocal microscopy and immunoblotting. The experiment was performed twice, and representative images are shown. Scale bars indicate 10 μm. d ZDHHC13 knockdown inhibited puncta formation of autophagy-related proteins. HeLa cells stably expressing GFP-LC3, ATG5, ULK1, or WIPI1 were treated with siRNA for 2 days and incubated in EBSS for 4 h. Representative cell images were shown. Scale bars indicate 20 μm. The experiment was performed twice, and representative images are shown. For GFP-LC3 puncta per cells, siControl_Stv-, n = 66; siControl_Stv+, n = 47; siAtg13_Stv-, n = 63; siAtg13_Stv+, n = 62; siZDHHC13_Stv-, n = 64; siZDHHC13, Stv+, n = 67. For GFP-WIPI1 puncta per cells, siControl_Stv-, n = 71; siControl_Stv+, n = 83; siAtg13_Stv-, n = 96; siAtg13_Stv+, n = 56; siZDHHC13_Stv-, n = 65; siZDHHC13, Stv + , n = 71. For GFP-ULK1 puncta per cells, siControl_Stv-, n = 58; siControl_Stv+, n = 51; siAtg13_Stv-, n = 55; siAtg13_Stv+, n = 58; siZDHHC13_Stv-, n = 56; siZDHHC13, Stv+, n = 61. For GFP-ATG5 puncta per cells, siControl_Stv-, n = 73; siControl_Stv+, n = 75; siAtg13_Stv-, n = 53; siAtg13_Stv+, n = 52; siZDHHC13_Stv-, n = 52; siZDHHC13, Stv+, n = 59. A two-tailed paired t-test calculated significance. The exact p values are shown in the figure. e ZDHHC13 knockdown did not affect mTOR activity. The cell lysate from siRNA-treated cells was analyzed by immunoblotting. The experiment was performed twice, and representative images are shown.
Fig. 2
Fig. 2. ZDHHC13 regulates ULK1 palmitoylation status.
a Interaction between ZDHHC13 and ULK1. HeLa cells transfected with indicated plasmids were incubated in a growth medium (Stv-) or EBSS (Stv+) and subjected to immunoprecipitation. b ULK1 was detected in the palmitoylation assay. HeLa cells transfected with indicated plasmids were incubated in a growth medium or EBSS. The cell lysates were treated as described in Methods. CANX-FLAG was used as a control known to be palmitoylated. Input and pulldown samples were loaded at the following ratios during SDS-PAGE; 1:60 (CANX) and 1:20 (ULK1). c ZDHHC13 is required for ULK1 palmitoylation. The siRNA-treated cells were transfected with FLAG-ULK1 plasmid and subjected to palmitoylation assay. d C927, and C1003 are involved in ULK1 palmitoylation. As performed in a, HeLa cells transfected with FLAG-ULK1 wild type (wt) or mutant were subjected to palmitoylation assay. e (Top) Multiple sequence alignment of C-terminal regions from human ULK1 (O75385), Saccharomyces cerevisiae (YEAST) Atg1 (P53104), Kluyveromyces marxianus (KLUMD) Atg1 (W0T9X4), and human ULK2 (Q8IYT8). Highlighted in red are C927 and C1003 of ULK1 and their corresponding cysteine residues of the yeast orthologues, while colored in green are the other cysteines in the ULK1 C-terminal region. (Bottom) Structural comparison between the cryo-EM structure of the human ULK1 complex core (PDB ID: 8SOI, left) and the crystal structure of the K. marxianus Atg1-Atg13 complex (PDB ID: 4P1N, right). The cysteines are labeled with the residue numbers and marked with colored spheres as in the multiple sequence alignment. fh ULK1 CA mutations did not affect ULK1 complex formation. f, g HeLa cells transfected with indicated plasmids were used for immunoprecipitation as described in Method. h ULK1 wt or CA mutant, ATG13 and FIP200 were transiently expressed in ULK1/2 double knockout cells. Cell lysates were analyzed by immunoprecipitation and immunoblotting. i ULK1 CA mutants were detected at the same molecular weight as wt. Cell lysates from HeLa cells transiently transfected with each plasmid were analyzed by immunoblotting. For immunoblotting in Fig. 2, the experiment was performed more than twice and representative images are shown.
Fig. 3
Fig. 3. ULK1 puncta formation depends on the palmitoylation.
a ULK1 puncta formation in starvation conditions was decreased in CA mutants. mNeonGreen (mNG)-ULK1 wild-type or each CA mutant was stably expressed in ULK1/2 double knockout HeLa cells. The cells were incubated in EBSS for 4 h, and ULK1 puncta per cell were analyzed. The graph is represented as mean ± SD. Significance was calculated by one-way ANOVA. The experiment was independently repeated twice and showed similar results. WT, n = 25; C927A, n = 43; C1003A, n = 44; C927A, C1003A, n = 54. Representative images are shown. Scale bars indicate 20 μm. b Palmitoylation of ULK1 is essential for FIP200 puncta formation. mNG-ULK1 wild-type or each CA mutant was stably expressed in ULK1/2 double knockout HeLa cells. After 4 h of incubation in EBSS, cells were fixed and stained with anti-FIP200 antibodies. Scale bars indicate 20 μm. FIP200 puncta per cell were analyzed. The graph is represented as mean ± SD. Significance was calculated by one-way ANOVA. The experiment was independently repeated twice and showed similar results. WT, n = 27; C927A, n = 24; C1003A, n = 27; C927A, C1003A, n = 27. c ULK1 puncta formation depends on the palmitoylation. ULK1/2 double knockout HeLa cells stably expressing mNG-ULK1 wild-type were treated with DMSO or 200 μM 2-bromoplamitate (2-BP) in EBSS for 3 h. mNG-ULK1 puncta per cell were analyzed and shown as mean ± SD. Significance was calculated by a two-tailed unpaired t-test. The experiment was independently repeated twice and showed similar results. −2-BP, n = 88; +2-BP, N = 55. d Puncta formation of endogenous ULK1 complex was impaired by 2-BP treatment. HeLa cells (Left) or HeLa cells stably expressing mCherry-ATG14L (Right) were treated with DMSO or 200 μM 2-BP in an EBSS for 3 h, and stained with anti-FIP200 antibody (Left). The graph shows mean ± SD. A two-tailed unpaired t-test calculated significance. The experiment was independently repeated twice and showed similar results. For number of FIP200 puncta per cell, −2-BP, n = 41; +2-BP, N = 47. For number of ATG14L puncta per cell, −2-BP, n = 165; +2-BP, N = 73.
Fig. 4
Fig. 4. Palmitoylation sites in yeast are conserved and essential for PAS formation.
Conserved cysteine residues in yeast are essential for Atg1 puncta formation. atg1Δ cells (BY4741) expressing YFP-Atg1WT or YFP-Atg1C731A, C817A from single-copy plasmids were treated with rapamycin and analyzed by fluorescence microscopy and differential interference contrast (DIC). The scale bar represents 5 μm. The experiment was independently repeated twice and showed similar results.
Fig. 5
Fig. 5. Palmitoylation of ULK1 promotes the kinase activity against ATG14L.
a ULK1/2 double knockout HeLa cells were transiently transfected with empty vector, FLAG-ULK1 wt, FLAG-ULK1 (C927A, C1003A) or FLAG-ULK1 K46I plasmid. After 48 h, cell lysates were used for immunoblotting. Representative images are shown on the left. The graph represents mean ± SD from three experiments. One-way ANOVA and two-tailed unpaired t-test were used to test the significant difference. b ULK1/2 double knockout HeLa cells were transiently transfected with empty vector or FLAG-ULK1 wt plasmid. After 48 h, the cells were treated with 200 μM 2-BP for 3 h. Representative images from immunoblotting are shown on the left. The graph represents mean ± SD from five experiments. One-way ANOVA and two-tailed unpaired t-test were used to test the significant difference.
Fig. 6
Fig. 6. The palmitoylation of ULK1 is important for autophagy.
a Palmitoylation of ULK1 enhances the class III PI3K activation. mNG-ULK1 wild-type or each CA mutant was stably expressed in ULK1/2 double knockout HeLa cells. After 4 h of incubation in EBSS, cells were fixed with MeOH and stained with anti-WIPI2 antibody as described in Methods. Alexa 568-labeled WIPI2 signals were shown as green. Scale bars indicate 20 μm. WIPI2 puncta per cell was analyzed by Fiji. The graph is represented as mean ± SD. Significance was calculated by one-way ANOVA. The experiment was independently repeated twice and showed similar results. WT, -, n = 28; DKO, -, n = 47; DKO, WT, n = 41; DKO, C927A, n = 42; DKO, C1003A, n = 35; DKO, C927A, C1003A, n = 39. b Palmitoylation of ULK1 is essential for efficient LC3 puncta formation. mNG-ULK1 wild-type or each CA mutant was stably expressed in ULK1/2 double knockout HeLa cells. After 4 h of incubation in EBSS with or without BafA1, cells were fixed and stained with anti-LC3 antibody as described. Alexa 568-labeled LC3 signals were shown as green. Scale bars indicate 20 μm. LC3 puncta per cell was analyzed by Fiji. The graph is represented as mean ± SD. Significance was calculated by one-way ANOVA. The experiment was independently repeated twice and showed similar results. WT, -, -BafA1, n = 27; WT, -, +BafA1, n = 16; DKO, -, -BafA1, n = 24; DKO, -, +BafA1, n = 16; DKO, WT, -BafA1, n = 17; DKO, WT, +BafA1, n = 14; DKO, C927A, -BafA1, n = 25; DKO, C927A, +BafA1, n = 13; DKO, C1003A, -BafA1, n = 26; DKO, C1003A, +BafA1, n = 19; DKO, C927A, C1003A, -BafA1, n = 25; DKO, C927A, C1003A, +BafA1, n = 21. c Palmitoylation of ULK1 is important for efficient autophagy flux. HeLa wt or ULK1/2 double knockout cells stably expressing Halo-LC3 were transfected with empty vector, ULK1 wt, or mutant plasmid. The cells were analyzed by the pulse-chase reporter processing assay as described in Methods. ULK1 expression levels and loading were analyzed in immunoblotting. Representative images from immunoblotting are shown on the left. The graph is represented as mean ± SD from three experiments. Significance was calculated by one-way ANOVA.
Fig. 7
Fig. 7. ZDHHC13 is recruited to the autophagosome formation site.
a, b Colocalizations of ZDHHC13 and autophagy-related proteins during starvation-induced autophagy. a Localization of ZDHHC13-mNG. Cells stably expressing ZDHHC13-mNG were stained with anti-GM130, a Golgi marker. Areas with white rectangles are magnified in each image. Scale bars indicate 20 μm. The experiment was repeated twice, and the percentage of colocalization was calculated from a total of 38 cells and shown as a pie chart. b HeLa cells stably expressing ZDHHC13-mNG and autophagy-related protein were incubated in EBSS for 4 h and fixed. The cells were observed by a confocal microscope and shown as representative images. White arrowheads indicate representative colocalizations. Scale bars indicate 10 μm. The graph shows as mean ± SD. ULK1, n = 12; ATG9A, n = 16; ATG5, n = 10. c Endogenous ZDHHC13 was co-precipitated with ATG9A-associated membranes. Cells stably expressing ATG9A-3xHA were incubated in EBSS for 4 h and subjected to immunoprecipitation with anti-HA magnetic beads. Parental HeLa cells were used as a control sample. The experiment was performed twice, and representative images are shown. d, e Colocalizations of ZDHHC13 with autophagy-related proteins were temporally affected upon starvation induction. ULK1-HA was transiently expressed in COS7 cells, stably expressing YFP-ATG5, ATG9-CFP, and ZDHHC13-mStrawberry. After 24 h, the cells were incubated in a growth medium or EBSS for 2 h or 4 h and fixed. The fixed cells were stained with anti-HA antibody. The graph shows mean ± SD. A two-tailed unpaired t-test calculated significance. Stv-, n = 21; Stv, n = 17. White arrowheads indicate representative colocalizations. e Percentage of ULK1-positive ATG5 puncta overlapping with ATG9A was 62.0 ± 31.4% (e, upper panels). The percentage of ULK1-positive ATG5 puncta overlapping with ZDHHC13 was 12.7 ± 17.4% (e, lower panels). ATG9, n = 18; ZDHHC13, n = 17. Scale bars: 10 μm. f Schematical model summarizing the role of ZDHHC13 in autophagy. Upon autophagy induction, ZDHHC13 is recruited to autophagosome formation sites together with ATG9A. ULK1 is palmitoylated at Cys927 and Cys1003 residues by ZDHHC13, and the ULK1 complex are anchored to an autophagosome formation site. The palmitoylation of ULK1 promotes phosphorylation of ATG14L, which leads to VPS34 activation. Activated PI3-kinase complex produces PI3P at autophagosome formation sites. These sequential reactions trigger efficient autophagy induction. Parts of this figure were produced using images from Servier Medical Art. Servier Medical Art is licensed under a CC BY 4.0 license https://creativecommons.org/licenses/by/4.0/.

References

    1. Dikic, I. & Elazar, Z. Mechanism and medical implications of mammalian autophagy. Nat. Rev. Mol. Cell Biol.19, 349–364 (2018). - PubMed
    1. Deretic, V., Saitoh, T. & Akira, S. Autophagy in infection, inflammation and immunity. Nat. Rev. Immunol.13, 722–737 (2013). - PMC - PubMed
    1. Klionsky, D. J. et al. Autophagy in major human diseases. EMBO J.40, e108863 (2021). - PMC - PubMed
    1. Lamb, C. A., Yoshimori, T. & Tooze, S. A. The autophagosome: origins unknown, biogenesis complex. Nat. Rev. Mol. Cell Biol.14, 759–774 (2013). - PubMed
    1. Nakatogawa, H. Mechanisms governing autophagosome biogenesis. Nat. Rev. Mol. Cell Biol.21, 439–458 (2020). - PubMed

MeSH terms

Substances

LinkOut - more resources