. 2024 Aug 22;15(1):7203.
doi: 10.1038/s41467-024-51632-y.

Efficient roller-driven elastocaloric refrigerator

Affiliations

Efficient roller-driven elastocaloric refrigerator

Sijia Yao et al. Nat Commun. .

Abstract

Elastocaloric cooling has experienced fast development over the past decade owing to its potential to reshape the refrigeration industry. While the solid-state elastocaloric refrigerant is emission-free, the efficiency of the state-of-the-art elastocaloric cooling systems is not sufficient yet to reduce carbon emissions during operation. In this study, we double the coefficient of performance, the most commonly used efficiency metric, via the synergy of material-level advances in TiNiCu and the system-level roller-driven mechanism capable of recovering kinetic energy. On the materials level, a 125% improvement in coefficient of performance is illustrated in TiNiCu compared to NiTi, empowered by the B2-B19 martensitic transformation with improved lattice compatibility and the grain boundary strengthening from the nanocrystalline structure. On the system level, owing to the properly sized angular momentum in rotating parts, 78% work recovery efficiency is reported, transcending the theoretical limit previously unattainable without kinetic energy recovery. This confluence of materials and mechanical innovations propels elastocaloric cooling systems into a new realm of efficiency and paves the way for their practical application.


Conflict of interest statement

The authors declare no competing interests.

Figures
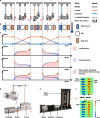
Fig. 1
Fig. 1. Principle of the roller-driven eC refrigerator.
a driving mechanism. b illustration of cascaded eC cooling with two ribbons using direct contact heat exchange. c principle of work recovery. d 3-D model of the roller. e photo of the prototype. f infrared image of the heat sink, heat source, and intermediate heat exchanger (IHX) in the prototype. The horizontal bars are part of a frame that mounts the IHX, the heat sink, and the heat source.
Fig. 2
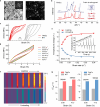
Fig. 2. Microstructure and eC performance of TiNiCu ribbon used in the eC refrigerator.
a bright-field and dark-field transmission electron microscope images showing a nanocrystalline structure in the TiNiCu ribbon. Scale bar, 200 nm. Inset is the corresponding electron diffraction pattern. b in-situ X-ray diffraction patterns showing a cubic to orthogonal MT during cooling. c isothermal stress-strain curves of TiNiCu ribbon show a smaller stress hysteresis compared to NiTi ribbon during the first four cycles. d stress-strain characteristics at different strain rates of trained TiNiCu ribbon. e temperature change at different strain rates of TiNiCu ribbon. Inset is the corresponding temperature-time curve. f infrared image of the TiNiCu ribbon during near adiabatic loading and unloading at the strain of 4%. g comparison of the adiabatic temperature change of TiNiCu and NiTi ribbons under operational strains during loading (left) and unloading (right). SMA#1 and SMA#2 refer to the two SMA ribbons specified in Fig. 1. The samples of both TiNiCu and NiTi alloys in (dg) were taken from the ribbons used in the eC refrigerator and had undergone extensive pre-training.
Fig. 3
Fig. 3. Load-free temperature span of the roller-driven eC refrigerator.
a evolution of temperature span at 0.17 Hz using baseline commercial-grade NiTi ribbons (0.9 s for loading/unloading and 2 s for heat transfer). b evolution of temperature span at 0.17 Hz using TiNiCu ribbons. c Comparison of temperature span between NiTi and TiNiCu ribbons at 0.17 Hz. d frequency-dependent temperature span using baseline commercial-grade NiTi ribbons. e simulated temperature span with different NiTi mass ratios at 0.17 Hz. Mass ratio is the mass between SMA#2 (high-temperature stage) and SMA#1 (low-temperature stage). Error bars represent the measurement uncertainty of temperature span (see uncertainty analysis section in Supplementary Information).
Fig. 4
Fig. 4. Cooling power of the roller-driven eC refrigerator.
a pull-down temperature profile of NiTi and TiNiCu ribbons at 0.17 Hz when the heat sink is actively cooled by ambient air. b frequency-dependent cooling powers at zero temperature span using baseline NiTi ribbons. c Comparison of NiTi and TiNiCu on the cooling performance map at 0.17 Hz. d simulated cooling power with different NiTi mass ratios at 0.17 Hz and zero temperature span. Mass ratio is the mass between SMA#2 (high-temperature stage) and SMA#1 (low-temperature stage). Error bars represent the measurement uncertainty of temperature span or cooling power (see uncertainty analysis section in Supplementary Information).
Fig. 5
Fig. 5. Coefficient of performance of the roller-driven eC refrigerator.
a comparison of the time-averaged input power between a single SMA ribbon and two SMA ribbons at zero temperature span. b comparison of theoretical work recovery efficiency and measured work recovery efficiency. c coefficient of performance comparison between the baseline (without work recovery), system COP with work recovery, and materials COP, at zero temperature span, i.e. heat sink and heat source at ~ 294 K. The cooling power corresponding to the TiNiCu was 4.2 W at 0.12 Hz. The cooling power corresponding to the NiTi was 2.8 W at 0.12 Hz.

References

    1. UNEP. Global Cooling Watch 2023: Keeping it Chill. https://wedocs.unep.org/handle/20.500.11822/44243 (2023).
    1. Dupont, J. L., Domanski, P. A., Lebrun, P. & Ziegler, F. The Role of Refrigeration in the Global Economy. https://iifiir.org/en/fridoc/142028 (2019).
    1. OECD Library. The Future of Cooling, Vol. 92 (International Energy Agency, 2018).
    1. Woods, J. et al. Humidity’s impact on greenhouse gas emissions from air conditioning. Joule6, 726–741 (2022).10.1016/j.joule.2022.02.013 - DOI
    1. Kitanovski, A. Energy applications of magnetocaloric materials. Adv. Energy Mater.10, 1903741 (2020).10.1002/aenm.201903741 - DOI

LinkOut - more resources