. 2024 Aug 22;15(1):7204.
doi: 10.1038/s41467-024-51580-7.

Identification and multimodal characterization of a specialized epithelial cell type associated with Crohn's disease

Affiliations

Identification and multimodal characterization of a specialized epithelial cell type associated with Crohn's disease

Jia Li et al. Nat Commun. .

Abstract

Crohn's disease (CD) is a complex chronic inflammatory disorder with both gastrointestinal and extra-intestinal manifestations associated immune dysregulation. Analyzing 202,359 cells from 170 specimens across 83 patients, we identify a distinct epithelial cell type in both terminal ileum and ascending colon (hereon as 'LND') with high expression of LCN2, NOS2, and DUOX2 and genes related to antimicrobial response and immunoregulation. LND cells, confirmed by in-situ RNA and protein imaging, are rare in non-IBD controls but expand in active CD, and actively interact with immune cells and specifically express IBD/CD susceptibility genes, suggesting a possible function in CD immunopathogenesis. Furthermore, we discover early and late LND subpopulations with different origins and developmental potential. A higher ratio of late-to-early LND cells correlates with better response to anti-TNF treatment. Our findings thus suggest a potential pathogenic role for LND cells in both Crohn's ileitis and colitis.


Conflict of interest statement

The authors declare no competing interests.

Figures
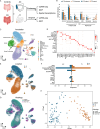
Fig. 1
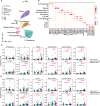
Fig. 1. Single-cell landscape in Crohn’s disease and non-IBD controls.
A Schematic for processing endoscopic and surgical samples from TI and AC for non-IBD controls, inactive and active CD patients. B Summary of the number of samples in each group. C UMAP of 155,093 cells from endoscopy samples colored by cell clusters. D Dotplot showing markers for each cell type. E UMAP of 155,093 cells colored by tissue origin, TI (brown) or AC (blue). F Proportion of each cell cluster in TI (brown) and AC samples (blue). G UMAP of 155,093 cells colored by disease status, controls (tan), inactive (green) or active CD (purple). H MDS plot of cell compositional differences across all endoscopy specimens. Figure 1a was created with BioRender.com released under a Creative Commons Attribution-NonCommercial-NoDerivs 4.0 International license (https://creativecommons.org/licenses/by-nc-nd/4.0/deed.en).
Fig. 2
Fig. 2. Immune and stromal cell rewiring in Crohn’s disease.
A UMAP of immune and stromal cells. B Dotplot of markers in each cell type. C Proportional changes of each immune and stromal cell type from non-IBD controls to inactive and active CD patients in TI (two-sided Wilcoxon test with FDR adjustment). D Proportional changes of each immune and stromal cell type from non-IBD controls to inactive and active CD patients in AC (two-sided Wilcoxon test with FDR adjustment). Data are represented as the mean ± SD (C, D).
Fig. 3
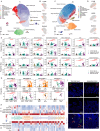
Fig. 3. An LND epithelial cell type expands in active Crohn’s disease.
A UMAP of 13 epithelial cell types in TI. B UMAP labeled with expression of LCN2, NOS2, and DUOX2 in TI. C UMAP of 12 epithelial cell types in AC. D UMAP labeled with expression of LCN2, NOS2, and DUOX2 in AC. E Proportional changes of each epithelial cell type from controls to inactive and active CD patients in TI (two-sided Wilcoxon test with FDR adjustment). F Proportional changes of each epithelial cell from controls to inactive and active CD patients in AC (two-sided Wilcoxon test with FDR adjustment). G Proportional changes of LND cells with disease status in six independent cohorts (two-sided Wilcoxon test with FDR adjustment). H Heatmap of high expression of immune-related genes in the LND in both TI (top) and AC (bottom). I Representative HCR-FISH Co-staining of LCN2 (green), NOS2 (pink), and DUOX2 (red) on non-IBD controls, CD with low LND and CD with high LND in TI and AC tissues (N = 2–5 per group). The scale bar represents 100 μm. Data are represented as the mean ± SD (EG).
Fig. 4
Fig. 4. Two LND subpopulations with different origins and developmental potential.
A RNA velocity results mapped on the UMAP plot showing the predicted future transcriptional state of each cell. B UMAP of early (light red) and late (medium red) LND clusters in the TI. C PAGA results mapped on the UMAP plot showing connectivity between cell types. D Histogram plot comparing the developmental potential of enterocytes predicted by CytoTRACE (two-sided Wilcoxon test with FDR adjustment). E Comparison of the expression of CXCL5, TNFRSF1A, and TNFRSF1B between early and late LND cells (two-sided Wilcoxon test with FDR adjustment). F Comparison of the ratio of late to early LND cells between anti-TNF responders (tan) and non-responders (pink) after the first dose of medication (two-sided Wilcoxon test). Data are represented as the mean ± SD (DF).
Fig. 5
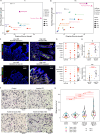
Fig. 5. LND cells interact with immune cells.
Scatterplot of incoming and outgoing interaction strength of each cell type in the TI (A) and AC (B). C Representative multiplex images of CD8+ (red), CD4+ (green), and CD45+ (yellow) cells in low (N = 7) and high LND (N = 10) in the TI and AC. D DotPlot of marker genes in infiltrating lymocytes (ILs). E The proportion differences of ILs between low (orange) and high (purple) LND patients (one-sided Wilcoxon test). Data are represented as the mean ± SD. F Representative 40X images from Transwell monocyte migration assays from non-IBD control, inactive CD, active CD with low LND, and active CD with high LND. The migrated monocytes are stained in purple. G Violin Plot of the number of migrated monocytes in non-IBD control, inactive CD, active CD with low LND, and active CD with high LND. Statistical test was performed using a negative binomial mixed model (n = 21 measurements per group from 4 independent experiments; 6 quantified images from two wells in the first experiment and 5 images from one well in the next three experiments). Data are represented as the mean ± SEM.
Fig. 6
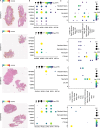
Fig. 6. Spatial organization between LND and immune cells.
A H&E images for the four patient samples overlaid and colored by the expression of DUOX2. B Dotplot of colocalization of LND markes (LCN2, NOS2, and DUOX2) and the general epithelial genes (KRT8 and KRT18) with immune signatures. Only significant colocalization (FDR < 0.01) is included. Dot size denotes the z-value and color denotes the colocalization significance compared to random distribution. C Dotplot of colocalization between epiethial and immune cells. Only significant colocalization (FDR < 0.01) is included. Dot size denotes the z-value and color denotes the colocalization significance compared to random distribution.
Fig. 7
Fig. 7. LND cells specifically express IBD/CD-risk genes.
A Significance of cell-type specific expression of IBD/CD-risk genes in TI. B Significance of cell-type specific expression of IBD/CD-risk genes in AC. C Significance of cell-type specific expression of IBD/CD-risk genes in each CD TI tissue. D Significance of cell-type specific expression of IBD/CD-risk genes in each CD AC tissue.

Update of

References

    1. Kaser, A., Zeissig, S. & Blumberg, R. S. Inflammatory bowel disease. Annu. Rev. Immunol.28, 573–621 (2010). 10.1146/annurev-immunol-030409-101225 - DOI - PMC - PubMed
    1. Torres, J., Mehandru, S., Colombel, J. F. & Peyrin-Biroulet, L. Crohn’s disease. Lancet389, 1741–1755 (2017). 10.1016/S0140-6736(16)31711-1 - DOI - PubMed
    1. Van Heel, D. A., McGovern, D. P. & Jewell, D. P. Crohn’s disease: genetic susceptibility, bacteria, and innate immunity. Lancet357, 1902–1904 (2001). 10.1016/S0140-6736(00)05091-1 - DOI - PubMed
    1. Yang, A. Z. & Jostins-Dean, L. Environmental variables and genome-environment interactions predicting IBD diagnosis in large UK cohort. Sci. Rep.12, 10890 (2022). 10.1038/s41598-022-13222-0 - DOI - PMC - PubMed
    1. Jostins, L. et al. Host-microbe interactions have shaped the genetic architecture of inflammatory bowel disease. Nature491, 119–124 (2012). 10.1038/nature11582 - DOI - PMC - PubMed

MeSH terms