. 2024 Oct;38(10):2090-2101.
doi: 10.1038/s41375-024-02358-9. Epub 2024 Aug 21.

Identification of leukemia stem cell subsets with distinct transcriptional, epigenetic and functional properties

Affiliations

Identification of leukemia stem cell subsets with distinct transcriptional, epigenetic and functional properties

Héléna Boutzen et al. Leukemia. 2024 Oct.

Abstract

The leukemia stem cell (LSC) compartment is a complex reservoir fueling disease progression in acute myeloid leukemia (AML). The existence of heterogeneity within this compartment is well documented but prior studies have focused on genetic heterogeneity without being able to address functional heterogeneity. Understanding this heterogeneity is critical for the informed design of therapies targeting LSC, but has been hampered by LSC scarcity and the lack of reliable cell surface markers for viable LSC isolation. To overcome these challenges, we turned to the patient-derived OCI-AML22 cell model. This model includes functionally, transcriptionally and epigenetically characterized LSC broadly representative of LSC found in primary AML samples. Focusing on the pool of LSC, we used an integrated approach combining xenograft assays with single-cell analysis to identify two LSC subtypes with distinct transcriptional, epigenetic and functional properties. These LSC subtypes differed in depth of quiescence, differentiation potential, repopulation capacity, sensitivity to chemotherapy and could be isolated based on CD112 expression. A majority of AML patient samples had transcriptional signatures reflective of either LSC subtype, and some even showed coexistence within an individual sample. This work provides a framework for investigating the LSC compartment and designing combinatorial therapeutic strategies in AML.


Conflict of interest statement

JED reports receiving a commercial research grant from Celgene/BMS, and JED and JCYW have patents licensed to Trillium Therapeutics/Pfizer.

Figures
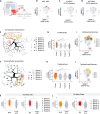
Fig. 1
Fig. 1. Single cell multiome analysis captures heterogeneity within the OCI-AML22 CD34 + CD38- cell fraction.
A Experimental design. B–D UMAP representation based on both RNA-Seq and ATAC-Seq for each of the CD34 + CD38- OCI-AML22 cells that passed QC. Cells that mapped into the HSC-MPP group from Supplementary Fig. S1 are colored in red (B) Cells are colored based on the z-score value for the LT/HSPC epigenetic signature [42] (C) or based on the z-score value for the ACT/HSPC epigenetic signature from [42] (D). E TooManyCells representation [43] using RNA-Seq data from CD34 + CD38- OCI-AML22 single cells. F TooManyPeak representation [44] using ATAC-Seq data from CD34 + CD38- OCI-AML22 single cells. G Enrichment scores for the LT/HSPC signature [42] are plotted for OCI-AML22 CD34 + CD38- cells across the TooManyCells branches as indicated. Individual cells are colored based on their branch identity in the TooManyCells Tree (see E). H Enrichment scores for the LT/HSPC signature [42] are plotted for OCI-AML22 CD34 + CD38- cells across the TooManyPeaks branches as indicated. Cells are colored based on their branch identity in the ToomanyPeaks Tree (see F). UMAP representation based on both RNA-Seq and ATAC-Seq for each of the CD34 + CD38- OCI-AML22 cells that passed QC. Cells are colored based on their branch identity in the TooManycells representation (I) or based on their branch identity in the ToomanyPeaks representation (J). K Enrichment scores for the LT/HSPC signature [42] are plotted for OCI-AML22 CD34 + CD38- cells across the TooManyCells branches as indicated. Cells are colored based on their Branch identity in the TooManycells representation shown (F). L Enrichment scores for the LT/HSPC signature [42] are plotted for OCI-AML22 CD34 + CD38- cells across the TooManyPeaks branches as indicated. Cells are colored based on the branch identity in the TooManyPeaks representation.
Fig. 2
Fig. 2. B1/2 and B3 LSC signatures can be identified in LSC+ fractions from primary AML patient samples and co-exist within an individual LSC+ fraction.
A Experimental and computational scheme. B GSVA was performed for B1/2 or B3 signatures across LSC-positive fractions functionally assessed via xenograft assays from primary AML samples [2]. Scores for each signature are plotted and were used to perform hierarchical clustering using Complexe heatmap. CI Functionally assessed LSC positive fractions for each indicated patient sample are represented in boxes colored based on the cluster each fraction was allocated in (A). LSC negative fractions are indicated in white. Not assessed fractions are not represented. Patients with fractions belonging to the B1/2 cluster from Fig. 2A (C), Patients with fractions belonging to the B3 cluster from Fig. 2B (D), Patients with fractions belonging to cluster B1/2 or cluster B3 from Fig. 2B (E), patients with fractions belonging to the Mixed cluster (F), Patients with fractions belonging to the Mixed cluster and the B1/2 cluster (G), patients with fractions belonging to the Mixed cluster and the B3 cluster (H), patient with fractions belonging to the 3 clusters enriched with either B1/2 or B3 signatures (I).
Fig. 3
Fig. 3. Single cells assay captures distinct colony formation and differentiation potentials within the CD34 + CD38- OCI-AML22 fraction.
A Experimental scheme. B Pie chart indicating the percentage of CD34 + CD38- OCIAML22 cells that do not generate colonies (depicted in white) or generate a colony (depicted in yellow or red depending on the type of colonies). C For each colony type depicted in yellow or red in Fig. 3B, the absolute number of total cells is plotted in the matching color (yellow: left; red: right). D Extreme immunophenotypic profiles of the 2 types of colonies identified from single cell in vitro assay and depicted in yellow or red in (B). For each colony type depicted in yellow or red in (B), the absolute number of CD34 + CD38- cells (E), CD34 + CD38+ cells (F), CD34-CD38+ cells (G) or CD34-CD38- cells (H) generated from each single CD34 + CD38- OCI-AML22 cells co-cultured with MS5 is depicted in the matching colors (yellow: left; red: right).
Fig. 4
Fig. 4. In vivo functional deconvolution reveals the existence of LSC with distinct repopulation kinetics and differentiation potential.
A Schematic representation of the experiment. NSG-SGM3 mice were injected intrafemorally at limiting dilution with multiple cell doses of sorted CD34 + CD38- OCI-AML22 cells. Engraftment was assessed 8 and 12 weeks after injection. B The percentage of mice for which engraftment could be detected at 8 weeks or 12 weeks, after injection of the indicated OCI-AML22 CD34 + CD38- cell dose sorted from a bulk culture expanded for 3-4 months in vitro is plotted. C UMAP-based clustering of engraftment parameters derived from non-injected bone marrow (BM) and injected femur (RF) (parameters: total human cell counts, %CD34 expression, %engraftment level, number of injected cells per mice) of NSG-M3S mice 12 weeks after injection CD34 + CD38- OCIAML22 cells per mouse using doses from Fig. 4B. D Statistical analysis for each cluster from (C), showing the number of injected cells (D), the engraftment level (E), the percentage of CD34+ cells in the generated grafts (F). G Representative immunophenotypic profiles of grafts based on CD34 and CD38 cell surface expression (hCD45+ subgated cells are shown) for the clusters identified in (C).
Fig. 5
Fig. 5. CD112 enables prospective isolation of distinct LSC subsets with different cell cycle state.
A ChromVAR enrichment score for the CD112-High epigenetic signature [11] in the indicated populations from TooManyCells. B UMAP representation based on both RNA-Seq and ATAC-Seq for each of the CD34 + CD38- OCI-AML22 cells that passed QC. Cells are colored based on the cell cycle phase they were allocated to using Seurat cell cycle signature [47]. C GSEA across B3-CD112High and B1/2-CD112Low for LSPC-Cycle Top 250 signature [33], Tirosh cell cycle signature [47] and the Diapause Down in colon cancer signature [49]. D Experimental scheme. OCI-AML22 CD34 + CD38- fraction was sorted based on CD112 expression level then stained for CDK6, Ki-67 and Hoechst to determine the percentage of cells in G0 (HoechstLowKi67-) (E) or the deepest quiescent cells Ki67-CDK6- cells (F) (n = 5 individual cultures, 3 different times points). Representative FACS plots are disclosed for each condition on the right (E, F). The LSC+fraction from functionally assessed primary AML samples was sorted based on CD112 expression level (top 20% :CD112-High, bottom 20% :CD112-Low) then stained for CDK6, Ki67 and Hoechst to determine the percentage of cells in G0 (HoechstLowKi67-)(G) or the deepest quiescent cells in G0 (Ki67-CDK6-) cells (H). FACS plots are disclosed for each condition for each patient sample (G, H).
Fig. 6
Fig. 6. Prospectively isolated LSC subtypes preserve their distinct differentiation potentials throughout serial repopulation assays.
A Experimental in vivo scheme. B Engraftment level 8 weeks after injection of 10,000 OCI-AML22 cells in NSG mice sorted as indicated on (A). C Experimental in vivo strategy for secondary experiment and representative FACS plots for each condition based on CD34 and CD38 among the CD45 + 7AAD- engrafted population. D Experimental scheme for the secondary in vivo assay. E Percentage of CD34/CD38 cells of secondary grafts generated after injection of 10,000 CD34 + CD38- cells CD112 High or CD112 Low, then sorted for CD34 + CD38- without additional selection for CD112, as indicated in (D). Mann–Whitney test, n = 9 mice. GSVA score for signatures of cytarabine sensitivity (F, G) or colon cancer stem cell sensitivity (H) was calculated on LSC+ fractions identified as being part of B1/2-LSC+ cluster or on LSC+ fractions identified as being part of B3-LSC+ cluster from Fig. 2A, B. I, J CD112 High and CD112 Low OCI-AML22 CD34 + CD38- were sorted and treated with cytarabine for 24 h at the indicated dose. Representative curve is represented (n = 1) (I) and significance is calculated at the 5 μM dose (n = 5, paired Mann–Whitney test) (J). GSVA for B1/2 or B3 signatures was calculated across TCGA (K) or GSE6891 cohorts (L). survival curves were plotted for patients enriched for B1/2 signature only (yellow curve) or enriched for B3 signature only (red curve). M Summary scheme.

References

    1. Eppert K, Takenaka K, Lechman ER, Waldron L, Nilsson B, van Galen P, et al. Stem cell gene expression programs influence clinical outcome in human leukemia. Nat Med. 2011;17:1086–93. - PubMed
    1. Ng SWK, Mitchell A, Kennedy JA, Chen WC, McLeod J, Ibrahimova N, et al. A 17-gene stemness score for rapid determination of risk in acute leukaemia. Nature. 2016;540:433–7. - PubMed
    1. van Rhenen A, Feller N, Kelder A, Westra AH, Rombouts E, Zweegman S, et al. High stem cell frequency in acute myeloid leukemia at diagnosis predicts high minimal residual disease and poor survival. Clin Cancer Res. 2005;11:6520–7. - PubMed
    1. Gentles AJ, Plevritis SK, Majeti R, Alizadeh AA. Association of a leukemic stem cell gene expression signature with clinical outcomes in acute myeloid leukemia. JAMA. 2010;304:2706–15. - PMC - PubMed
    1. Thomas D, Majeti R. Biology and relevance of human acute myeloid leukemia stem cells. Blood. 2017;129:1577–85. - PMC - PubMed