. 2024 Oct;16(10):2583-2618.
doi: 10.1038/s44321-024-00119-w. Epub 2024 Aug 21.

Fertility protection during chemotherapy treatment by boosting the NAD(P)+ metabolome

Affiliations

Fertility protection during chemotherapy treatment by boosting the NAD(P)+ metabolome

Wing-Hong Jonathan Ho et al. EMBO Mol Med. 2024 Oct.

Abstract

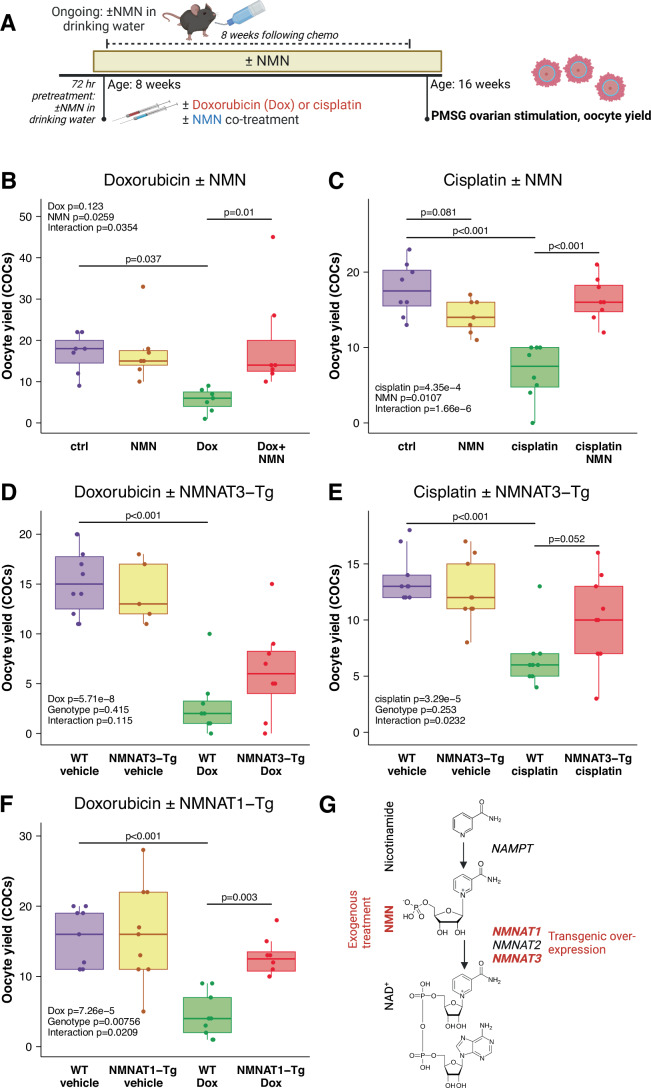
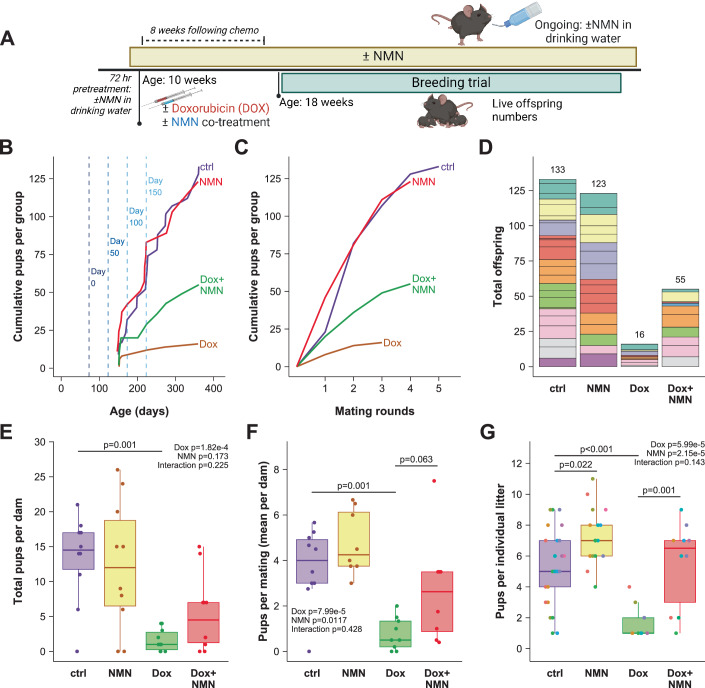
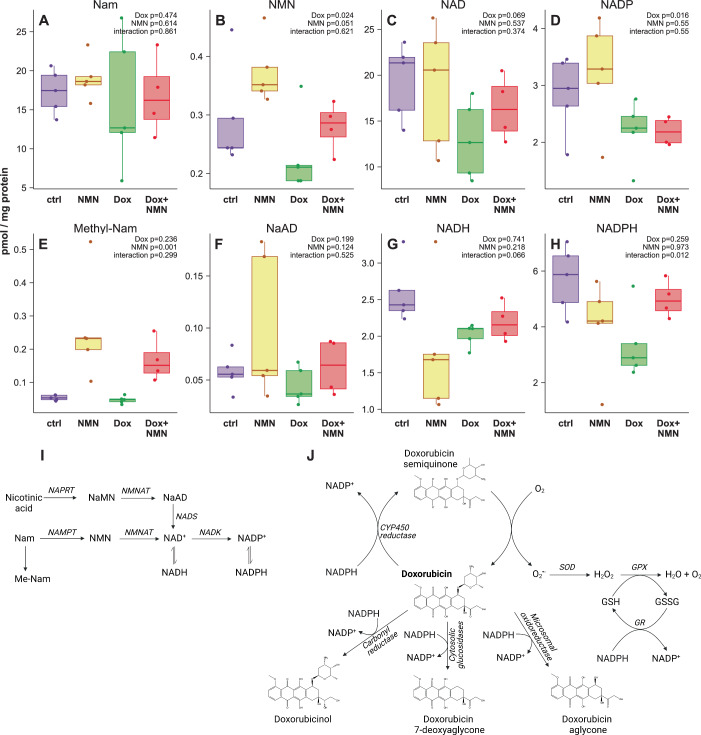
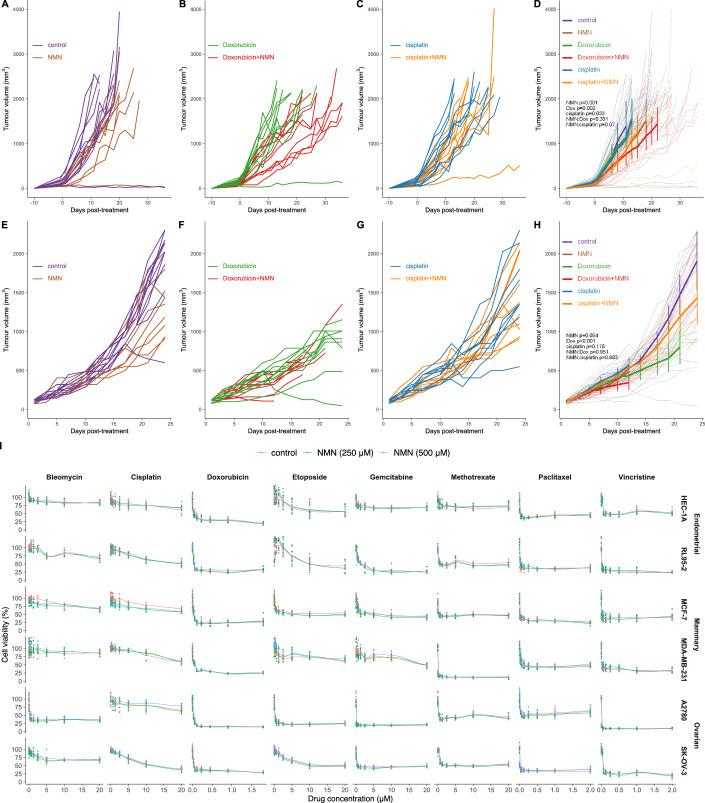
Chemotherapy induced ovarian failure and infertility is an important concern in female cancer patients of reproductive age or younger, and non-invasive, pharmacological approaches to maintain ovarian function are urgently needed. Given the role of reduced nicotinamide adenine dinucleotide phosphate (NADPH) as an essential cofactor for drug detoxification, we sought to test whether boosting the NAD(P)+ metabolome could protect ovarian function. We show that pharmacological or transgenic strategies to replenish the NAD+ metabolome ameliorates chemotherapy induced female infertility in mice, as measured by oocyte yield, follicle health, and functional breeding trials. Importantly, treatment of a triple-negative breast cancer mouse model with the NAD+ precursor nicotinamide mononucleotide (NMN) reduced tumour growth and did not impair the efficacy of chemotherapy drugs in vivo or in diverse cancer cell lines. Overall, these findings raise the possibility that NAD+ precursors could be a non-invasive strategy for maintaining ovarian function in cancer patients, with potential benefits in cancer therapy.

Keywords: Infertility; Nicotinamide Adenine Dinucleotide (NAD+); Nicotinamide Mononucleotide (NMN); Oncofertility; Ovarian Toxicity.


Figures

Figure 1
Figure 1. NMN treatment and transgenic overexpression of NAD+ biosynthetic enzymes attenuates the loss of oocyte yield following chemotherapy treatment.
(A) Female mice were treated with or without the NAD+ precursor nicotinamide mononucleotide (NMN) in drinking water (2 g/L) starting from 72 h prior to an i.p. injection of doxorubicin (Dox, 10 mg/kg) with or without an additional i.p. bolus of NMN (200 mg/kg). Eight weeks later, animals were stimulated with PMSG to determine the production of cumulus oocyte complexes (COCs), with separate cohorts used for histology to determine follicle numbers and health, and for breeding trials to determine fertility. (B) Wild-type females treated with or without NMN and the chemotherapy agent doxorubicin (Dox). An identical experiment was performed in transgenic animals over-expressing the NAD+ biosynthetic enzymes (C) NMNAT3 and (D) NMNAT1. This experiment was also repeated with cisplatin treatment in combination with (E) NMN treatment and (F) NMNAT3 transgenic mice. (G) Summary of strategies used to elevate NAD+ production, including exogenous treatment with NMN, and transgenic overexpression of the NAD+ biosynthetic enzymes NMNAT1 and NMNAT3. P-values from Bonferroni-adjusted t-tests derived from estimated marginal means analysis of a linear model of Dox and NMN treatment. n = 5–9 per group as indicated by the number of dots indicating data from separate animals. Data in this and all subsequent figures are summarised as Tukey boxplots, showing the 25–75% interquartile range with whiskers indicating 95% confidence intervals, mean values indicated by a line within boxplots.
Figure 2
Figure 2. NMN treatment ameliorates doxorubicin-induced infertility.
(A) Animals were treated with doxorubicin (Dox) or vehicle control and/or NMN, and 8 weeks later were subject to mating trials to determine fertility. (B) Cumulative number of pups for each group over time, with the timing of Dox treatment indicated by a dark blue line, with lighter dashed lines for subsequent 50-day increments. Results are also expressed as (C) cumulative number of pups in each cohort per round of confirmed mating, as determined by the presence of vaginal plugs, (D) summarised as totals per group with stacked colours for each dam. (E) Total number of pups per dam. (F) Number of live offspring born per round of successful mating, which was determined by the presence of a vaginal plug following timed overnight mating. (G) Number of pups in each litter, datapoints coloured for each animal within that group. N = 10 mice per group, however, not all groups show 10 datapoints on all graphs where some animals failed to deliver pups and/or mate. P-values from Bonferroni-adjusted t-tests derived from estimated marginal means analysis of a linear model of Dox and NMN treatment. Tukey boxplots show the 25–75% interquartile range with whiskers indicating 95% confidence intervals, mean values indicated by a line within boxplots.
Figure 3
Figure 3. NMN treatment following cisplatin (CDDP) ameliorates infertility.
(A) Animals were treated with cisplatin (2 mg/kg) or saline control, without any NMN co-treatment. Two weeks later, animals received drinking water containing NMN (2 g/L) or untreated water, followed by a breeding trial from 4 months of age. (B) Cumulative number of pups for each group over time, with the timing of CDDP treatment indicated by a dark blue line, with lighter dashed lines for subsequent 50-day increments. Results are also expressed as (C) cumulative number of pups in each cohort per round of confirmed mating, as determined by the presence of vaginal plugs, (D) summarised as totals per group with stacked colours for each dam. (E) Total pups per dam. (F) Number of live offspring born per round of successful mating. (G) Number of pups in each litter, datapoints coloured for each animal within that group. N = 10 per group for control and NMN groups, n = 9 for CDDP and CDDP + NMN after one animal was identified as an outlier (ROUT cut-off Q = 0.1) in the CDDP group, and one animal from the CDDP + NMN group was removed prior to starting the breeding trial. P-values from Bonferroni-adjusted t-tests derived from estimated marginal means analysis of a linear model of Dox and NMN treatment. Tukey boxplots show the 25–75% interquartile range with whiskers indicating 95% confidence intervals, mean values indicated by a line within boxplots.
Figure 4
Figure 4. Doxorubicin impairs follicle health and is rescued by NMN at the primordial stage.
Females were treated with doxorubicin (Dox) and/or NMN as per Fig. 1A. Eight weeks later, animals were euthanased at the diestrus stage and ovaries collected for resin embedding, staining and stereology to assess follicle reserve and morphological health in (A) primordial, (B) transitory, (C) primary and (D) total follicles. Total numbers of (E) small and (F) large antral follicles were counted, along with (G) corpora lutea, which are involved in (H) progesterone secretion. (IL) Representative sections of ovaries from (I) control, (J) NMN, (K) Dox and (L) Dox and NMN co-treated animals, scale bar is 500 μm. n = 6 per group. Follicles were counted from every third section across the entire ovary. P-values from Bonferroni-adjusted t-tests derived from estimated marginal means analysis of a linear model of Dox and NMN treatment. Tukey boxplots show the 25–75% interquartile range with whiskers indicating 95% confidence intervals, mean values indicated by a line within boxplots.
Figure 5
Figure 5. Dox and NMN treatment impacts the ovarian NAD+ metabolome.
Animals received an acute dose of doxorubicin (5 mg/kg) and/or NMN (200 mg/kg) as shown in Fig. 1A. Six hours later, animals were euthanased, ovaries collected and subject to mass spectrometry analysis for levels of (A) nicotinamide, (B) NMN, (C) NAD+, (D) NADP+, (E) 1-methyl-nicotinamide, (F) NaAD, (G) NADH and (H) NADPH. (I) Pathway for the incorporation of exogenous NMN treatment into the NAD+ metabolome, including into NADP+ and NADPH, which (J) is consumed during the metabolism of doxorubicin, which can generate reactive oxygen species that are neutralised by the glutathione (GSH) system, where the recycling of oxidised glutathione (GSSG) into GSH is also powered by NADPH. n = 4–5 per group, p-values between groups are from Bonferroni-adjusted t-tests derived from estimated marginal means analysis of a linear model of Dox and NMN treatment, with p-values for main and interaction effects of linear models annotated onto each panel. Tukey boxplots show the 25–75% interquartile range with whiskers indicating 95% confidence intervals, mean values indicated by a line within boxplots.
Figure 6
Figure 6. Proteomic analysis of ovaries following acute doxorubicin and NMN.
As in Fig. 5, animals received an acute dose of doxorubicin and/or NMN, six hours later they were euthanased and ovaries rapidly collected for proteomics analysis using label-free whole cell proteomics. Significant differences in protein abundance are shown in (A) as clustered heatmaps, also presented (BD) as volcano plots for select comparisons, showing log2 adjusted LFQ intensity. (EP) Abundance levels for individual proteins that were significantly changed in samples that received Dox only compared to Dox + NMN and untreated controls, including (E) CDC effector protein 5, (F) CDH1, (G) ceramide synthase 5, (H) ceramide transporter 1, (I) dipthamide 2, (J) indolethylamine N-methyltransferase, (K) leucine-rich repeat containing 1, (L) pterin-4-α-carbinolamine dehydratase, (M) Pea15, (N) S100 Ca2+ binding protein G, (O) α-1-antitrypsin, and (P) thymosin β-4. The criteria for significance was a minimum 2-fold difference in abundance between groups, with an adjusted p-value cut-off of 0.05. Statistics were performed using LFQ-Analyst, which creates linear models for each protein combined with Bayes statistics, and adjusted p-values based on the Benjamini–Hochberg method. n = 4–5 per group. Tukey boxplots show the 25–75% interquartile range with whiskers indicating 95% confidence intervals, mean values indicated by a line within boxplots.
Figure 7
Figure 7. NMN does not reduce the efficacy of chemotherapy.
The MDA-MB-231 orthotopic xenograft model of mammary cancer was used in mice treated with vehicle, doxorubicin or cisplatin in the presence or absence of NMN. Data are separated into the effects of NMN with (A) vehicle, (B) doxorubicin and (C) cisplatin, summarised in (D) with thicker lines indicating mean tumour volumes up to the point of the first animal being euthanased from each cohort, and error bars as 95% confidence intervals. (EH) The same experiment was repeated independently in a second laboratory. n = 10 per group for both experiments, error bars are mean ± 95% CI. Data analysed by Baysesian joint modelling of tumour growth and survival, incorporating survival data and mixed linear modelling of tumour growth over time to account for the removal of animals due to ethical limits to maximum tumour volume. This joint modelling was used to test for main effects and interactions of NMN and chemotherapy on tumour growth as a longitudinal factor, p-values as indicated. (I) To further test for the non-inferiority of NMN co-treatment with chemotherapy, NMN (250 and 500 µM) was also tested in vitro for potential interactions with bleomycin, cisplatin, doxorubicin, etoposide, gemcitabine, methotrexate, paclitaxel and vincristine, in the endometrial, mammary and ovarian cancer cell lines HEC-1A, RL95-2, MCF-7, MDA-MB-231, A2780 and SK-OV-3, using crystal violet staining as an indicator of cell viability.
Figure EV1
Figure EV1. Kinetics of oocyte maturation.
Germinal vesicle (GV) stage cumulus oocyte complexes (COCs) from animals stimulated with PMSG in main Fig. 1 were collected in media containing IBMX to prevent meiotic maturation, mechanically denuded and moved to IBMX-free media to allow meiotic resumption. The proportion of oocytes undergoing germinal vesicle breakdown (GVBD) and polar body extrusion (PBE) were assessed at the indicated timepoints in oocytes obtained from mice treated with (A) doxorubicin (Dox) or (B) cisplatin in the presence or absence of NMN, as in main Fig. 1B,C, and in (C) NMNAT1 and (D) NMNAT3 transgenic or wild-type (WT) littermates treated with Dox, as in main Fig. 1D,F.
Figure EV2
Figure EV2. Individualised breeding trial data from Figs. 2 and 3.
(A, B) Breeding trial data from doxorubicin (Dox) treatment as per Fig. 2A, or (C, D) from cisplatin (CDDP) treatment as per Fig. 3A. Each line represents the cumulative number of pups from each dam, displayed (A, C) as a function of time, showing each successful or unsuccessful mating (confirmed by observation of a vaginal plug) and births, as summarised for the entire cohorts in Figs. 2B and 3B. The timing of dox or cisplatin treatment is indicated as Day 0 by a dark blue line, with lighter dashed lines for subsequent 50-day increments. Results are also expressed as (B, D) pups per dam per round of confirmed mating, as confirmed by the presence of a vaginal plug.
Figure EV3
Figure EV3. Representative images of follicles classified as unhealthy during assessments of ovarian reserve (Fig. 3).
Images show follicles with (A) no oocyte; (B) biovular follicle; (C) small follicle with zona pellucida remnants (ZPRs); (D) enlarged oocyte with undifferentiated GCs; (E) multinuclear oocyte; (F) vacuoles present in oocyte; (G) atretic follicle; (H) ZPRs. Scale bars are as indicated in each image.
Figure EV4
Figure EV4. Whole ovary weight and appearance.
(A) Macroscopic appearance of ovaries from non-PMSG stimulated animals treated with doxorubicin (Dox) in the presence or absence of NMN, collected 8 weeks after chemotherapy as described in Figs. 1, 2 and 4. Rulers in pictures show length in millimetres. (B) Weights of ovaries collected for stereology from animals treated with doxorubicin (Dox) in the presence or absence of NMN, as described in Fig. 4. N = 5–6 animals per treatment. Data were analysed by estimated marginal means for NMN from a linear model of DOX and NMN treatment with Bonferroni correction, p-values as indicated.
Figure EV5
Figure EV5. Doxorubicin (DOX) induced cardiotoxicity.
Animals were treated with DOX (8 mg/kg) once per week for 4 weeks, with ultrasound imaging every week to assess parameters of (A) left ventricular structure and (B) cardiac function. Thick lines indicate the mean values for each treatment group, thin transparent lines indicate data from individual animals. n = 13–15 per group, error bars are mean ± 95% CI.

References

    1. Aflatounian A, Paris VR, Richani D, Edwards MC, Cochran BJ, Ledger WL, Gilchrist RB, Bertoldo MJ, Wu LE, Walters KA (2022) Declining muscle NAD(+) in a hyperandrogenism PCOS mouse model: possible role in metabolic dysregulation. Mol Metab 65:101583 - PMC - PubMed
    1. Ben-Aharon I, Bar-Joseph H, Tzarfaty G, Kuchinsky L, Rizel S, Stemmer SM, Shalgi R (2010) Doxorubicin-induced ovarian toxicity. Reprod Biol Endocrinol 8:20 - PMC - PubMed
    1. Bertoldo MJ, Listijono DR, Ho WJ, Riepsamen AH, Goss DM, Richani D, Jin XL, Mahbub S, Campbell JM, Habibalahi A et al (2020a) NAD(+) repletion rescues female fertility during reproductive aging. Cell Rep 30:1670–1681.e1677 - PMC - PubMed
    1. Bertoldo MJ, Rodriguez Paris V, Gook DA, Edwards MC, Wu K, Liang CJJ, Marinova MB, Wu LE, Walters KA, Gilchrist RB (2021) Impact of nicotinamide mononucleotide on transplanted mouse ovarian tissue. Reproduction 161:215–226 - PubMed
    1. Bertoldo MJ, Smitz J, Wu LE, Lee HC, Woodruff TK, Gilchrist RB (2020b) Prospects of rescuing young eggs for oncofertility. Trends Endocrinol Metab 31:708–711 - PubMed

LinkOut - more resources