. 2024 Sep;16(9):2233-2261.
doi: 10.1038/s44321-024-00121-2. Epub 2024 Aug 21.

Novel immunotherapeutics against LGR5 to target multiple cancer types

Affiliations

Novel immunotherapeutics against LGR5 to target multiple cancer types

Hung-Chang Chen et al. EMBO Mol Med. 2024 Sep.

Erratum in

  • Publisher Correction: Novel immunotherapeutics against LGR5 to target multiple cancer types.
    Chen HC, Mueller N, Stott K, Kapeni C, Rivers E, Sauer CM, Beke F, Walsh SJ, Ashman N, O'Brien L, Rafati Fard A, Ghodsinia A, Li C, Joud F, Giger O, Zlobec I, Olan I, Aitken SJ, Hoare M, Mair R, Serrao E, Brenton JD, Garcia-Gimenez A, Richardson SE, Huntly B, Spring DR, Skjoedt MO, Skjødt K, de la Roche M, de la Roche M. Chen HC, et al. EMBO Mol Med. 2024 Nov;16(11):3026. doi: 10.1038/s44321-024-00139-6. EMBO Mol Med. 2024. PMID: 39322863 Free PMC article.

Abstract

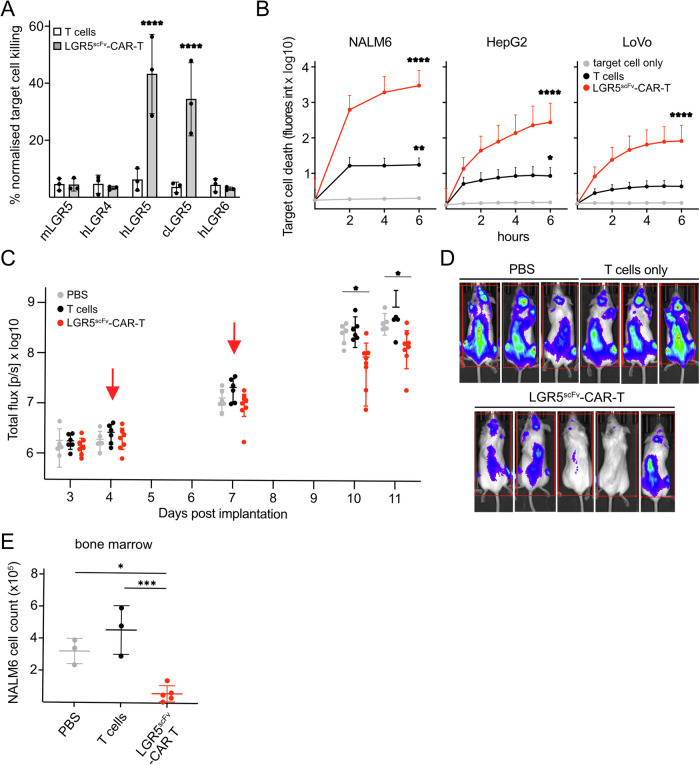
We have developed and validated a highly specific, versatile antibody to the extracellular domain of human LGR5 (α-LGR5). α-LGR5 detects LGR5 overexpression in >90% of colorectal cancer (CRC), hepatocellular carcinoma (HCC) and pre-B-ALL tumour cells and was used to generate an Antibody-Drug Conjugate (α-LGR5-ADC), Bispecific T-cell Engager (α-LGR5-BiTE) and Chimeric Antigen Receptor (α-LGR5-CAR). α-LGR5-ADC was the most effective modality for targeting LGR5+ cancer cells in vitro and demonstrated potent anti-tumour efficacy in a murine model of human NALM6 pre-B-ALL driving tumour attrition to less than 1% of control treatment. α-LGR5-BiTE treatment was less effective in the pre-B-ALL cancer model yet promoted a twofold reduction in tumour burden. α-LGR5-CAR-T cells also showed specific and potent LGR5+ cancer cell killing in vitro and effective tumour targeting with a fourfold decrease in pre-B-ALL tumour burden relative to controls. Taken together, we show that α-LGR5 can not only be used as a research tool and a biomarker but also provides a versatile building block for a highly effective immune therapeutic portfolio targeting a range of LGR5-expressing cancer cells.

Keywords: ADC; BiTE; CAR; Cancer Immunotherapeutics; LGR5.


Conflict of interest statement

The authors declare no competing interests. The LGR5 antibodies in the manuscript and all commercial use fall under patent filing PCT/GB2023/050512, inventors—Maike de la Roche and Marc de la Roche.

Figures

Figure 1
Figure 1. Validation of novel α-LGR5 antibody clones.
(A) Western blot analysis of HEK293T lysates expressing LGR family transgenes probed with α-LGR5, and antibodies raised against HA and vinculin. Arrowheads on the side of the top panel indicate the expected position of hLGR5-eGFP (upper) and endogenous LGR5 (lower). Arrowheads on the side of the middle panel indicate the expected sizes of the HA-tagged LGR5 family transgenes. The first lane labelled “ctrl” refers to lysates from HEK293T cells transfected with the parental pEGFP-C2 plasmid. Western blots are representative of three independent experiments. (B) Epitope mapping of α-LGR5 with overlapping fragments from the 101 amino acid antigen sequence (Fig. EV1A) traces the α-LGR5 epitope to Frag1A encompassing the N-terminal 15 amino acids of the mature human LGR5. Western blots are representative of two independent experiments. (C) FL-α-LGR5 detection of LGR5 (red) in HEK293T cells overexpressing eGFP-fused human LGR4-6 transgenes (hLGR4-6) and cynomolgus LGR5-eGFP (cLGR5-eGFP; green). In the second row of panels, pre-incubation of FL-α-LGR5 with Frag1A, abolishes the signal for hLGR5-eGFP. Blue, DAPI fluorescence showing nuclei. Scale bars, 10 μm. Images shown are representative of four independent experiments. (D) Flow cytometric analysis of HEK293T cells expressing hLGR family transgenes using FL-α-LGR5 and eGFP for detection. Second panel—pre-incubation of FL-α-LGR5 with Frag1A abrogates the signal detecting hLGR5-eGFP expressing cells. Images are representative of three independent experiments. Source data are available online for this figure.
Figure 2
Figure 2. Census of healthy tissues and cancers for LGR5 expression levels.
(A) Sections from a CRC tumour resection showing LGR5 and β-catenin expression in—top panels: normal tissue; middle panels: dysplastic tissue; and lower panels: CRC. Blue, DAPI fluorescence showing nuclei. White numbers in the top right corner of panels (showing LGR5 expression and nuclei staining) correspond to relative levels of LGR5 protein using the scoring criteria applied to all TMAs (see the text). Scale bar, 40 μm. Arrowhead in inset, very rare (<0.1% of all cells) LGR5+ cell in healthy colon epithelium. (B) Relative LGR5 protein expression quantified in healthy colon epithelia and CRC tumour stages I–IV scored. Each dot represents a single-scored biopsy on the Bern 225 biopsy TMA. Biopsies were scored in a single experiment. Date is presented as mean expression, error bars are +/− standard error of the mean (SEM). (C) Immunofluorescence using Fl- α-LGR5 and an antibody to β-catenin for—top panels: a healthy liver sample; and bottom right panels: a sample from the Cambridge HCC TMA. Numbers in white correspond to scored LGR5 expression levels using the criteria for evaluating the TMA. Arrowhead, cell clusters within the tumour with high levels of cortical β-catenin and low levels of LGR5 levels. White numbers represent scored values for relative LGR5 protein expression. Scale bar, 40 μm. (D) Quantitation of LGR5 protein expression levels in eight healthy liver resections (Liver) and biopsies from the Cambridge HCC 105 biopsy TMA (HCC). Biopsies expression levels were scored in a single experiment. Data is presented as mean expression of the biopsies, +/− SEM. (E) Quantitation of LGR5 expression levels in biopsies of healthy Fallopian tube, ovarian cancer (OvC) and omentum metastasis (OmM) cases comprising the Cambridge ovarian cancer TMA. There were no significant increases (ns) in LGR5 expression between the Fallopian tube and OvC and OmM samples. All 69 biopsies were scored in a single experiment presented as mean expression levels, +/− SEM. (F) Quantitation of LGR5 expression levels in samples from the Cambridge Brain cancer TMA- healthy brain tissue (Brain), low-grade glioma (LGG) and glioblastoma (GBM). There were no significant increases (ns) in LGR5 expression between Brain, LGG or GBM biopsies. A total of 15 biopsies were scored in a single experiment and presented as mean expression, +/− SEM. (G) Representative example of relative LGR5 protein expression levels in CD4+ T cells, CD8+ T cells and CD19+ B cells from healthy donor PBMCs determined by flow cytometry. A small number of CD19+ cells, <3% of the total population, express low levels of LGR5. The data shown is representative of three independent experiments using samples from five different healthy donors. (H) LGR5 transcript levels normalised to TBP, measured by quantitative RT-PCR, in healthy donor B cells (B cells; 10 samples), B-ALL cell lines (Cell lines; 9 lines), CD19-enriched cell populations from primary B-ALL cases (ALL 1°; 22 samples) and CD19-enriched populations from B-ALL tumour cells maintained as PDX models (ALL-PDX; 15 samples). Arrowhead, expression levels of the NALM6, REH and 697 cell lines as well as the CRH, LC2 and SQ1 patient samples. Data presented as mean expression, +/− SEM. (I) LGR5 protein expression in the CRH, LC2 and SQ1 patient samples determined by flow cytometry. Histograms show detection with either Fl-α-LGR5 (red), Fl-α-LGR5 pre-incubated with blocking Frag1A (light grey) or with isotype control (dark grey). The data shown represent two independent experiments for CRH and LC2 sample and one experiment from the SQ1 sample. Source data are available online for this figure.
Figure 3
Figure 3. Characterisation of LGR5 expression in pre-B-ALL and CRC cell lines.
(A) Relative LGR5 transcript levels in pre-B-ALL cell lines measured by quantitative RT-PCR with TBP as a reference gene. Data is presented as mean expression, error bars represent +/− standard deviation (SD) for six biological replicates. (B) Western blot analysis of LGR5 protein levels in lysates from pre-B-ALL cell lines using an antibody to tubulin as loading control. Data represents two independent experiments. (C) Indirect immunofluorescence of NALM6 cells using α-LGR5. Scale bar, 5 μm. Data represents two independent experiments. (D) Flow cytometric detection of Fl- α-LGR5 (red histograms) or fluorescent isotype control (grey histograms) association with NALM6 cells after 60 min incubation at 4 °C (top panel) or 37 °C (bottom panel). Data represents 1 experiment conducted at 4 °C and 4 independent experiments conducted at 37 °C. (E) Flow cytometric analysis of 697, REH or NALM6 cells after 60 min incubation at 37 °C with Fl- α-LGR5 (red histograms) or Fl- α-LGR5 together with Frag1A (control, grey histograms). Data are representative of three independent experiments. (F) Relative LGR5 transcript levels normalised to TBP in CRC cell lines measured by qRT-PCR. Data is presented as mean expression, +/− SD for three biological replicates except for LoVo cells, four biological replicates. Data are representative of 3–4 independent experiments. (G) Western blot analysis of LGR5 protein in CRC cell lines using α-LGR5 and an antibody to vinculin as loading control. The western blot is representative of three independent experiments. (H) Indirect immunofluorescence of LoVo cells using α-LGR5. Scale bar, 5 μm. Images are representative of two independent experiments. (I) Flow cytometric detection of Fl- α-LGR5 (red histograms) or Fl- α-LGR5 pre-incubated with Frag1A (grey histograms) association with LoVo and SW480 cells after 60 min incubation at 37 °C. Data represents a single experiment conducted using SW480 cells and four independent experiments with LoVo cells. (J) Relative LGR5 transcript levels normalised to TBP in HCC cell lines. Data is presented as mean expression, +/− SD for 3–4 biological replicates. (K) Western blot analysis of LGR5 protein levels in HCC cell lines using an antibody to actin as a loading control. Western blots are representative of two independent experiments. Source data are available online for this figure.
Figure 4
Figure 4. Rapid internalisation of cell surface LGR5.
(A) Time course of FL-α-LGR5 internalisation by LGR5-eGFP expressing HEK293T cells. Top right panel: enlarged image showing association of FL-α-LGR5 with the cell periphery after 5 min, followed by co-localisation with the internal LGR5-eGFP associated puncta within 30 min (third right panel). Bottom right panel: no association or internalisation of FL-α-LGR5 for cells expressing LGR4-eGFP. Internalisation data is representative of two independent experiments. Scale bar, 10 µm. (B) Time course of red fluorescent-labelled Fl-α-LGR5v4 (red) internalisation by NALM6 cells. Incubations were fixed at various timepoints and probed with fluorescent phalloidin (green) and Hoechst (blue). Insets (top right) show Fl-α-LGR5v4 (red) channel only. In the bottom right panel, a red fluorescent-labelled version of the control Fl-α-LGR5v6 was used and no internalisation was observed. Data are derived from a single experiment. Scale bar, 10 µm. (C) Flow cytometric analysis of LoVo and NALM6 cells after 60 min of incubation with Fl-IgG1 (orange), and Fl-α-HER2 (blue) with either Fl-α-LGR5v4 (red). Data represent a single experiment. Each panel is a composite of the individual analyses in Appendix Fig. S3B. (D) Time course of Fl-α-LGR5v4 and Fl-α-HER2 association with LoVo cells. Percent association was scored as fraction of cells associated with fluorescent signals from Fl-α-HER2 (light grey bars) or Fl-α-LGR5v4 (dark grey bars) at the indicated timepoints per field of view (example images shown in Appendix Fig. S3D). Datapoints are average of 6 separate scoring set ups, each measuring at 80–200 cells per condition over 2 independent experiments. Data is presented as mean expression, +/− SD amongst scoring experiments. (E) Time course of percent internalisation of Fl-α-LGR5v4 and Fl-α-HER2 by LoVo cells. Internalisation data scores 6 experimental counts of 80–200 cells over two independent experiments. Data are presented as mean expression, +/− SD. Source data are available online for this figure.
Figure 5
Figure 5. Targeting of cancer cells with α-LGR5-ADC.
(A) Survival of NALM6 or REH cell lines after 72 h treatment with α-LGR5-ADC. Survival data was fit to a non-linear EC50 shift model yielding EC50 values of 4 and 10 nM, respectively. As control, NALM6 cells were treated with the non-cleavable α-LGR5-ADCNC which did not reduce the cell count after 72 h. Data represent two independent experiments for each treatment. (B) LoVo cells were treated with either α-LGR5-ADC or the non-cleavable α-LGR5-ADCNC. Modelling of cell survival data to a non-linear EC50 shift model yielded an EC50 of 9 nM. Data represent two independent experiments for each treatment. (C) Quantification of NALM6 tumour size measured by IVIS imaging over the course of the treatment with either 5 mg/kg α-LGR5-ADC or IgG1-ADC control. Red arrows indicate treatments on days 6, 8, 10 and 12 PI. Data are presented as mean expression, +/− SD at each timepoint. Data represents n = 4 mice for each treatment group. (D) IVIS images of IgG1-ADC and α-LGR5-ADC-treated mice, ventral view, on day 19 post implantation. (E) Top left: spleen mass and absolute number of NALM6 cells extracted from spleen (top right) of treated mice at experimental endpoint, day 20 PI. Bottom left: density of NAML6 cells in blood circulation; bottom right—NALM6 cells recovered from bone marrow. Data are presented as mean expression, +/− SD for data from n = 4 mice per treatment group. (F) Quantification of NALM6 tumour size by IVIS imaging over the course of the treatment with either 5 mg/Kg α-LGR5v4-ADC or α-LGR5v6-ADC. Antibody symbols indicate treatments on days 6 and 8 post implantation. Data are presented as mean expression, +/− SD at each timepoint for data from n = 4 mice for each treatment group. (G) IVIS images of α-LGR5v4-ADC or α-LGR5v6-ADC-treated mice, ventral view, at the experimental endpoint. (H) Top left: spleen mass and absolute number of NALM6 cells extracted from spleen (top right) of treated mice at experimental endpoint. Bottom left: density of NALM6 cells in blood circulation; bottom right—NALM6 cells recovered from bone marrow. Data is presented as mean expression, +/− SD for data from n = 4 mice per treatment group. ns no significant difference between treated cohorts. Source data are available online for this figure.
Figure 6
Figure 6. In vitro killing activity and in vivo efficacy performance of α-LGR5-based BiTE molecules.
(A) CL- and LC-mediated activation of CD4+ T cells in healthy donor PBMCs in the presence or absence of NALM6 target cells determined as percent cells with combined expression of CD25 and CD69. Control (ctrl), no addition of molecule, scFv refers to treatment with the α-LGR5scFv fragment. Data are presented as mean expression, +/− SD from two independent experiments using three different healthy donor PBMCs. (B) CL- and LC-mediated activation of CD8+ T cells in healthy donor PBMCs in the presence or absence of NALM6 target cells determined as percent cells with combined expression of CD25 and CD69. scFv is the control α-LGR5scFv fragment. Data is presented as mean expression, +/− SD of two independent experiments using three different healthy donor PBMCs. (C) NALM6 target cell killing by cytotoxic CD8+ T cells in the absence (ctrl) or with the addition of scFv control or LC and CL-BiTEs, respectively. Killing was assessed after 6 h at effector to target cell ratios of 5:1 and 10:1. Data shown are from n = 4 independent experiments using three donors and is presented as mean expression, +/− SD. (D) In vivo efficacy of CL-BiTE was determined in the NALM6 tumour model. Mice were treated with two doses of 100 μg CL-BiTE each and 7–10 × 106 PBMCs at days 3 and 7 post implantation. Tumour size was measured by IVIS imaging over the course of the treatment. Control mice were treated with 7–10 × 106 PBMCs in the absence of CL-BiTE. Data are presented as mean expression, +/− SD. Right panels: IVIS images of control and treated mice on day 11 post implantation. Data for 2 independent experiments is shown. (E) Numbers of NALM6 cells were determined per femur at endpoint on day 11 post implantation. Data shown are pooled from two independent experiments: one set treated with CD8 T cells +/− CL-BiTE and the other with PBMCs +/− CL-BiTE and normalised to the respective PBMC or CD8+ T-cell alone control. Data are presented as mean expression, +/− SD for n = 11–13 mice per condition. (F) Assessment of LGR5 protein levels in splenic NALM6 tumour cells post CL-BiTE treatment on day 11. Consecutive sections of spleens from mice treated with PBMCs or PBMCs plus CL-BiTE were imaged using an antibody to the human B-cell marker CD20 (to discriminate NALM6 cells) and α-LGR5. Data is presented as mean expression, +/− SD and is representative of two independent experiments. Scale bar: 2 mm (overview). Scale bar: 100 μm (zoom). Source data are available online for this figure.
Figure 7
Figure 7. LGR5scFV-CAR-T cells specifically kill LGR5+ cancer cells and show pre-clinical efficacy in vivo.
(A) HEK293T target cells expressing eGFP-fusions of mLgr5, hLGR4, hLGR5, hLGR6, or cLGR5 were incubated with LGR5scFv-CAR-T cells at an effector-to-target ratio of 10:1 for 9 h. Data are presented as mean expression, +/− SD for treatment with T cells and LGR5scFv-CAR-T cells generated from three independent healthy donors. (B) Killing kinetics of NALM6, LoVo and HepG2 tumour cells incubated in the presence of mock treatment (no T cells), treatment with non-transduced T cells or LGR5scFv-CAR-T cells at an effector-to-target ratio of 10:1. Data shown is derived from three independent experiments with 2–6 technical replicates per experiment using T cells from different healthy donors. Data are presented as mean expression, +/− SEM. (C) In vivo efficacy trial evaluating vehicle control treatment (PBS), or treatment with non-transduced T cells or LGR5scFv-CAR-T cells using the NALM6 tumour model. Mice were injected with 1 × 106 NALM6 tumour cells i.v. On days 4 and 7 post implantation (red arrows) tumour-bearing mice were injected i.v. either with PBS or 2.5–5 × 106 effector cells (non-transduced T cells or LGR5scFv-CAR-T cells). Mice were imaged on days 3, 4, 7 and 10 and prior to experimental endpoint on day 11. Data from two independent experiments are presented as mean expression, +/− SD. (D) Representative IVIS images of treated mice on day 10. (E) At the experimental endpoint, NALM6 cells were recovered from one tibia and one femur per mouse and enumerated. Data is representative of three replicate experiments with cells from 3 to 5 mice per treatment group and is presented as mean expression, +/− SD. Source data are available online for this figure.
Figure EV1
Figure EV1. Specificity of LGR5 antibodies generated in the study.
(A) Amino acid sequence of the human LGR5 antigen used for mouse immunisation and generation of α-LGR5; numbering starts at Gly1 in the processed human LGR5 (hLGR5), lacking the signal sequence. The sequence is annotated with the Fragments used in the RAD display experiments that map the α-LGR5 epitope to Frag1A. Fragments do not cover sequences that match the murine Lgr5. Below – location of the antigenic region (in red) within the structure of the extracellular domain of LGR5 (atomic coordinates for the model taken from (Peng et al, 2013). (B) Configuration of the LGR family transgenic constructs used in the study. All expressed LGR proteins contain a common N-terminal hemagglutinin (HA) tag and fusion at the C-terminus to the vasopressin V2 receptor C-terminal tail (V2R) followed by eGFP. (C) Western blot analysis of HEK293T lysates expressing the murine LGR5 (mLGR5), the human LGR5 (hLGR5) and the cynomolgus LGR5 (cLGR5) probed with α-LGR5 hybridoma clones 1, 3 and 4 and antibodies to HA and vinculin, as noted. No specific immune reactivity was observed when probing the western blots with the other 14 hybridoma clones. (D) Sequence conservation amongst the α-LGR5 hybridoma clones within the complementary determining regions (CDRs). Conserved amino acids relative to α-LGR5 clone 1 for clones 2–4 are represented by a dash. Amino acid differences are indicated “X”. (E) Western blot analysis of the Fragments delineated above (Fig. EV1A) as RAD-displayed fusion peptides using α-LGR5 hybridoma clones 1 (top panel), 3 (middle panel) and 4 (bottom panel). (F) Sequence alignment of the N-terminal 15 amino acids of human LGR5, corresponding to Frag1A, with the corresponding region in the other LGR family members. Sequences were aligned based on three invariant cysteine residues denoted by asterisks. The amino acid difference in the cynomolgus sequence is underlined. (G) Wnt pathway reporter assays (TopFlash assays) for HEK293T cells transfected with either eGFP or human LGR5-eGFP (hLGR5-eGFP), treated with Wnt3A ligand, R-spondin and either IgG1 or α-LGR5 at levels of approximately 10-fold molar excess over Wnt3A ligand. ns, no significant difference. Data is presented as mean expression, +/− SD for 3 biological replicates. ns, no significant difference in Wnt pathway reporter activity. (H) Immunofluorescent detection of HEK293T cells expressing transgenic LGR4-eGFP or LGR5-eGFP (left panels, green) using Fl-α-LGR5 (middle panels, red). Right panels merged fluorescent signals. Scale bars, 10 μm. (I) Flow cytometric analysis of HEK293T cells expressing mLGR4-eGFP (top left), mLGR5-eGFP (top right) and hLGR5-eGFP (bottom panels) using Fl-α-LGR5. For analysis of the hLGR5-eGFP expressing HEK293T cells, Fl-α-LGR5 was pre-incubated with either RAD-Frag1A or RAD-Frag1B (bottom left and right). Source data are available online for this figure.
Figure EV2
Figure EV2. Sensitivity of CRC organoid models expressing variable LGR5 levels to α-LGR5v4-ADC treatment.
(A) Immunofluorescent imaging of LGR5 in CRC organoid models. Images are representative of 2 independent experiments. Scale bar, 20 µm. (B) Relative LGR5 transcript levels in the CRC organoids models measured by quantitative qRT-PCR with TBP as a reference gene. Data is presented as mean expression, +/− SD for 3 biological replicates. (C) CRC organoid model killing with α-LGR5v4-ADC treatment quantified as the percent of CRC organoids at each treatment level that displayed more than 20% of cleaved caspase 3 positive component cells. Data for treatment of each organoid model is derived from a minimum of 10 datapoints at each concentration of α-LGR5v4-ADC with 2–3 independent biological replicates. Data is presented as mean expression, +/− SD. Source data are available online for this figure.
Figure EV3
Figure EV3. Differential sensitivity of pre-B-ALL and CRC cell lines as well as B-ALL patient samples to treatment with PBMCs and CL-BiTE.
(A) LGR5low and LGR5high expressing human pre-B-ALL cell lines were incubated in the presence of cytotoxic CD8+ T cells with either scFv control or CL-BiTEs. Killing was assessed after 6 h at effector to target cell ratios of 5:1 and 10:1. Data shown is from one experiment using CD8+ T cells isolated from four individual healthy donors and is presented as mean expression, +/− SD. (B) LGR5low and LGR5high expressing human CRC cell lines were incubated in the presence of cytotoxic CD8+ T cells with either scFv control or CL-BiTEs. Killing was assessed after 6 h at effector to target cell ratios of 5:1 and 10:1. Data shown is from one experiment using CD8+ T cells isolated from four individual healthy donors and is presented as mean expression, +/− SD. (C) LGR5low and LGR5high expressing human pre-B-ALL patient samples were incubated in the presence of cytotoxic CD8+ T cells with either scFv control or CL-BiTEs. Killing was assessed after 9 h at an effector to target cell ratio of 10:1. Data shown is from one experiment using CD8+ T cells isolated from four individual healthy donors and error bars represent mean +/− SD. Source data are available online for this figure.
Figure EV4
Figure EV4. Differential sensitivity of pre-B-ALL and CRC cell lines as well as pre-B-ALL patient samples to treatment with LGR5scFV-CAR-T cells.
(A) Increased killing of LGR5high preB-ALL NALM6 cells relative to LGR5low 697 cells by LGR5scFV-CAR-T cells. Data shown is from two experiments using LGR5scFV-CAR-T cells generated from a total of four independent healthy donors and is presented as mean expression, +/− SD. (B) Reduced sensitivity to LGR5scFV-CAR-T-cell killing of LGR5low CRC SW480 cells relative to LGR5high LoVo cells. Data shown is from two experiments using LGR5scFV-CAR-T cells generated from a total of three independent healthy donors and is presented as mean expression, +/− SEM. (C) The LGR5high CRH patient-derived pre-B-ALL cell model is more sensitive to killing by LGR5scFV-CAR-T cells compared to LGR5low pre-B-ALL LC2 patient cells. Data shown is from one experiment using LGR5scFV-CAR-T cells generated from a total of three independent healthy donors and is presented as mean expression, +/− SD. Source data are available online for this figure.

References

    1. Adams GP, Weiner LM (2005) Monoclonal antibody therapy of cancer. Nat Biotechnol 23:1147–1157 - PubMed
    1. Bargh JD, Walsh SJ, Isidro-Llobet A, Omarjee S, Carroll JS, Spring DR (2020) Sulfatase-cleavable linkers for antibody-drug conjugates. Chem Sci 11:2375–2380 - PMC - PubMed
    1. Barker N, Huch M, Kujala P, van de Wetering M, Snippert HJ, van Es JH, Sato T, Stange DE, Begthel H, van den Born M et al (2010) Lgr5+ve stem cells drive self-renewal in the stomach and build long-lived gastric units in vitro. Cell Stem Cell 6:25–36 - PubMed
    1. Barker N, Rookmaaker MB, Kujala P, Ng A, Leushacke M, Snippert H, van de Wetering M, Tan S, Van Es JH, Huch M et al (2012) Lgr5+ve stem/progenitor cells contribute to nephron formation during kidney development. Cell Rep 2:540–552 - PubMed
    1. Berraondo P, Ochoa MC, Olivera I, Melero I (2019) Immune desertic landscapes in hepatocellular carcinoma shaped by β-catenin activation. Cancer Discov 9:1003–1005 - PubMed

LinkOut - more resources