. 2024 Aug;632(8027):1110-1117.
doi: 10.1038/s41586-024-07835-w. Epub 2024 Aug 21.

Lysosomes drive the piecemeal removal of mitochondrial inner membrane

Affiliations

Lysosomes drive the piecemeal removal of mitochondrial inner membrane

Akriti Prashar et al. Nature. 2024 Aug.

Abstract

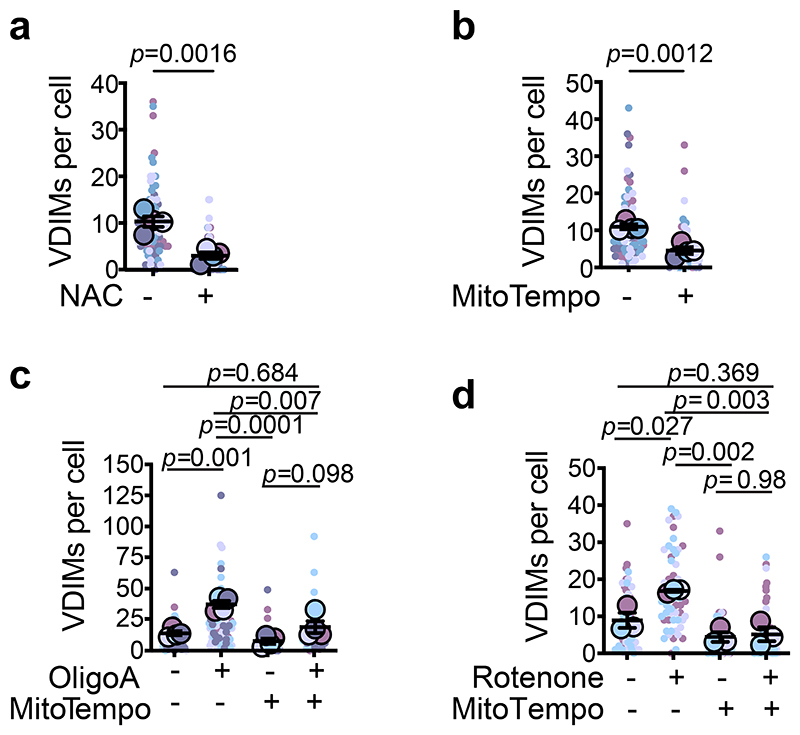
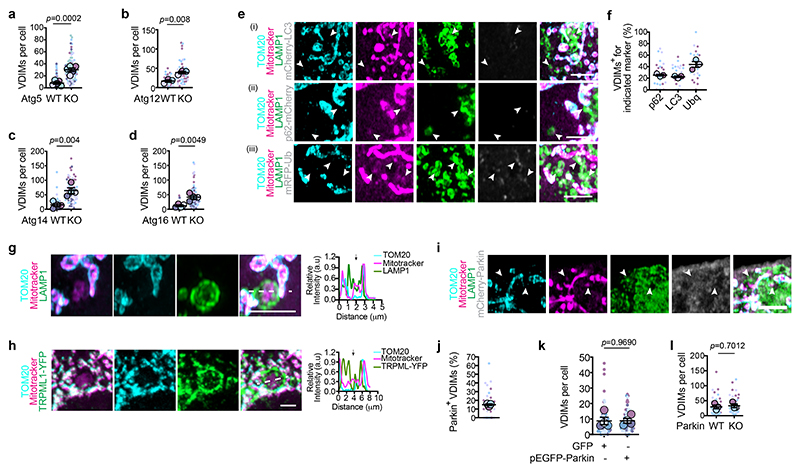
Mitochondrial membranes define distinct structural and functional compartments. Cristae of the inner mitochondrial membrane (IMM) function as independent bioenergetic units that undergo rapid and transient remodelling, but the significance of this compartmentalized organization is unknown1. Using super-resolution microscopy, here we show that cytosolic IMM vesicles, devoid of outer mitochondrial membrane or mitochondrial matrix, are formed during resting state. These vesicles derived from the IMM (VDIMs) are formed by IMM herniation through pores formed by voltage-dependent anion channel 1 in the outer mitochondrial membrane. Live-cell imaging showed that lysosomes in proximity to mitochondria engulfed the herniating IMM and, aided by the endosomal sorting complex required for transport machinery, led to the formation of VDIMs in a microautophagy-like process, sparing the remainder of the organelle. VDIM formation was enhanced in mitochondria undergoing oxidative stress, suggesting their potential role in maintenance of mitochondrial function. Furthermore, the formation of VDIMs required calcium release by the reactive oxygen species-activated, lysosomal calcium channel, transient receptor potential mucolipin 1, showing an interorganelle communication pathway for maintenance of mitochondrial homeostasis. Thus, IMM compartmentalization could allow for the selective removal of damaged IMM sections via VDIMs, which should protect mitochondria from localized injury. Our findings show a new pathway of intramitochondrial quality control.


Conflict of interest statement

Competing interests: Authors declare that they have no competing interests.

Figures

ED Fig. 1
ED Fig. 1. Cytosolic IMM-derived vesicles lack matrix and OMM
a, TOM20 and NAO localization. Inner mitochondrial membranes were labeled with NAO (green) in cells expressing mito-BFP (cyan) and mApple-TOM20 (magenta). Higher magnifications of indicated regions are shown in Fig.1a. b, Localization of TMRE (magenta), NAO (green) in cells expressing mito-BFP (cyan). Higher magnifications of indicated regions are shown. Arrowheads indicate mito-BFP-/NAO+/TMRE+ vesicles. Right: Pixel intensity plots for dashed line. Arrow indicates the vesicle. c, NAO (green), mitotrackerCMXRos (mitotracker) (magenta) localization in cell expressing mito-BFP (cyan). Higher magnifications of indicated regions are shown. Arrowheads indicate mito-BFP-/NAO+/mitotracker+ vesicle. Right: Pixel intensity plots for dashed line. Arrow indicates the vesicle. d, Percentage of vesicles positive for IMM markers NAO and mitotracker, but negative for mito-BFP from experiments as in (c) (n=365 vesicles, 30 cells, 3 experiments). Data shown are mean±SEM shown as large circles and individual data points from corresponding experiments are shown in the same color (e) Representative images from at least three independent experiments showing mitotracker (magenta) and TOM20 (green) localization. Higher magnifications of indicated regions are shown in Fig.1c. Scale bars: main panels10μm, magnified panels 3μm.
ED Fig. 2
ED Fig. 2. Validating specificity of IMM in VDIMs
a, Effect of fixation conditions on mitotracker+/TOM20- vesicles. Cells labeled with mitotracker (100nM, 15min, 37oC) were either fixed for 15 min at room temperature (RT), 4oC overnight or at 37oC in pre-warmed 4% paraformaldehyde for 10min (n=60 cells, 3 experiments). b, Effect of mitotracker concentration on mitotracker+/TOM20- vesicles. Cells were stained with indicated concentrations of mitotracker (n= 62 cells for 50nM, 64 cells for 100 nM, 53 cells for 200nM, 3 experiments). c-g, Mitotracker+/TOM20- vesicles are cell-type independent. Spinning disc confocal images of mitotracker+/TOM20- vesicles in (c) AGS (n=4 experiments), (d) NCI-H292 (n=4 experiments), (e) HeLa (n=2 experiments), (f) COS-1 (n=2 experiments), and (g) Mode-K (n=3 experiments) cells. For all images, numbers at the bottom indicate the number of vesicles (mean±SEM), and higher magnifications from indicated regions from main panels are shown to the right. Inverse color micrographs for mitotracker channel are shown. Red circles indicate the mitotracker+/TOM20- vesicles. h,i, Mitotracker does not label membranes non-specifically. Spinning disc confocal images showing localization of mitotracker (magenta) and ER specific Calnexin (green) (h), or Golgi specific GM130 (green) (i). Right: Pixel intensity plot for dashed lines. j, Schematic illustrating the protocol for depleting mitochondria from HeLa cells stably expressing Mito-dsRed and pEGFP-Parkin. k, Western blot showing the depletion of mitochondrial proteins in cells from (j). Right: Protein expression relative to actin. l, Spinning disc confocal images showing lack of mitochondrial labeling by mitotracker (magenta) in HeLa cells expressing mito-dsRed (blue) and pEGFP-Parkin (green), labeled with anti-TOM20 antibodies (cyan) in an experiment as in (j). Data shown are mean±SEM from three independent experiments. Statistical significance was calculated using One-way ANOVA followed by Tukey’s multiple-comparison test in (a-b), and two-tailed Student’s unpaired t-test in (k). P values calculated are shown. Gel source data for (k) are provided in Supplementary Fig.1. Scale bars: main panels 10μm, magnified panels 3μm.
ED Fig. 3
ED Fig. 3. VDIMs are derived from the IMM
a-i, Localization of mitotracker along with markers associated with different mitochondrial compartments. a,b, Representative images showing localization of mitotracker (magenta) and OMM localized (a) Omp25 (green) and TOM20 (cyan), or (b) VDAC1 (green) and mEmerald-TOM20 (cyan). Higher magnifications of the indicated regions are shown in Fig.1g. c, Representative images showing localization of mitotracker (magenta) and mitochondrial intermembrane space-localized cytochrome C (green). OMM was labeled with anti-TOM20 antibodies (cyan). Higher magnifications of the indicated regions are shown in Fig.1h. d,e, Representative images showing localization of mitotracker (magenta), TOM20 (cyan) and mitochondrial matrix-localized (d) SOD2 (green) and (e) PDH (green). Higher magnifications of the indicated regions are shown in Fig.1i. f-i, Representative images showing localization of mitotracker (magenta) in cells expressing mEmerald-TOM20(cyan) and mitochondrial IMM-localized (f) UCQCRC2, (g) Atp5α, (h) COXIV and (i) Atp5L (green). Higher magnifications of the indicated regions are shown in Fig1j. (j) Representative images showing MEFs labeled with mitotracker (magenta), anti-TOM20 antibodies (cyan) and high concentration of DAPI (5μg/ml). Higher magnifications of indicated regions are shown in Fig.1m. k, Localization of TOM20 (cyan) and mitotracker (magenta) in cells expressing TFAM-mScarlet (green). Higher magnifications of indicated regions are shown in Fig.1o. l, Localization of TOM20 (cyan) and mitotracker (magenta) in cells expressing POLG2-tGFP (green). Higher magnifications of indicated regions are shown in Fig.1q. m, Representative western blot showing the efficiency of Mic60 knockdown. Cells were treated with indicated siRNA. n, VDIM formation in cells treated with indicated siRNA. Mitochondria were labeled with mitotracker (magenta) and anti-TOM20 antibodies (green). Representative confocal images from three independent experiments (a-l) and four independent experiments (n) are shown. Gel source data for (m) are provided in Supplementary Fig.1. Scale bars: main panels 10μm, magnified panels 3μm. Red circles in the inverted mitotracker micrographs indicate the VDIMs.
ED Fig. 4
ED Fig. 4. VDIMs are distinct from MDVs and MDCs
a, VDIMs are larger than MDVs. Size difference between the Tom20 (green) or PDH (cyan) positive mitochondria derived vesicles (MDVs) (indicated by open circles), and mitotracker+/TOM20- vesicles (arrowheads). Bottom: Higher magnifications of indicated regions. b, Size difference between the Tom20 (green) or PDH (cyan) positive mitochondria derived vesicles (MDVs) (indicated by open circles), and mitotracker+/TOM20- vesicles (arrowheads) in experiments as in (a) (n= 562 vesicles, 30 cells, 3 experiments for PDH+/TOM20- vesicles; n=605 vesicles, 30 cells, 3 experiments for PDH-/TOM20+ vesicles; n=436 vesicles, 30 cells, 3 experiments for mitotracker+/TOM20- vesicles). c, Representative spinning disc confocal images showing VDIM formation in WT and Drp1-/- MEFs. Arrowheads indicate VDIMs. d, Number of VDIMs in WT and Drp1-/- (KO) MEFs in experiments as in (c) (n= 80 cells, 4 experiments). e, Representative western blot (n=4 experiments) showing loss of Miro1 expression in cells treated with non-targeting (NT) siRNA or siRNA against Miro1. f, Representative spinning disc confocal images showing VDIM formation in cells treated with NT or Miro1 siRNA an experiment as in (e). Arrowheads indicate VDIMs. g, Number VDIMs in cells treated with non-targeting (NT) or Miro1 siRNA in experiments as in (f) (n= 90 cells, 4 experiments). h, Representative western blot (n=4 experiments) showing loss of sorting nexin 9 (Snx9) expression in cells treated with non-targeting (NT) siRNA or siRNA against Snx9. i, Representative spinning disc confocal images showing VDIM formation in cells in experiments as in (h). j, Number of VDIMs in cells treated with non-targeting (NT) or syntaxin 9 (snx9) siRNA in experiments as in (i) (n= 90 cells, 4 experiments). Data shown are mean±SEM from three independent experiments. Statistical significance was calculated using two-tailed Student’s unpaired t-test. Gel source data for (e,h) are provided in Supplementary Fig.1. Scale bars: main panels 10μm, magnified panels 3μm.
ED Fig. 5
ED Fig. 5. VDIM formation for intramitochondrial QC
a, VDIM formation is inhibited by quenching ROS. Representative spinning disc confocal micrographs showing the effect of NAC on VDIM formation. Red circles in the inverted color mitotracker micrographs indicate VDIMs. b,c, Representative confocal micrographs showing the effect of inducing oxidative stress on VDIM formation. Cells were treated with (b) oligomycinA, mitoTempo or oligomycinA+mitoTempo, or (c) with rotenone, mitoTempo or rotenone+mitoTempo. Mitochondria were labeled with mitotracker (magenta) and anti-TOM20 antibodies (green). Red circles in the inverted color mitotracker micrographs indicate VDIMs. d, Representative images showing oxidation of MitoCLox in cells treated with H2O2. e, Representative images showing oxidized MitoCLox in VDIMs (n= 3 experiments). Right: Higher magnification of indicated regions. f, Ratio of oxidized/total MitoCLox in indicated regions from (e). g, Localization of 8-OHdG (green) with VDIMs (arrowheads). Bottom: Pixel intensity plot for dashed line. Arrow indicates the vesicle. h, Percentage of VDIMs positive for 8-OHdG in experiments as in (g). (n=272 vesicles, 32 cells, 3 experiments). i, Representative spinning disc confocal images showing localization of TOM20 (cyan), mitotracker (magenta) and LAMP1 (green) in 143bρ0 and 143bρ+ cells. Cells were left untreated or treated with vehicle or Rotenone. Higher magnifications of indicated regions are shown to the right. j, Quantification of VDIM formation in 143b cells lacking mitochondrial DNA (ρ0) along with controls (ρ+) (143bρ0 n= 70 cells for untreated, 63 cells for vehicle, 60 cells for rotenone and 143bρ+ n=66 cells for untreated, 61 cells for vehicle, 60 cells for rotenone, 3 experiments). Data shown are mean±SEM shown as large circles and individual data points from corresponding experiments shown in the same colors. Statistical significance was calculated using One-way ANOVA followed by Tukey’s multiple-comparison test. P values calculated are indicated. Scale bars: main panels 10μm, magnified panels 3μm.
ED Fig. 6
ED Fig. 6. VDIMs are delivered to lysosomes for degradation
a, Mitotracker (magenta), TOM20 (cyan) and LAMP1 (green) localization. Higher magnifications of indicated regions are shown in Fig.3a. b, Localization of mitotracker (grey), TOM20 (cyan) and MCU-GFP-mCherry. Higher magnifications of indicated regions are shown in Fig.3d. c, Left: Fluorescence, and Right: EM image of cell used for CLEM. Higher magnification of indicated region is shown in Fig. 3f. d, Live-cell imaging showing mito-BFP-/mitotracker+ (magenta) vesicles being delivered to lysosomes labeled with dextran (green). Arrowheads indicate the VDIM pinching from the mitochondria and sorted to the lysosome. Images were acquired every 5sec. e-l, VDIMs are not partially degraded mitochondria. e, Representative spinning disc confocal micrographs showing the effect of bafilomycin (BafA1) on VDIM formation. Right: Higher magnifications of indicated regions. Red circles in inverted micrograph for mitotracker indicate the VDIMs. f, Representative spinning disc confocal micrographs showing the effect of chloroquine (CQ) on VDIM formation. Right: Higher magnification of indicated regions. Red circles in inverted micrograph for mitotracker indicate the VDIMs. g, Localization of mitotracker (magenta), TOM20 (cyan) in cells expressing Omp25-GFP (green), treated with vehicle (-) or BafA1. Arrowheads indicate the VDIMs. (h) Localization of mitotracker (magenta), TOM20 (cyan) and PDH (green) in cells treated with vehicle (-) or BafA1. Arrowheads indicate the VDIMs. i, Localization of mitotracker (magenta), TOM20 (cyan) in cells expressing SOD2-GFP (green), treated with vehicle (-) or BafA1. Arrowheads indicate the VDIMs. j, Percentage of mitotracker+/TOM20- VDIMs positive for Omp25 in cells treated with BafA1 compared to vehicle treated cells from experiments as in (g) (n= 270 vesicles for vehicle, 503 vesicles for BafA1, 30 cells, 3 experiments). k, Percentage of mitotracker+/TOM20- VDIMs positive for PDH in cells treated with BafA1 compared to vehicle treated cells from experiments as in (h) (n= 270 vesicles for vehicle, 503 vesicles for BafA1, 30 cells, 3 experiments). l, Percentage of mitotracker+/TOM20- VDIMs positive for SOD2 in cells treated with BafA1 compared to vehicle treated cells from experiments as in (i) (n=369 vesicles for vehicle, 500 vesicles for BafA1, 30 cells, 3 experiments). (j-l) Mean±SEM are shown as large circles and individual data points from corresponding experiments are shown in the same colors. Statistical analysis was performed using two-tailed Student’s unpaired t-test. P values are indicated. Scale bars: main panels 10μm, magnified panels 3μm.
ED Fig. 7
ED Fig. 7. VDIMs are not multivesicular bodies (MVB)
a, Representative images showing mitotracker (magenta), TOM20 (cyan), LBPA (grey) in cells expressing LAMP1-GFP (green). Bottom: Higher magnification of indicated regions. Arrowheads indicate VDIMs lacking LBPA. Arrow indicates VDIM positive for LBPA. b, Number of VDIMs positive for LAMP1 or LBPA from experiments as in (a) (n=243 vesicles, 30 cells, 3 experiments). c, Representative images showing mitotracker (magenta), TOM20 (cyan), CD63 (grey) in cells expressing LAMP1-GFP (green). Bottom: Higher magnification of indicated regions. Arrowheads indicate VDIMs lacking CD63. Arrow indicates VDIM positive for CD63. d, Number of VDIMs positive for LAMP1 or CD63 from experiments as in (c) (n=167 vesicles, 17 cells, 2 experiments). e, Schematic illustrating lysosome and MVB fusion regulated by Arl8b GTPase. f, Localization of Lamp1 (magenta) and LBPA (green) in cells expressing GFP-Arl8b-WT (blue) or GFP-Arl8b-DN (blue). Right: Pixel intensity plots for dashed line. Arrows indicate LBPA negative lysosomes in cells expressing GFP-Arl8b-DN. g, VDIM formation in cells expressing GFP-Arl8b-WT (green) or GFP-Arl8b-DN (green). Higher magnification of indicated regions are shown where arrowheads indicate the VDIM. h, Number of VDIMs in cells expressing Arl8b-WT or Arl8b-DN in experiments as in (g) (n= 30 cells, 3 experiments). i, Number of LAMP1 positive VDIMs in cells expressing Arl8b-WT or Arl8b-DN in experiments as in (g) (n=30 cells, 3 experiments). Data shown are mean±SEM. Statistical significance was calculated using two-tailed Student’s unpaired t-test. P values calculated are indicated. Scale bars: main panels 10μm, magnified panels 3μm.
ED Fig. 8
ED Fig. 8. VDAC1 and TRPML1 mediate VDIM formation
a, VDIM formation in cells treated with vehicle or VBIT-12. b, Representative western blot showing the efficiency of VDAC1 knockdown (n=4 experiments). c, VDIM formation in cells treated with indicated siRNA. d, VDIM formation in cells treated with BAPTA-AM. e, VDIM formation in cells treated with apilimod. f, VDIM formation in cells treated with ML-SA1. g, Mitotracker (magenta), TOM20 (cyan) and PDH (green) localization in cells treated with VBIT-12 or ML-SA1. Arrowheads indicate the VDIMs. h, Percentage of mitotracker+/TOM20- VDIMs positive for PDH in experiments as in (g) (n=293 vesicles for vehicle, 535 vesicles for ML-SA1, 30 cells, 3 experiments for ML-SA1; n=342 vesicles for vehicle, 302 vesicles for VBIT-12, 30 cells, 3 experiments). i, Mitotracker (magenta), TOM20 (cyan) in cells expressing Omp25-GFP (green) treated with VBIT-12 or ML-SA1. Arrowheads indicate the VDIMs. j, Percentage of mitotracker+/TOM20- VDIMs positive for Omp25 in experiments as in (i). k, Validation of gene knockout in TRPML1 -/- MEFs. MLIV gene was amplified from WT and TRPML1 -/- MEFs and from DNA extracted from ear-notches of WT, KO and heterozygous (het) mice (n=1). l, Representative confocal micrographs showing VDIM formation in WT and TRPML1-/- MEFs. m, VDIM formation in TRPML1-/- MEFs treated with BafA1. n, Effect of TRPML1 re-expression on VDIM formation in TRPML1-/-MEFs. TRPML1-/- cells transiently transfected with GFP or TRPML1-YFP were treated with vehicle or BafA1. Data shown are means from 3 experiments. Representative spinning disc confocal micrographs are shown in (a, c-f, l-n). For all fluorescence images, higher magnifications of indicated regions are shown to the right. Red circles on the inverted fluorescence micrographs for the mitotracker channel indicate the VDIMs. Gel source data for (b) are provided in Supplementary Fig.2. Scale bars: main panels 10μm, magnified panels 3μm.
ED Fig. 9
ED Fig. 9. VDIMs form independently of macroautophagy
a, VDIM formation in MEFs lacking Atg5, Atg12, Atg14 and Atg16. Right: Higher magnification of indicated regions. b, VDIM formation in Atg5-/- MEFs. Representative confocal micrographs showing VDIM pinching off and being directly sorted into a lysosome. Right:3D-reconstruction of indicated region. c, Effect of scavenging ROS on VDIM formation. Cells were treated with vehicle (-) or NAC (+). d, Number of VDIMs in cells in experiments as in (c) (n=63 cells, 3 experiments). e, Effect of oxidative stress on VDIM formation. Cells were treated with vehicle, oligomycinA, mitoTempo or oligomycinA and mitoTempo together. f, Number of VDIMs in cells in experiments as in (e) (n= 75 cells for vehicle, 64 cells for oligomycinA, 73 cells for mitoTempo, 66 for oligomycinA+mitoTempo, 4 experiments). g, Effect of VDAC inhibition on VDIM formation. h, Number of VDIMs in cells treated with VBIT-12 in experiments as in (g) (n=75 cells, 3 experiments). i, Representative images showing VDIM formation in cells treated with indicated siRNA. j, Representative western blot showing the efficiency of VDAC1 knockdown (n=4 experiments). k, Number of VDIMs in VDAC1 depleted cells in experiments as in (i) (n=136 cell for NT, 127 for VDAC siRNA, 4 experiments). l, Representative images showing the effect of BAPTA-AM on VDIM formation. m, Number of VDIMs in cells treated with BAPTA-AM in experiments as in (l) (n= 87 cells for vehicle, 67 cells for BAPTA-AM, 3 experiments). n, Representative images showing VDIM formation in cells treated with ML-SA1. o, Number of VDIMs in cells treated with ML-SA1 in experiments as in (n) (n=66 cells for vehicle, 69 cells for ML-SA1, 3 experiments). p, Effect of VDAC1 inhibition on MCU-GFP-mCherry positive VDIMs. Cells expressing MCU-GFP-mCherry were treated with VBIT-12. q, Number of VDIMs positive for GFP+mCherry (yellow) and mCherry (red), indicating lysosomal quenching of GFP from experiments as in (p) (n= 412 vesicles for vehicle, 336 vesicles for VBIT-12, 30 cells, 3 experiments). r, Effect of TRPML1 activation by ML-SA1 on MCU-GFP-mCherry positive VDIMs. s, Number of VDIMs positive for GFP+mCherry (yellow) and mCherry (red), indicating lysosomal quenching of GFP from experiments as in (r) (n=229 vesicles for vehicle, 194 vesicles for ML-SA1, 20 cells, 2 experiments). t-v, Localization of TOM20 (cyan) and mitotracker (magenta) with indicated autophagy markers. Cells were transfected with (t) mCherry-LC3 (green), (u) p62-mCherry (green), (v) mRFP-Ub (green). Higher magnifications of indicated regions are shown in Fig.5e. Representative spinning disc confocal micrographs are shown in (a, c, e, g, i, l, n, p, r) where higher magnification of indicated regions are shown to the right. Red circles in inverted micrograph for mitotracker indicate the VDIMs. Data shown are mean±SEM shown as large circles and individual data points from corresponding experiments shown in the same colors. Statistical significance was calculated using two-tailed Student’s unpaired t-test in (d, h, k, m, o), and One-way ANOVA followed by Tukey’s multiple-comparison test in (f, q, s). P values calculated are indicated. Gel source data for (j) are provided in Supplementary Fig.1. Scale bars: main panels 10μm, magnified panels 3μm.
ED Fig. 10
ED Fig. 10. VDIMs form by ESCRT-mediated, microautophagy-like process
a, Representative images showing TOM20 (cyan), mitotracker (magenta) and LAMP1 (green). Higher magnifications of indicated regions are shown in Fig.5g. b, Representative images showing localization of TOM20 (cyan), mitotracker (magenta) and TRPML1 (green). Cells were transiently transfected with TRPML1-YFP. Higher magnifications of indicated regions are shown in Fig.5h. c, Localization of TOM20 (cyan) and mitotracker (magenta) in cells expressing mCherry-Parkin. Higher magnification of indicated region is shown in Fig.5i. d, Effect of Parkin overexpression on VDIM formation. Cells were transiently transfected with (top) GFP or (bottom) pEGFP-Parkin. Red circles in inverted micrographs for mitotracker indicate VDIMs. e, Representative images showing VDIM formation in Parkin-/- MEFs compared to WT controls. Circles in the inverted mitotracker micrograph indicate the VDIMs. f-h, Representative images showing localization of TOM20 (cyan), mitotracker (magenta) and LAMP1 (green) in cells transiently transfected with (f) Tsg101-GFP (grey), (g) Chmp2a-GFP (grey) or (h) Chmp4b-RFP (grey). Higher magnifications of indicated regions are shown in Fig.6a-c. i, Live-cell imaging sequence showing recruitment of Tsg101 (green) at sites of VDIM scission. Images were acquired every 5 sec. Arrowheads indicate the VDIMs and arrows indicate the Tsg101 puncta. j, Representative images showing mitotracker (magenta), TOM20 (cyan) and ALG-2 (grey). Higher magnifications of the indicated regions are shown in Fig. 6g. k, Representative western blot showing the efficiency of Tsg101 depletion compared to non-targeting (NT) controls. l, Representative images showing VDIM formation in cells treated with Tsg101 siRNA compared to NT controls. Right: Higher magnification of indicated regions. Red circles in inverted micrograph for mitotracker indicate the VDIMs. All data shown are representative from three independent experiments. d,e, Representative spinning disc confocal images are shown. Gel source data for (k) are provided in Supplementary Fig.1. Scale bars: main panels 10μm, magnified panels 3μm.
Fig. 1
Fig. 1. Selective sorting of mitochondrial inner membrane proteins into VDIMs
a, Cytosolic TOM20- /NAO+/ mito-BFP- vesicles (arrowheads) in MEFs expressing mito-BFP (cyan, matrix) and mApple-TOM20 (magenta, OMM), stained with NAO (green, IMM). Right: Pixel intensity plot for dashed line. Arrow indicates the vesicle. b, Number of TOM20-/ NAO+/mito-BFP- vesicles in experiments as in (a) (n=336 vesicles, 30 cells, 3 experiments). c, Representative images of mitotracker+/TOM20- vesicles (arrowheads). Right: Pixel intensity plot for dashed line. Arrow indicates the vesicle. d,e, Quantification of (d) number of mitotracker+/TOM20- vesicles (n=824 vesicles, 104 cells, 5 experiments), and (e) percentage of cells containing mitotracker+/TOM20- vesicles (n=104 cells, 5 experiments) in experiments as in (c). f, Size of mitotracker+/TOM20- vesicles in experiments as in (c) (n=548 vesicles, 42 cells, 4 experiments). g, Lack of localization of OMM localized proteins (i) GFP-Omp25 (green), or (ii) VDAC1 (green) with mitotracker+/TOM20- vesicles. h, Lack of localization of intermembrane space localized cytochrome C (green) with mitotracker+/TOM20- vesicles. i, Lack of localization of mitochondrial matrix localized proteins (i) SOD2-GFP (green) or (ii) PDH (green) with mitotracker+/TOM20- vesicles. j, Presence of IMM localized proteins, (i) UCQCRC (green), (ii) Atp5α (green), (iii) COXIV (green) or (iv) Atp5L (green) in mitotracker+/TOM20- vesicles in cells expressing m-Emerald-Tom20 (cyan). k, Percentage of mitotracker+/TOM20- vesicles positive for indicated mitochondrial markers from (g-j) (n=349 vesicles, 30 cells, 3 experiments for Omp25; n=282 vesicles, 31 cells, 3 experiments for VDAC1; n=312 vesicles, 33 cells, 3 experiments for cyto C; n=288 vesicles, 30 cells, 3 experiments for SOD2; n=294 vesicles, 30 cells, 3 experiments for PDH; n=286 vesicles, 29 cells, 3 experiments for UCQCRC2; n=216 vesicles, 30 cells, 3 experiments for COXIV; n=210 vesicles, 31 cells, 3 experiments for Atp5α; n=267 vesicles, 30 cells, 3 experiments for Atp5L). l, Schematic showing the mitochondrial markers analyzed for their localization with mitotracker+/TOM20- vesicles. m-r, Presence of mtDNA in VDIMs. m, VDIMs in cells stained with DAPI. Right: Pixel intensity plot for dashed line. Arrow indicates the vesicle. n, Percentage of VDIMs positive for DAPI in experiments as in (m) (n= 442 vesicles, 70 cells, 3 experiments). o, VDIMs (arrowheads) in cells expressing TFAM-mScarlet (green). Right: Pixel intensity plot for dashed line. Arrow indicates the vesicle. p, Percentage of VDIMs positive for TFAM in experiments as in (o) (n=484 vesicles, 30 cells, 3 experiments). q, VDIMs (arrowheads) in cells expressing POLG2-tGFP (green). Right: Pixel intensity plot for dashed line. Arrow indicates the vesicle. r, Percentage of VDIMs positive for POLG2 in experiments as in (q) (n=347 vesicles, 30 cells, 3 experiments). s, Schematic illustrating the effect of silencing Mic60 on IMM organization. t, Number of VDIMs in cells treated with non-targeting (NT) or Mic60 siRNA (n=123 cells for NT, 121 cells for Mic60 siRNA, 4 experiments). (e, k, n, p, r) Data shown are mean±SEM. (b, d, f, t) Mean±SEM are shown as large circles and individual data points from corresponding experiments are shown in the same colors. Statistical analysis was performed using two-tailed Student’s unpaired t-test. P values are indicated. (b, e, k, n-r) Quantifications from Airyscan images. (g-j) Pixel intensity plots for dashed lines are shown to the right. Arrow indicates the vesicles. Rainbow pseudo-colored images for the indicated mitochondrial markers are shown. Representative images from three independent experiments are shown. All scale bars: 3μm
Fig. 2
Fig. 2. VDIM formation as an intramitochondrial quality control mechanism
a,b, Effect of scavenging ROS on VDIM formation. Cells were treated with (a) vehicle (-) and NAC (+) (n=80 cells, 4 experiments), or (b) mitoTempo (n=81 cells, 4 experiments). c,d, Effect of oxidative damage on VDIM formation. c, Cells were treated with oligomycinA (oligoA), mitoTempo, or oligoA+mitoTempo (n=82 cells for vehicle, 81 cells for mitoTempo, 79 cells for oligoA, 79 cells for mitoTempo+oligo, 4 experiments), or d, rotenone, mitoTempo or rotenone+mitoTempo (n=60 cells for vehicle, 60 cells for mitoTempo, 62 cells for rotenone, 60 cells for rotenone+mitoTempo, 3 experiments). Data shown are mean±SEM shown as large circles and individual data points from corresponding experiments shown in the same colors. Statistical significance was calculated using two-tailed Student’s unpaired t-test in (a, b), or One-way ANOVA followed by Tukey’s multiple-comparison test in (c, d). P values calculated are indicated.
Fig. 3
Fig. 3. VDIMs are delivered to lysosomes for degradation
a, Localization of VDIMs in LAMP1+ lysosomes. Right: 3D reconstruction. Arrowheads indicate the VDIMs. b, Number LAMP1positive VDIMs in experiments as in (a) (n= 36 cells, 3 experiments). c, Schematic illustrating the loss of GFP fluorescence from lysosome-localized VDIMs in cells expressing MCU-GFP-mCherry. d, VDIMs in cells expressing MCU-GFP-mCherry. Arrowheads indicate the VDIMs that retain the mCherry fluorescence, while GFP fluorescence is quenched. Rainbow pseudo-colored GFP channel also shown. Right: Pixel intensity plot for dashed line. Arrow indicates the vesicle. e, Number of mCherry+/GFP- VDIMs in experiments as in (d) (n= 330 vesicles, 26 cells, 3 experiments). f, CLEM analysis of cells expressing LAMP1-GFP (green) and mito-BFP (cyan), labeled with Mitotracker (magenta). Scale bars, 10μm. Bottom: Higher magnifications of single-z plane from indicated regions. (i-ii) Lysosome localized VDIMs and presence of membrane whorls. (iii) Lysosome devoid of mitotracker-labeled membrane (arrowheads). Scale bars, 200nm. g, Live-cell imaging sequence showing VDIM formation (arrowheads) in cells expressing mito-BFP (blue). Lysosomes were labeled with dextran (green) and mitochondria with mitotracker (magenta). h, Mean intensity of mitotracker and mito-BFP in the lysosome over time from (g). i, Top: Representative data from two experiments showing the percentage of VDIMs forming at mitochondrial midpoint or the periphery in experiments as in (g) (n= 52 events, 10 cells). Bottom: Schematic illustrating that VDIM formation does not occur at preferential sites along the length of the mitochondria. j,k, Number of VDIMs in cells with impaired lysosomes. Cells were treated with (j) bafilomycin A1 (BafA1) (n= 60 cells, 3 experiments) or (k) chloroquine (CQ) (n= 60 cells, 3 experiments). Data shown are mean±SEM shown as large circles and individual data points from corresponding experiments shown in the same colors. Statistical analysis was performed using two-tailed Student’s unpaired t-test. P values calculated are shown. Unless stated otherwise, scale bars: 3μm.
Fig. 4
Fig. 4. VDAC1 and lysosomal Ca2+ channel TRMPL1 mediate VDIM formation
a, Number of VDIMs in cells treated with VBIT-12 (n= 81 cells for vehicle, 83 for VBIT-12, 4 experiments). b, Number of VDIMs in cells treated with scrambled (NT) or VDAC1 siRNA (n= 36 cells, 4 experiments). c, Schematic illustrating the mitochondria-lysosome crosstalk mediated by VDAC1 and TRPML1. d, Number of VDIMs in cells treated with vehicle (-) or BAPTA-AM (n= 80 cells, 4 experiments). e,f, Effect of TRPML1 activity on VDIM formation. Cells were treated with (e) Apilimod (n= 60 cells, 3 experiments) or (f) ML-SA1 (n= 60 cells, 3 experiments). g-i, Effect of TRPML1 on VDIM formation. g, Number of VDIMs formed in TRPML1-/- (KO) and littermate WT MEFs (n= 55 cells, 3 experiments). h, VDIM formation in TRPML1 KO MEFs treated with vehicle (-) or BafA1 (n= 62 cells, 3 experiments). i, Rescue of VDIM formation in TRPML1 KO MEFs re-expressing TRPML-1. TRPML1 KO MEFs were transiently transfected with GFP or TRPML1-YFP. Cells were treated with vehicle (-) or BafA1 (+) to allow VDIMs to accumulate (n=59 for GFP+vehicle, 62 for GFP+BafA1, 60 for TRPML1-YFP+vehicle, 60 for TRPML1-YFP+BafA1, 3 experiments). Data shown are mean±SEM shown as large circles and individual data points from corresponding experiments shown in the same colors. Statistical analysis was performed using two-tailed Student’s unpaired t-test (a-b, d-h) and One-way ANOVA followed by Tukey’s multiple-comparison test (i). P values calculated are shown.
Fig 5
Fig 5. VDIMs form by engulfment of IMM by lysosomes in a microautophagy-like process
a-d, Number of VDIMs in (a) Atg5-/- (KO) (n= 101 WT, 98 KO cells, 5 experiments), (b) Atg12-/- (KO) (n= 40 WT, 46 KO cells, 3 experiments), (c) Atg14-/- (KO) (n= 61 WT, 91 KO cells, 4 experiments), and (d) Atg16-/- (KO) (n= 73 WT, 72 KO cells, 4 experiments) MEFs compared to MEFs from littermate WT controls. e, Localization of VDIMs and indicated autophagy markers. Mitochondria in cells expressing (i) mCherry-LC3 (grey) (n=264 vesicles, 29 cells, 3 experiments), (ii) p62-mCherry (grey) (n=285 vesicles, 30 cells, 3 experiments) or (iii) mRFP-Ub (grey) (n=264 vesicles, 30 cells, 3 experiments) labeled with mitotracker (magenta) and TOM20 (cyan) to identify the VDIMs (arrowheads). f, Percentage of VDIMs positive for indicated autophagy markers in experiments as in (e) (n=331 vesicles, 30 cells, 3 experiments for p62; n= 261 vesicles, 30 cells, 3 experiments for LC3; n= 394 vesicles, 31 cells, 3 experiments for Ubq). g,h, Lysosome membrane (g) LAMP1 or (h) TRPML1 vesicles inside the lumens of lysosomes that contain the VDIMs. Right: Pixel intensity plot for dashed line. Arrows indicate the VDIMs. i, Lack of Parkin localization with VDIMs (arrowheads) in cells expressing mCherry-Parkin (grey). j, Percentage of VDIMs positive for Parkin in experiments as in (i) (n=240 vesicles, 28 cells, 3 experiments). k, Number of VDIMs in cells overexpressing GFP or pEGFP-Parkin (n=80 cells, 4 experiments). l, Number of VDIMs in Parkin-/- (KO) MEFs compared to littermate WT control MEFs (n=57 cells, 3 experiments). Data shown are mean±SEM shown as large circles and individual data points from corresponding experiments shown in the same colors. Statistical analysis was performed using two-tailed Student’s unpaired t-test (a-d,k-l). P values calculated are shown. Scale bars: 3μm.
Fig 6
Fig 6. The ESCRT complex mediates VDIM formation
a, Tsg101-GFP, b, Chmp2a-GFP, or c, Chmp4b-RFP (grey) localization with VDIMs (arrowheads). Arrows indicate ESCRT puncta. Right: 3D-reconstruction. d, Schematic illustrating VDIM stages observed in fixed-cell imaging. e, Percentage of immature and mature VDIMs positive for indicated proteins in experiments as in (a-c) (n=31 cells for Tsg101, 30 cells for Chmp2a, 30 cells for Chmp4b, 3 experiments). f, Live-cell imaging sequence showing Tsg101 recruitment at sites of VDIM scission. Images were acquired every 5 sec. Arrowheads indicate the VDIMs and arrows indicate the Tsg101 puncta (n=25 events). g, ALG-2 (grey) positive VDIMs (arrowheads). Arrow indicates an ALG-2 negative VDIM. h, Percentage of VDIMs positive for ALG-2 from experiments as in (g) (n=408 vesicles, 29 cells, 3 experiments). i, Representative images showing impaired vesicle scission (arrowheads) after Tsg101 depletion. Right: 3D-reconstruction. j, Number of mitotracker+/Tom20- vesicles after Tsg101 depletion (n=71 cells, 3 experiments). k, Percentage of immature and mature VDIMs after Tsg101 depletion from (j). l, CLEM analysis of cell expressing LAMP1-GFP (green) and mito-BFP (cyan) after Tsg101 depletion. Mitotracker (magenta). Arrowhead indicates the IMM herniating into the lysosome. m, Size distribution of VDIMs from airyscan images (n=548 vesicles, 42 cells, 4 experiments). Right: Schematic illustrating the IMM encapsulated by a lysosome, forming a VDIM. n, Top: Schematic illustrating the proposed mechanism of VDIM formation. Bottom: EM micrographs of Tsg101 depleted cells from (l), illustrating the different stages of VDIM formation. All data shown are from at least three independent experiments with mean±SEM shown as large circles and individual data points from corresponding experiments shown in the same colors. Statistical significance was calculated using two-tailed Student’s unpaired t-test for (j) and One-way ANOVA followed by Tukey’s multiple-comparison test for (k). P values calculated are shown. Scale bars, 3μm (a-c, f-g,i), and 10μm for fluorescence and 200nm for EM image in (l).

Comment in

References

    1. Kondadi AK, Anand R, Reichert AS. Cristae Membrane Dynamics – A Paradigm Change. Trends Cell Biol. 2020;30:923–936. - PubMed
    1. Soubannier V, et al. A Vesicular Transport Pathway Shuttles Cargo from Mitochondria to Lysosomes. Current Biology. 2012;22:135–141. - PubMed
    1. Li X, et al. Mitochondria shed their outer membrane in response to infection-induced stress. Science (1979) 2022;375:eabi4343. - PubMed
    1. Jiao H, et al. Mitocytosis, a migrasome-mediated mitochondrial quality-control process. Cell. 2021;184:2896–2910.:e13. - PubMed
    1. Rep M. Mitochondria-lysosome-related organelles mediate mitochondrial clearance during cellular dedifferentiation. HHS Public Access. 2023;42:113291. doi: 10.1016/j.celrep.2023.113291. - DOI - PMC - PubMed

LinkOut - more resources