. 2024 Sep;633(8031):895-904.
doi: 10.1038/s41586-024-07840-z. Epub 2024 Aug 21.

Short-term post-fast refeeding enhances intestinal stemness via polyamines

Affiliations

Short-term post-fast refeeding enhances intestinal stemness via polyamines

Shinya Imada et al. Nature. 2024 Sep.

Abstract

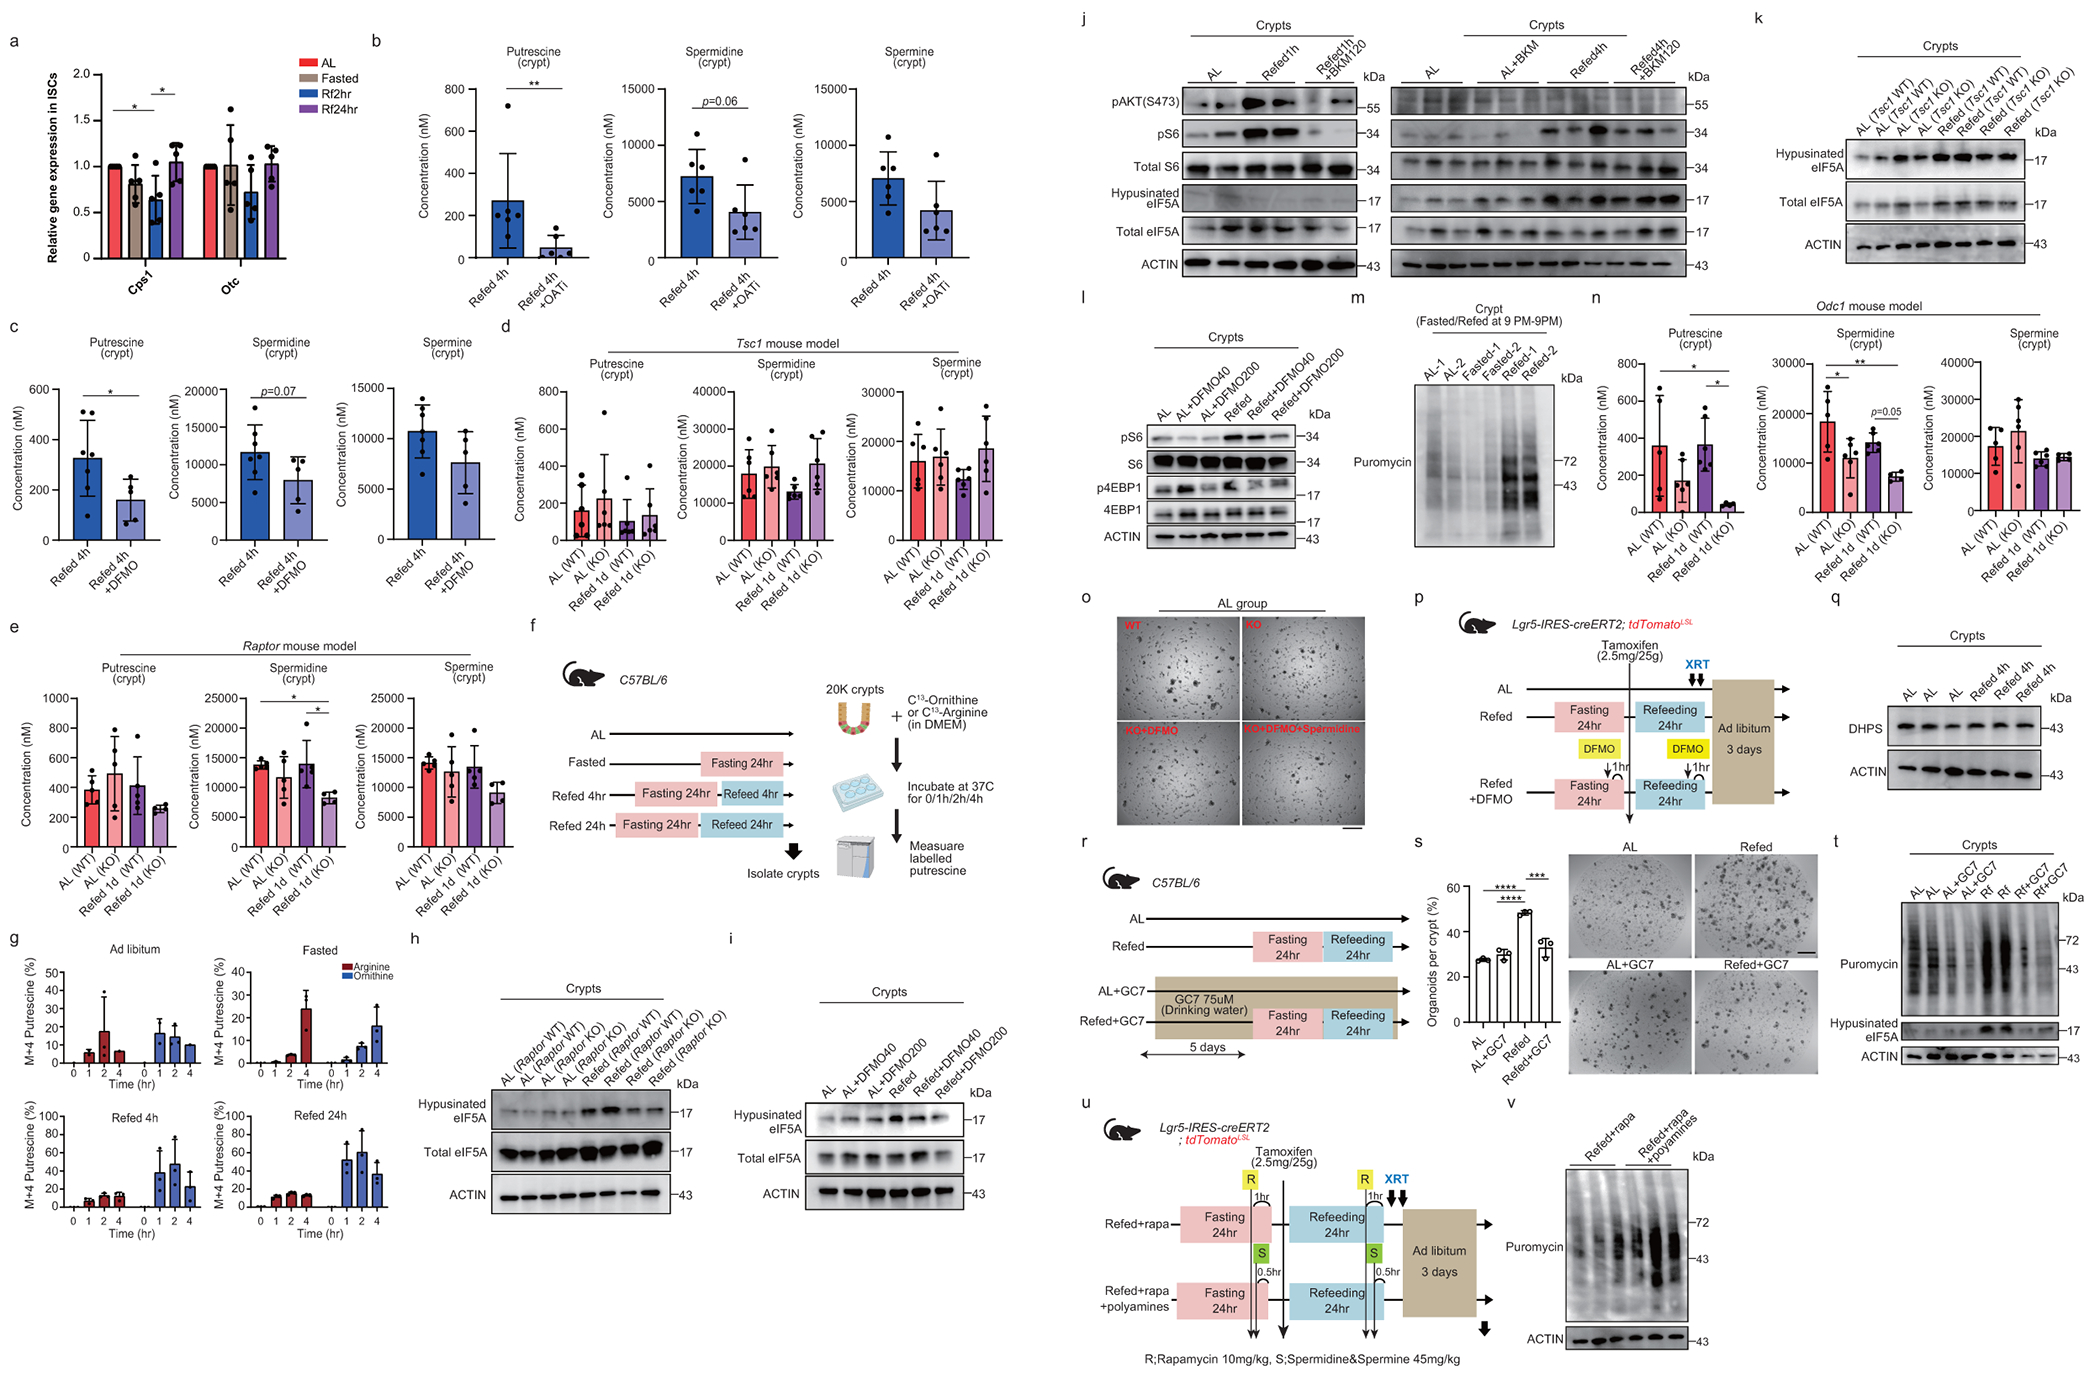
For over a century, fasting regimens have improved health, lifespan and tissue regeneration in diverse organisms, including humans1-6. However, how fasting and post-fast refeeding affect adult stem cells and tumour formation has yet to be explored in depth. Here we demonstrate that post-fast refeeding increases intestinal stem cell (ISC) proliferation and tumour formation; post-fast refeeding augments the regenerative capacity of Lgr5+ ISCs, and loss of the tumour suppressor gene Apc in post-fast-refed ISCs leads to a higher tumour incidence in the small intestine and colon than in the fasted or ad libitum-fed states, demonstrating that post-fast refeeding is a distinct state. Mechanistically, we discovered that robust mTORC1 induction in post-fast-refed ISCs increases protein synthesis via polyamine metabolism to drive these changes, as inhibition of mTORC1, polyamine metabolite production or protein synthesis abrogates the regenerative or tumorigenic effects of post-fast refeeding. Given our findings, fast-refeeding cycles must be carefully considered and tested when planning diet-based strategies for regeneration without increasing cancer risk, as post-fast refeeding leads to a burst in stem-cell-driven regeneration and tumorigenicity.


Conflict of interest statement

Declaration of interests

The authors declare no competing interests.

Figures

Extended Data Fig. 1
Extended Data Fig. 1. Refeeding does not alter the intestinal morphology, the number of ISCs, or differentiated cells
(a) Normalized mice weight ratio of AL (left) and fasted 24h- refed 24h (right). n = 10–12 mice group, pooled from 3 independent experiments. (b) Quantification (left) and representative images of phospho-H3+ cells by IHC per jejunal crypt (right). n = 5 mice per group. Scale bar, 25 µm (c) Length of crypt (left) and villi (right) in the jejunum. n = 4 mice per group. (d) Quantification (left) and representative images of IHC for OLFM4 per jejunal crypt (right). n = 3 mice per group. Scale bar, 25 µm. (e) Quantification (left) and representative images of in situ hybridization (ISH, red) for Lgr5 mRNA (right). n = 4 mice per group. Scale bar, 50 µm. (f) (g) Quantification (left) and representative images (right) of Cleaved caspase3+ cells in the villi (f) and crypt (g). n = 5 mice per group. Scale bar, 25 µm. (h) Quantification (left) and representative images (right) of Paneth cells by IHC for Lysozyme. n = 4 mice per group. Scale bar, 25 µm. (i) Quantification (left) and representative images (right) of jejunal Alician Blue staining. n = 5 mice per group. Scale bar, 50 µm. (j) Organoid-forming assay for intestinal crypts isolated from AL, Fasted, Refed 1d, and Refed 3d mice. Quantification (left) and representative images of day 3 organoids (right). n = 3 mice per group, pooled from 3 independent experiments. Scale bar, 200 µm. (k) Quantification (left) and representative images of IHC for tdTomato (orange arrows, right) in the colon. n = 20 crypts per measurement, n = 5 mice per group, pooled from 3 independent experiments. Scale bar, 25 µm. One-way ANOVA (a, b, c, d, e, f, g, h, i, j, k). Data are mean ±s.d, *p < 0.05, **p < 0.01, ****p < 0.0001, ns = not significant.
Extended Data Fig. 2
Extended Data Fig. 2. Circadian cycle does not have an impact on refeeding-mediated crypt proliferation and organoid-forming capacity
(a) Schematic of BrdU assay with different fasting time. (b) Quantification (left) and representative images of BrdU+ cells (4 hours after BrdU administration) by IHC per jejunal crypt (right). n = 25-30 crypts per measurement, n = 5 mice per group. (c) Quantification (left) and representative images of BrdU+ cells (4 hours after BrdU administration) by IHC per jejunal crypt (right). n = 25-30 crypts per measurement, n = 5 mice per group. Scale bar, 50 µm. (d) Organoid-forming assay for intestinal crypts isolated from AL, Fasted, Refed 1d mice. Quantification (left) and representative images of day 3 organoids (right). n = 3 mice per group, Scale bar, 500 µm. One-way ANOVA (b, c, d). Data are mean ± s.d. *p < 0.05, ***p < 0.001, ****p <0.0001.
Extended Data Fig. 3
Extended Data Fig. 3. Insulin-PI3K signal is a trigger to activate mTORC1 signal after refeeding
(a) Time course of blood glucose levels measured from tail-tip samples in AL (red) and refed (pre and post refeeding, blue) mice. n = 4 mice per group. (b) Immunoblots for phospho-AKT and mTORC1 downstream targets in crypts from AL, Refed 1h and Refed 1h treated with OSI-906 (left) or BKM120 mice (right). (c) Immunoblots for pS6 and total S6 in crypts from AL, Fasted, and Refed mice (started fasting and refeeding at 9PM). (d) Immunoblots for pS6 and total S6 in crypts from AL, Refed 1d with or without rapamycin treatment. (e) Quantification of BrdU+ cells per jejunal crypt from AL and Refed 1d with or without rapamycin treatment (left), and representative images of IHC for BrdU (right). n = 4-5 mice per group, pooled from 3 independent experiments. Scale bar, 25 µm. (f) Immunoblots for pS6 and total S6 in crypts from AL and Refed 1d Tsc1 WT or KO mice. (g) Immunoblots for pS6 and total S6 in crypts from AL and Refed 1d Raptor WT or KO mice. Two-way ANOVA (a). One-way ANOVA (e). Data are mean ±s.d. **p < 0.01, ***p < 0.001.
Extended Data Fig. 4
Extended Data Fig. 4. Refeeding stimulates proliferation and stemness in primitive ISC subsets
(a) Feature heatmaps for genes encoding enterocyte, secretory lineage, and stem cell markers. (b) GSEA for Biton-I, II, III gene signatures among ISC subsets (clusters 5, 2 and 10) from AL (al) mouse. NES, normalized enrichment score; FDR, false discovery rate. (c) Cell-cycle marker gene analysis for each ISC subset (5, 2,10) from all dietary condition. (d) Frequency of cells expressing S phase or G2/M phase cell-cycle marker genes in clusters 5, 2, 10, and non-ISC subsets in the different dietary conditions with or without rapamycin treatment (rf). (e) Violin plots for the mean expression of Biton-I, -II, and III gene signatures within each cluster across the different dietary conditions with or without rapamycin treatment (rf). (f) (g) Gkn3 (f) or Pdgfa (g) gene expression level in cluster 5 (left) and representative images of in situ hybridization (ISH, red) (right). n = 4-5 mice per group. Scale bar, 10 µm. (h) qPCR for Oat on FACS-sorted ISCs. n = 4-9 mice per group, pooled from 4 independent experiments. Duplicate measurements were taken from each mouse. (i) Immunoblots for OAT, pS6 and total S6 in crypts from AL Tsc1 WT or KO mice. (j) (k) Ornithine level in the crypts from AL or refed Tsc1 loxp/loxp;Villin-CreERT2 (j) or Raptor loxp/loxp;Villin-CreERT2 (k) mice. n = 5-6 mice per group, pooled from 4 independent experiments. (l) Ornithine level in the crypts from refed 4 h mice with or without OAT inhibitor (5-FMO) treatment. n = 6-7 mice per group. pooled from 3 independent experiments. One-way ANOVA (c, e, f, g, h, j). Fisher’s exact two-sided test (d). Unpaired two-tailed t-tests (k, l). Data are mean ±s.d. *p < 0.05, **p < 0.01, ***p < 0.001, ****p < 0.0001.
Extended Data Fig. 5
Extended Data Fig. 5. mTORC1 activity regulates the polyamine level and hypusinatin of eIF5A in crypts
(a) qPCR on FACS sorted ISCs from Lgr5-EGFP-IRES-creERT2 mice. n = 5 per group, pooled from 3 independent experiments. (b) (c) Polyamine level in the crypts from refed 4h mice treated with or without OAT inhibitor (5-FMO) (b) or ODC1 inhibitor (DFMO) (c). n = 5–7 mice per group, pooled from 3 independent experiments. (d) (e) Polyamine level in the crypts from AL or refed 24h Tsc1 loxp/loxp;Villin-CreERT2 (d) or Raptor loxp/loxp;Villin-CreERT2 (e) mice. n = 4–6 mice per group, pooled from 4 independent experiments. (f) Schematic of isotope tracing experiments. (g) The proportion of isotope-labeled putrescine in the crypt samples from mice under different dietary conditions at various incubation times (0/1h/2h/4h). n = 1-4 mice per group. (h) Immunoblots for hypusinated elF5A and total elF5A in crypts from AL or refed 24h Raptor WT or KO mice. (i) Immunoblots for hypusinated elF5A and total elF5A in crypts from AL or refed 24h mice with or without DFMO treatment. DFMO 40, 200: DFMO 40mg/kg, 200mg/kg. (j) Immunoblots for of phospho-AKT and mTORC1 downstream targets in crypts from 1h or 4h refed mice with or without BKM120 treatment. (k) Immunoblots for hypusinated elF5A and total elF5A in crypts from AL or refed 24h Tsc1 WT or KO mice. (l) Immunoblots for mTORC1 downstream targets in crypts from AL or refed 24h mice with or without DFMO treatment. DFMO 40, 200: DFMO 40mg/kg, 200mg/kg. (m) Immunoblots for puromycin in crypts from AL, fasted 24h or refed 24h mice (started fasting and refeeding at 9 PM). (n) Polyamine level in crypts from AL or refed 24h Odc1 WT or KO mice. n = 4-6 mice per group, pooled from 4 independent experiments. (o) Representative images of day 3 organoids of crypts from AL Odc1 WT or KO mice. DFMO (1.5 mM) or/and Spermidine (50 uM) were added to the culture medium for the treatment group Scale bar, 500 µm. (p) Schematic of the irradiation mouse model, including the timeline of ODC1 inhibitor (DFMO) administration. (q) Immunoblots for DHPS in crypts from AL or refed 4h mice. (r) Schematic of in vivo GC7 treatment in AL or Refed 24h mice. (s) Organoid assay for crypts from AL or refed 24h mice treated with or without GC7 treatment (75 µM). Quantification (left) and representative images of day 3 organoids (right). n = 3 mice per group, pooled from 3 independent experiments. Scale bar, 500 µm. (t) Immunoblots for puromycin and hypusinated elF5A in crypts from AL or refed 24h mice with or without GC7 treatment. (u) Schematic of the irradiation mouse model including the timeline of rapamycin and polyamine administration. (v) Immunoblots for puromycin in crypts from refed 24h+rapa C57BL/6 mice with or without polyamines administration. Unpaired, two-tailed, Mann-Whitney test (b, c), One-way ANOVA (a, d, e, n, s). Data are mean ±s.d. *p < 0.05, **p < 0.01, ***p < 0.001, ****p<0.0001.
Extended Data Fig. 6
Extended Data Fig. 6. Post-fast refeeding augments tumourigenicity
(a) Schematic of Cre recombinase activity in Lgr5-IRES-CreERT2; Rosa26LSL-tdTomato reporter mice. (b) Quantification of tdTomato+ crypts in jejunum (left) and ileum (right) samples. n = 2 mice per group, pooled from 2 independent experiments. (c) Representative images of tdTomato+ crypts in jejunum (left) and ileum (right) . Scale bar, 50 µm. (d) Schematic of tumour burden calculation, Scale bar, 50 µm. (e) Quantification of β-catenin+ Apc-null tumours in colon from Apcloxp/loxp; Lgr5-EGFP-IRES- creERT2 mice (left), and representative images of Apc-null tumour lesion by IHC for β-catenin (black dot circle, right). Scale bar, 50 µm. n = 9 mice per group, pooled from 3 independent experiments. (f) Ratio of β-catenin+ Apc-null tumour length to colon length in colon of Apcloxp/loxp; Villin-creERT2 mice (left), and representative images of Apc-null tumours by IHC for β-catenin (right). Tumours are surrounded by a yellow dotted line (right). n = 11-21 mice per group, pooled from 3 independent experiments. Scale bar, 50 µm. (g) Representative images of Apc- null tumour lesions by IHC for β-catenin from IF experiments. Tumours are surrounded by a black dotted line. Scale bar, 50 µm. One-way ANOVA (e, f). Data are mean ±s.d. *p < 0.05, ***p < 0.001, ns; not significant.
Extended Data Fig. 7
Extended Data Fig. 7. mTORC1-Polyamine-protein synthesis axis boosts tumourigenicity
(a) Schematic of Apc tumour model with Apcloxp/loxp;Villin-CreERT2 mice with or without rapamycin. (b) Schematic of Apcloxp/loxp; Lgr5-EGFP-IRES creERT2 tumor model with or without rapamycin. (c) Quantification of tumour burden in the small intestine (left) and representative tumour images by IHC for β-catenin (right) in Apcloxp/loxp;Villin-CreERT2. n = 5-8 mice per group, pooled from 3 independent experiments. Scale bar, 100 µm. (d) Quantification of tumour burden in small intestine (left) and colon (right) in Apcloxp/loxp; Lgr5-EGFP-IRES creERT2 mice. n = 8-22 mice per group, pooled from 3 independent experiments. (e) Representative tumour images by H&E (small intestine) or IHC for β-catenin (colon) from Apcloxp/loxp; Lgr5-EGFP-IRES creERT2 mice. Tumours are surrounded by white or black dotted lines. Scale bar, 100 µm. (f) Schematic of Apcloxp/loxp; Lgr5-EGFP-IRES-creERT2 tumour model with or without the Tsc1loxp/loxp allele (WT/KO). (g) Ratio of tumour length to intestinal length (left) and representative images of tumour lesions by H&E and IHC for pS6 (right). n = 5-6 mice per group, pooled from 3 independent experiments. Scale bar, 100 µm. (h) Schematic of Apc tumour model with Apcloxp/loxp;Villin-CreERT2 mice with or without DFMO. (i) Quantification of tumour burden in the small intestine (left) and representative tumour images by IHC for β-catenin (right) with or without DFMO. n = 4-7 mice per group, pooled from 3 independent experiments. Scale bar, 100 µm. (j) Quantification of tumour burden in colon treated with ODC inhibitor (DFMO) (left), and representative tumour images by IHC for β-catenin (right). Tumours are surrounded by yellow dotted lines. n = 5-7 mice per group, pooled from 3 independent experiments. Scale bar, 100 µm. (k) Schematic of Apc tumour model with Apcloxp/loxp;Villin-CreERT2 mice with or without protein synthesis inhibitor (cycloheximide). (l) Schematic of assessing the effect of cycloheximide on protein synthesis. (m) Immunoblots for puromycin in crypts labelled with puromycin. CHX 5, 15: CHX 5mg/kg, 15 mg/kg. (n) Quantification of tumour burden in the small intestine (left) and representative tumour images by IHC for β-catenin (right) with or without protein synthesis inhibitor (cycloheximide). n = 5-6 mice per group, pooled from 3 independent experiments. Scale bar, 100 µm. (o) Immunoblots for puromycin in isolated crypts from Refed 1d Apcloxp/loxp; Lgr5-EGFP-IRES-creERT2 or Apcloxp/loxp; Rpl24Bst/+; Lgr5-EGFP-IRES-creERT2 mice without tamoxifen administration. (p) Quantification of tumour burden in the small intestine of Apcloxp/loxp; Rpl24Bst/+; Lgr5-EGFP-IRES-creERT2 mouse model (left) and representative images of tumours by IHC for β-catenin. Tumours are surrounded by yellow dotted lines (right). n = 9-16 mice per group, pooled from 3 independent experiments. Scale bar, 100 µm. One-way ANOVA (c, d, i, j, n). Unpaired two-tailed t-tests (g, p). Data are mean ±s.d. *p < 0.05, **p < 0.01, ****p < 0.0001.
Extended Data Fig. 8
Extended Data Fig. 8. Chronic calorie restriction and acute 24h fast-refeeding regimen enhance ISC function through a distinct mechanism
(a) qPCR for Bst1 on FACS-sorted ISCs from AL, Fasted 24h, Refed 24h, and CR (fasted state) mice. n = 6-7 mice per group, pooled from 5 independent experiments. Duplicate measurements were taken from each mouse. (b) IHC for Lysozyme in the small intestine of Atoh1 WT and KO mice. Scale bar, 100 um (left) and 50 um (right). (c) Organoid assay for crypts from AL or refed 24h Atoh1 KO mice. Quantification (left) and representative images of day 3 organoids (right). n = 6 mice per group, pooled from 2 independent experiments. Scale bar, 500 µm. (d) Levels of polyamines in crypts from AL, CR (fasted or refed state), or rapamycin-treated mice. n = 7-8 mice per group, pooled from 4 independent experiments. (e) Organoid assay for crypts from AL, CR (fasted or refed state), or rapamycin-treated mice. Quantification (left) and representative images of day 3 organoids (right). n = 5-13 mice per group, pooled from 4 independent experiments. Scale bar, 500 µm. One-way ANOVA (a, d, e). Unpaired two-tailed t-tests (c). Data are mean ±s.d. *p < 0.05, **p < 0.01, ***p < 0.001,****p <0.0001.
Fig. 1
Fig. 1. Post-fast refeeding enhances ISC function
(a) Quantification (left) and representative images of BrdU+ cells (4 hours after BrdU administration) by IHC per jejunal crypt (right). n = 25-30 crypts per measurement, n = 5 mice per group, pooled from 4 independent experiments. Scale bar, 25 µm. (b) Organoid-forming assay for FACS-sorted ISCs from AL, Fasted, Refed 1d, and Refed 3d mice. Quantification (left) and representative images of day 3 organoids (right). n = 5 mice per group. Experiments were repeated 5 times. Scale bar, 50 µm. (c) Schematic of Lgr5 lineage tracing with Lgr5-IRES-CreERT2; Rosa26LSL-tdTomato reporter mice, including the timeline of tamoxifen injection and tissue collection. (d) Quantification (left) and representative images of IHC for tdTomato+ Lgr5+ ISC-derived progenies (orange arrows, right) in the small intestine. n = 20 crypts per measurement, n = 4-5 mice per group, pooled from 3 independent experiments. Scale bar, 25 µm. (e) Schematic of irradiation model with Lgr5 lineage tracing mice, including the timeline of irradiation (XRT 7.5Gy x 2) and tissue collection. (f) Quantification (left) and representative images of IHC for tdTomato+ Lgr5+ ISC-derived progenies (orange arrows, right). n = 20 crypts per measurement, and n = 5 mice per group, pooled from 3 independent experiments. Scale bar, 50 µm. One-way analysis of variance (ANOVA) (a,b,d,f). Data are mean ± s.d. *p < 0.05, **p < 0.01, ***p < 0.001, ****p <0.0001.
Fig. 2
Fig. 2. Refeeding activates mTORC1 signalling
(a) Immunoblots for phospho-AKT and mTORC1 downstream targets in crypts from AL, Refed 1h, Refed 24h mice. (b) Representative images of IHC for phospho-S6 in jejunal crypts from AL, Fasted, Refed 1d, and Refed 3d mice. n = 5 mice per group, pooled from 3 independent experiments. Scale bar, 20 µm. (c) Immunoblots for of pS6, and S6 in flow-sorted ISCs (Lgr5-GFPhi), progenitors (Lgr5-GFPlow) from each dietary conditioned Lgr5-IRES-creERT2 mice. (d) Schematic of lineage tracing mouse model with or without rapamycin treatment. (e) Quantification (left) and representative images of tdTomato+ Lgr5+ ISC-derived progenies labeled by IHC for tdTomato (blue arrows, right). n = 5 mice per group, pooled from 3 independent experiments. Scale bar, 50 µm. (f) Schematic of the irradiation model with Lgr5 lineage tracing mice, including the timeline of rapamycin administration. (g) Quantification (left) and representative images of IHC for tdTomato (orange arrows, right). n=20 crypts per measurement. n = 5-6 mice per group, pooled from 3 independent experiments. Scale bar, 50 µm (h) Organoid-forming assay for crypts from Tsc1 WT or KO mice at AL or refed 1d state. Quantification (left) and representative images of day 3 organoids (right). n = 6 mice per group, pooled from 4 independent experiments. Scale bar, 500 µm. (i) Organoid-forming assay for crypts from Raptor WT or KO mice at AL or refed 1d state. Quantification (left) and representative images of day 3 organoids (right). n = 4 mice per group, pooled from 4 independent experiments. Scale bar, 500 µm. Unpaired two-tailed t-tests (e, g). One-way ANOVA (h, i). Data are mean ± s.d.. *p < 0.05, **p < 0.01, ***p < 0.001, ****p <0.0001.
Fig. 3
Fig. 3. Refeeding boosts OAT expression in ISCs
(a) Schematic of single-cell RNAseq (scRNA-seq). GFP+ cells including ISCs (GFPhi) and progenitor cells (GFPlow) were flow-sorted from AL, Fasted, Refed 1d, and Refed 1d with rapamycin-treated Lgr5-EGFP-IRES creERT2 mice. (b) Cell type clusters. UMAP for clustering (color coding) of 18,061 single cells (Ad libitum, n=1 and 4,760 cells; Fasted, n=1 and 4,282 cells; Refed 1d n=1 and 4,552 cells; Refed 1d with rapamycin treatment n=1 and 4,467 cells). TA, transit-amplifying (progenitor) cells; EC, enterocyte; EEC, enteroendocrine cells. (c) Lgr5 relative expression level among all clusters within all dietary groups. (d) Gene signatures comparison of ISC subsets between our stem cell clusters (5, 2,10) and Biton’s ISC classification. Representative genes of Biton’s ISC subsets are shown on the right side. (e) Representative images of in situ hybridization (ISH, red) of OAT mRNA in the small intestinal crypts. Experiments were repeated 3 times. Scale bar, 10 µm. (f) Immunoblots for OAT in crypts from AL, Fasted, and different refeeding time points. (g) Schematic of ornithine metabolism including the metabolites and the genes encoding the catalytic enzymes. (h) Metabolite level in the intestinal tissues from AL, Fasted, Refed 4h, and Refed 24h mice. n = 4-5 mice per group, pooled from 3 independent experiments. Duplicate measurements were taken from each mouse. (i) Quantification (left) and representative images of tdTomato+ Lgr5+ ISC-derived progenies in AL or refed 1d mice treated with or without OAT inhibitor following irradiation (right). n = 4-7 mice per group, pooled from 3 independent experiments. Scale bar, 50 µm. One-way ANOVA (h, i). Data are mean ± s.d. *p < 0.05, **p < 0.01, ***p < 0.001, ****p <0.0001.
Fig. 4
Fig. 4. Refeeding augments protein synthesis
(a) Schematic of the polyamine pathway. (b) qPCR on FACS-sorted ISCs from AL, Fasted, Refed 2h and 24h mice. n = 6-12 mice per group, pooled from 5 independent experiments. (c) qPCR on FACS-sorted ISCs from Refed 2h mice with or without rapamycin. n = 6 mice per group, pooled from 5 independent experiments. (d) Polyamine level in crypts from AL, Fasted, Refed 4h and 24h mice. n = 5-7 mice per group, pooled from 3 independent experiments. (e) Immunoblots for hypusinated and total eIF5A in crypts from AL, Refed 4h and 24h mice. (f) Schematic of puromycin-incorporation assay. Created with BioRender.com. (g) Immunoblots for puromycin in crypts and FACS-sorted ISCs and progenitors from AL, Fasted, and Refed 1d. (h) Immunoblots for puromycin in crypts from AL and Refed with or without rapamycin. (i) Immunoblots for puromycin in crypts from AL and Refed with or without DFMO 40 or 200mg/kg. (j) Schematic of organoid assay using Odc1loxp/loxp;Villin-CreERT2 mice. (k) Organoid-forming assay of crypts from Odc1 WT or KO mice at AL or refed 1d. Quantification (left) and representative images of day 3 (right). n = 5 mice per group, pooled from 4 independent experiments. DFMO (1.5 mM) or/and Spermidine (50 µM). Scale bar, 500 µm. (l) Quantification and (m) representative images of tdTomato+ Lgr5+ ISC-derived progenies post-XRT (orange arrows) with or without DFMO. n = 4-5 mice per group, pooled from 3 independent experiments. Scale bar, 50 µm. (n) Quantification (left), representative images of tdTomato+ Lgr5+ ISC-derived progenies post-XRT with or without polyamine (right). n = 6 mice per group, pooled from 3 independent experiments. Scale bar, 50 µm. One-way ANOVA (b, k, l). Unpaired one-tailed t-tests (d). Unpaired two-tailed t-tests (c, n). Data are mean ±s.d. *p < 0.05, **p < 0.01, ***p < 0.001, ****p <0.0001.
Fig. 5
Fig. 5. Refeeding boosts tumourigenicity of ISCs
(a) Schematic of Apc tumour model with Apcloxp/loxp; Lgr5-EGFP-IRES-creERT2 mice. (b) Quantification of β-catenin+ nucleus Apc-null lesions 1 week after tamoxifen administration (left), and the ratio of tumour length to intestinal length in small intestine 3 weeks after tamoxifen administration (right). n = 7-13 mice per group, pooled from 3 independent experiments. (c) Representative images of Apc-null tumour lesions by IHC for β-catenin. Tumours are pointed by yellow arrows (left) or surrounded by a yellow dotted line (right). Scale bar, 100 µm (left) and 50 µm (right). (d) Schematic of ex vivo adenomatous organoid model with FACS-sorted Apc-null ISCs (Lgr5- GFPhi) from Apcloxp/loxp; Lgr5-EGFP-IRES-CreERT2 mice. (e) Quantification (top) and representative images of day 6 of Apc-null adenomatous organoids (bottom) from AL, Fasted, and Refed 1d mice. Scale bar, 1 mm. n = 5-7 mice with duplicate measurements taken from each mouse, pooled from 5 independent experiments. (f) Schematic of Apc tumour model with Apcloxp/loxp;Villin-CreERT2 mice. (g) Ratio of β-catenin+ Apc-null tumour length to intestinal length in small intestine (left), and representative images of Apc- null tumour lesions by IHC for β-catenin (right). Tumours are surrounded by a yellow dotted line. n = 5-13 mice per group, pooled from 3 independent experiments. Scale bar, 50 µm. (h) Schematic of intermittent fasting (IF) model with Apcloxp/loxp; Lgr5-EGFP-IRES-creERT2 mice. (i) Ratio of β-catenin+ Apc-null tumour length to intestinal length in small intestine. n = 5-8 mice per group, pooled from 3 independent experiments. (j) Schematic showing how post-fast refeeding alters Lgr5+ ISC activity, Created with BioRender.com. One-way ANOVA (b, e, g, i). Data are mean ±s.d. *p < 0.05, **p < 0.01, ***p < 0.001.

Update of

References

    1. Cheng CW & Yilmaz Ö H 100 Years of Exploiting Diet and Nutrition for Tissue Regeneration. Cell Stem Cell 28, 370–373 (2021). 10.1016/j.stem.2021.02.014 - DOI - PMC - PubMed
    1. Nencioni A, Caffa I, Cortellino S & Longo VD Fasting and cancer: molecular mechanisms and clinical application. Nat Rev Cancer 18, 707–719 (2018). 10.1038/s41568-018-0061-0 - DOI - PMC - PubMed
    1. Cheng CW et al. Prolonged fasting reduces IGF-1/PKA to promote hematopoietic-stem-cell-based regeneration and reverse immunosuppression. Cell Stem Cell 14, 810–823 (2014). 10.1016/j.stem.2014.04.014 - DOI - PMC - PubMed
    1. Longo VD & Mattson MP Fasting: molecular mechanisms and clinical applications. Cell Metab 19, 181–192 (2014). 10.1016/j.cmet.2013.12.008 - DOI - PMC - PubMed
    1. Weindruch R, Walford RL, Fligiel S & Guthrie D The retardation of aging in mice by dietary restriction: longevity, cancer, immunity and lifetime energy intake. J Nutr 116, 641–654 (1986). 10.1093/jn/116.4.641 - DOI - PubMed

Methods references

    1. el Marjou F et al. Tissue-specific and inducible Cre-mediated recombination in the gut epithelium. Genesis 39, 186–193 (2004). 10.1002/gene.20042 - DOI - PubMed
    1. Colnot S et al. Colorectal cancers in a new mouse model of familial adenomatous polyposis: influence of genetic and environmental modifiers. Lab Invest 84, 1619–1630 (2004). 10.1038/labinvest.3700180 - DOI - PubMed
    1. Sato T et al. Single Lgr5 stem cells build crypt-villus structures in vitro without a mesenchymal niche. Nature 459, 262–265 (2009). 10.1038/nature07935 - DOI - PubMed
    1. Ootani A et al. Sustained in vitro intestinal epithelial culture within a Wnt-dependent stem cell niche. Nat Med 15, 701–706 (2009). 10.1038/nm.1951 - DOI - PMC - PubMed
    1. Fuhrer T, Heer D, Begemann B & Zamboni N High-throughput, accurate mass metabolome profiling of cellular extracts by flow injection-time-of-flight mass spectrometry. Anal Chem 83, 7074–7080 (2011). 10.1021/ac201267k - DOI - PubMed

MeSH terms

Substances

LinkOut - more resources