. 2024 Sep;633(8030):718-724.
doi: 10.1038/s41586-024-07846-7. Epub 2024 Aug 21.

NAC guides a ribosomal multienzyme complex for nascent protein processing

Affiliations

NAC guides a ribosomal multienzyme complex for nascent protein processing

Alfred M Lentzsch et al. Nature. 2024 Sep.

Abstract

Approximately 40% of the mammalian proteome undergoes N-terminal methionine excision and acetylation, mediated sequentially by methionine aminopeptidase (MetAP) and N-acetyltransferase A (NatA), respectively1. Both modifications are strictly cotranslational and essential in higher eukaryotic organisms1. The interaction, activity and regulation of these enzymes on translating ribosomes are poorly understood. Here we perform biochemical, structural and in vivo studies to demonstrate that the nascent polypeptide-associated complex2,3 (NAC) orchestrates the action of these enzymes. NAC assembles a multienzyme complex with MetAP1 and NatA early during translation and pre-positions the active sites of both enzymes for timely sequential processing of the nascent protein. NAC further releases the inhibitory interactions from the NatA regulatory protein huntingtin yeast two-hybrid protein K4,5 (HYPK) to activate NatA on the ribosome, enforcing cotranslational N-terminal acetylation. Our results provide a mechanistic model for the cotranslational processing of proteins in eukaryotic cells.


Figures

Extended Data Figure 1.
Extended Data Figure 1.. FRET of NatA with RNC and with NAC on the ribosome.
(a-c) Scheme of the nascent chain constructs used in this work. Grey depicts the ribosome exit tunnel up to the PTC. The nascent chain for FRET between RNC and NatA (a) contains an N-terminal 3xFLAG tag, SUMO, and residues 1-53 of the RpL4 nascent chain with Met1 mutated to serine. An amber codon at residue 12 allows for fluorescence labeling using BODIPY-FL (BDP). After FLAG affinity purification, SUMO cleavage by Ulp1 generates a 53 amino acid (aa) long nascent chain with a defined N-terminus recognized by NatA. Nascent chains for enzymatic assays in RRL are shown in (b). Constructs to measure iMet excision (upper) contained varying lengths of RpL4 with a single initiator methionine, which was radioactively labeled with [35S] and detected via autoradiography. Constructs to measure Nt-acetylation (lower) contained residues 2-12 from SNAP25, which is specifically detected by the SMI antibody upon Nt-acetylation (SMI81 epitope), followed by varying lengths of the RpL4 nascent chain. The nascent chain for measurement of Nt-acetylation reconstituted with purified RNC and proteins is shown in (c) and contains an N-terminal 3xFLAG tag, SUMO, the SMI81 epitope, a GSGS linker, and residues 1-90 of the RpL4 nascent chain. After purification of RNC, SUMO cleavage by Ulp1 generates a defined N-terminus for acetylation. (d) Purified proteins (as indicated) were visualized on a 12.5% SDS-PAGE gel and Coomassie Blue staining. The dashed line indicates that the two lanes were from the same gel. Similar protein quality was observed from 2, 1, 3, and 2 independent preparations of NatA, Naa50, MetAP1, and HYPK, respectively. (e) Steady-state kinetics of human NatA expressed and purified from S. cerevisiae. Reactions contained the indicated concentrations of the H4 peptide substrate (SGRGKGGKGLGKGGAKRHR), 20 μM [14C]-acetyl-CoA, 80 μM [12C]-acetyl-CoA, and 10 nM NatA. The progress of the reaction was monitored in the linear range (<10% of product formation). The concentration dependence of initial rates was fit to the Michaelis-Menten equation to obtain the steady-state parameters. (f) The position of the N-terminal ybbR tag and the site of acceptor dye (TMR) label are shown on the human NatA structure (PDB: 6C9M) using a dotted line. Naa15 and Naa10 are colored in dark and light green, respectively. The figure was generated with Pymol v.2.5.5. (g) Fluorescence emission spectra of RNCBDP with the 53 aa long RpL4 nascent chain (green), NatATMR (purple), RNCBDP with NatATMR (red), and RNCBDP•NatATMR chased with excess unlabeled NatA (black). Where indicated, the reactions contained 1 nM RNCBDP, 100 nM NatATMR, and 1 μM unlabeled NatA. (h, i) Fluorescence emission spectra measuring FRET between NatABDP and NACTMR in the absence (h) or presence (i) of 5 nM unlabeled RNC with a 53 aa long RpL4 nascent chain. 5 nM NatABDP + 5 nM unlabeled NAC are shown in green, 5 nM NatABDP + 5 nM NACTMR in red, 5 nM NACTMR alone in purple, 5 nM NatABDP + 5 nM NACTMR + 250 nM unlabeled NAC in black, and buffer only in brown.
Extended Data Figure 2.
Extended Data Figure 2.. Ribosome binding of NatA in human cells depends on NAC.
(a) Ribosome association of NatA after knockdown of NACα in human HEK293T cells. Total and ribosomal pellet fractions were analyzed by immunoblotting. ns, nonsense siRNA control. Representative immunoblot is shown. Experiment was repeated three times. (b) Ribosome association of NatA after knockdown of NACα in human HEK293T cells using siRNAs targeting the endogenous NACα mRNA in the 3’UTR. NACα expression was restored in knockdown cells by transient expression FLAG-tagged NACα variants from plasmids containing a different 3’UTR. Two NACα variants carrying point mutations in the NACα UBA-Naa15 binding interface (mtNAC-UBA-1 and -2; see Extended Data Table 2) and a deletion mutant lacking the entire UBA domain (ΔUBA; see Extended Data Table 2) were analyzed. ns, nonsense siRNA control. Representative immunoblot is shown. Experiment was repeated three times. (c) Ribosome association of FLAG-tagged Naa15 variants in human HEK293T cells in the endogenous Naa15 knockdown background. A mutant variant carrying three point mutations in the hydrophobic NACα UBA binding interface (L73A/L77A/W83A) was compared with wildtype Naa15. Total and ribosomal pellet fractions were analyzed by immunoblotting. Representative immunoblot is shown. Experiment was repeated three times.
Extended Data Figure 3.
Extended Data Figure 3.. Local resolution estimates, orientation distribution and refinement statistics of cryo-EM maps.
Each row shows, from the left to right: an overview and slice-through of the cryo-EM map, both filtered and coloured according to estimated local resolution, a viewing direction distribution heatmap, and Fourier shell correlations (between unmasked or masked half maps – blue and purple curves, respectively; between the map and the model after the final round of refinement – orange curves). The local resolution estimation and filtering was done in CryoSPARC. Maps were coloured on the same scale from 2.5 to 10 Å. The viewing direction distribution for each map was taken from corresponding CryoSPARC refinement outputs. For locally refined maps, only areas within refinement masks were coloured. The FSC curves for maps and map vs. model were obtained from outputs of map refinements in CryoSPARC and real-space refinements of models in Phenix, respectively.
Extended Data Figure 4.
Extended Data Figure 4.. Cryo-EM structure and model of the RNCRpL4-NAC-NatA/E ternary complex.
(a) Front view of the cryo-EM map of RNCRpL4 bound with NAC and NatA/E. The map shows the NatA/E complex bound to the large ribosomal subunit next to the globular domain of NAC. The map was lowpass-filtered to the estimated local resolution. The black outline shows the same map lowpass-filtered to 8 Å resolution. (b) Detailed view of the ternary complex model depicted in (A) showing NatA/E and NAC on the 60S ribosomal subunit. The yellow dotted line represents the flexible linker between NACα helix H2 and the UBA domain. NatA/E contacts the ribosome through its Naa15 auxiliary subunit via patches of positively charged residues within the basic helix of Naa15 and N-terminal helices that bind to the backbone of ribosomal RNA. The NACα C-terminal tail forms a bipartite contact with Naa15 with its UBA domain and H2. (c-e) Details of cryo-EM maps of the ternary complex showing a segment of Naa15 in contact with the NACα UBA domain (c), the NACα-H2 density connecting to the globular domain of NAC (d), and the N-terminal ribosome anchor of NACβ (e). The locally refined map (c), the homogeneously refined map lowpass filtered to 6 Å resolution (d) and the homogeneously refined map (e) are displayed as semi-transparent surfaces. (f-h) ColabFold-predicted dimer model of the Naa15-NACα complex. The AlphaFold model is coloured by chain (f), with Naa15 in green and NACα in yellow, and by the pLDDT confidence score (g). (h) shows the predicted Aligned Error (PAE) plot for the predicted model, with Naa15 as chain A and NACα as chain B. The chain residues are marked along the x and y axis, and the heatmap indicates the estimated position error (in Å) for residue x when predicted and true structures are aligned on residue y. Low PAE for residue pairs from NACα UBA and Naa15 (marked on the plot with *) and NACα H2 and Naa15 (marked as **) indicate that the relative positions of corresponding domains are well-defined in the AlphaFold prediction.
Extended Data Figure 5.
Extended Data Figure 5.. Mammals and yeast employ distinct modes of NatA/E recruitment to ribosomes.
Side (a, b) and top (c, d) views of the mammalian ternary RNCRpL4-NAC-NatA/E complex (a, c) and those of the yeast RNC-NatA/E complex (b, d; PDB# 6HD5). The ribosomes are shown in surface representation, bound factors and selected expansion segments in cartoon. The NAC heterodimer is shown in yellow and orange, mammalian NatA/E in hues of green, rRNA expansion segments coordinating NatA/E in blue, and yeast NatA/E in hues of pink. While the N-terminal helical domain of Naa15 contacts the ribosome near the exit tunnel in both mammalian and yeast systems, all other structural elements that mediate NatA recruitment and positioning on the ribosome are distinct in the two organisms. Firstly, ribosome-bound NAC captures and helps position NatA/E in mammals, whereas in yeast, the rRNA extension Es27 is proposed to act as a protein recruitment hub for NatA in place of NAC. Secondly, the second catalytic subunit Naa50 mediates an additional contact with the rRNA extionsion Es7a on the yeast ribosome, whereas Naa50 is not involved in ribosome contact and hence does not contribute to the ribosome affinity of mammalian NatA/E as shown in Figure 1. Thirdly, the locations of the NatA/E complex at the ribosome exit site are distinct in the two organisms. Finally, the ribosome binding site of mammalian NAC heavily overlaps with that of yeast NatA/E, suggesting that yeast NAC antagonizes rather than facilitates the ribosome recruitment of NatA/E. These differences, together with the absence of the NatA regulator HYPK in S. cerevisiae, suggest that the ribosome recruitment mechanisms for protein biogenesis factors are distinct between yeast and higher eukaryotic organisms.
Extended Data Figure 6.
Extended Data Figure 6.. Equilibrium titrations to measure the binding of NatA to RNC•NAC with the indicated NAC or NatA variants.
(a-c) Titrations contained 1 nM RNCBDP, indicated concentrations of WT NatATMR or NatATMR variants (a, b), and 50 nM NAC WT or NAC variants (c). (d) Close-up view of the interaction between Naa15 TPR and the NACα UBA domain. Mutated residues are colored as in (b) and (c).
Extended Data Figure 7.
Extended Data Figure 7.. HYPK forms an ultra-stable complex with NatA.
(a) Fluorescence emission spectra of 5 nM NatABDP with (red) and without (green) 50 nM HYPKTMR. (b) Equilibrium titrations to measure the binding of NatABDP to HYPKTMR. Data are shown as mean ± SD, with n = 3 independent measurements. (c) FRET between NatA-HYPK was not changed by increasing concentrations of the 80S ribosome. (d) Kinetics of dissociation of NatA-HYPK. The line is a fit of the data to a single exponential function assuming FRET = 0 at the end of the reaction. (e) Summary of the dissociation rate constant of the NatA-HYPK complex, in the absence and presence of the additional Naa50 catalytic subunit or by increasing the concentration of the ribosome high-salt wash fraction (HSW). Individual data points for independent measurements are shown.
Extended Data Figure 8.
Extended Data Figure 8.. Structural modeling and cryoEM analysis of HYPK bound to NatA on the RNC-NAC complex.
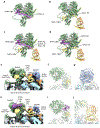
(a-d) HYPK H2 in inhibitory conformation would clash with bound H2 of NACα. In (a), the model of HYPK from NatA-HYPK complex (PDB 6C95) is superimposed on the model of NatA/E from the quaternary RNC-NAC-NatA/E-MetAP1 complex. Models were aligned by Naa15, only HYPK from the isolated NatA-HYPK complex is displayed. (b) shows the model of NAC-NatA/E from the quaternary RNC-NAC-NatA/E-MetAP1 complex. (c) shows the model of HYPK from NatA-HYPK complex (PDB 6C95) superimposed on the model of NAC-NatA/E from the quaternary RNC-NAC-NatA/E-MetAP1 complex. The binding site of HYPK H2 in its inhibitory conformation on Naa15 in part overlaps with that of H2 of NACα, when NatA/E is recruited to the ribosome. (d) shows a model of NatA/E-HYPK-NAC from the quaternary complex with HYPK. The N terminus of HYPK is remodelled upon recruitment to the ribosome by NAC. The flexible linker connecting NACα H2 and UBA and displaced HYPK N terminus are shown as yellow and purple dotted lines, respectively. (e-j) Comparison between cryo-EM maps of quaternary complexes with and without HYPK. e-g, details of the locally refined cryo-EM map of the quaternary complex showing the front view of the quaternary complex (e), a segment of Naa15 with NACα UBA (f), and MetAP1 (g). h-j, details of the locally refined cryo-EM map of the quaternary complex with HYPK showing the front view of the complex (h) and a segment of Naa15 with NACα UBA and HYPK UBA (i). A detail of a homogeneously refined map, lowpass filtered to 6 Å resolution, shows how NACα-H2 connects to the globular domain of NAC (j). The maps are displayed as solid surfaces (e, h) or as semi-transparent surfaces superimposed on models of the complexes (f-g, i-j). Colors are the same as in Fig. 1e, with MetAP1 in blue-grey and HYPK in purple.
Figure 1.
Figure 1.. The NACα UBA domain recruits NatA/E to the ribosome.
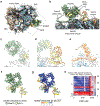
(a) Equilibrium titrations to measure RNC-NatA binding affinity. Titrations contained 1 nM RNCBDP, indicated concentrations of NatATMR, and 50 nM NAC or NACΔUBA, 500 nM Naa50 where indicated. (b) Summary of the Kd values of the RNC-NatA complex. Values represent mean ± S.D., with n = 4, 12, 3, and 3 independent measurements for ‘no NAC’, ‘WT NAC’, ‘+Naa50’, and ‘NACΔUBA’ samples. The black arrows indicate that the data reached fitting limit. (c) Ribosome association of NatA after knockdown of NACα in C. elegans. The FLAG-tagged NatA subunit Naa15 was detected by immunoblotting in the total and ribosomal pellet fractions. The empty vector (ev) served as a control. (d) N-acetylation of a NatA model substrate (SNAP25) after knockdown of NACα or Naa15 in C. elegans. The Nt-acetylated (Nt-Ac) substrate was detected by an epitope-specific antibody. In (c) and (d), representative immunoblots are shown. Experiments were repeated three times. (e) Overview of the cryo-EM map of RNCRpL4 in the quaternary complex with NAC, MetAP1 and NatA/E. The map was lowpass filtered to estimated local resolution; the black outline shows the same map lowpass filtered to 8 Å resolution. (f) Top view of the quaternary complex model showing how NAC positions nascent chain-processing enzymes around the opening of the ribosomal polypeptide exit tunnel (PET). (g) Schematic representation of the ternary and quaternary complexes on the 60S subunit (light blue) and the position of the nascent chain in the PET (dark grey) indicated as an asterisk. The following colors are used throughout: ribosomal RNA, light grey; 40S ribosomal proteins, beige; 60S ribosome proteins, light blue; P-site tRNA, red; NACα, yellow; NACβ, orange; MetAP1, slate blue; NatA/E, different hues of green.
Figure 2.
Figure 2.. NatA interacts with RNC via a combination of ribosome and NAC contacts.
(a) Overview of the quaternary complex highlighting key interactions between NatA/E, the ribosome, and NAC. The yellow dotted line depicts the flexible linker between NACα H2 and UBA. The outline shows the homogeneously refined cryo-EM map lowpass filtered to 8 Å resolution. (b) Schematic of the quaternary complex. Rectangles highlight key contacts shown in panels c-f. (c-f) Zoom-in views of key contacts in the ternary complex structure: The Naa15 basic helix docks onto ES7a of the 23S rRNA (c); the Naa15 N-terminal helical bundle contacts H19 and H24 of the 23S rRNA (d); the UBA (e) and H2 (f) of NACα contact N-terminal TPRs of Naa15. The outline shows the homogeneously (c, f, lowpass filtered to 5 Å resolution) or locally (d, e) refined cryo-EM maps. The residues that were biochemically tested are colored and numbered as in (g). (g) Summary of the Kd values for RNC-NatA binding with the indicated mutations (mt) in NACα or NatA. The details of the mutations are listed in Extended Data Table 2. Values are obtained from titrations in Extended Data Fig. 6. Individual data points are shown, and values represent mean ± S.D., n = 3 independent measurements. The data without NAC and with WT NAC are from Figure 1 and shown for comparison. (h) Nt-acetylation of a NatA model substrate (SNAP25) in C. elegans expressing the indicated FLAG-tagged NACα (left) or Naa15 (right) variants in the endogenous NACα or Naa15 RNAi background. N-acetylated (Nt-Ac) substrate was detected by an epitope-specific antibody. (i) Viability of the same worms used in (h). Graph shows the number of progeny in each mutant strain relative to wildtype worms (set to 100%). Data are shown as mean ± S.D., with n = 3 biological replicates.
Figure 3.
Figure 3.. MetAP1 and NatA co-bind on the RNC and sequentially modify the nascent chain.
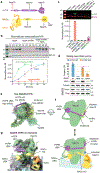
(a) Back view of the quaternary complex model in surface representation. The clipping plane goes through the PET and the active sites of MetAP1 and Naa10, the catalytic subunit of NatA. Pink and blue circles mark the positions of MetAP1 and NatA active sites, respectively, arrows indicate the distance between these active sites and the opening of PET. (b) In the corresponding cartoon representation of the quaternary complex, the solid pink arrow indicates the path of the nascent chain N-termini that first has its iMet excised by MetAP1 and then is acetylated by NatA. The dashed pink arrow shows the hypothetical path of nascent chain N-termini that are not cleaved by MetAP1 and have their iMet acetylated by Naa50 (NatE) instead. (c, d) Measurements of the timing of iMet excision (c) and Nt-acetylation (d) in RRL using stalled RNCs with the indicated nascent chain lengths. iMet cleavage was visualized by SDS-PAGE and autoradiography. Nt-acetylation was detected by WB using the SMI81 antibody. RpL10 serves as the loading control. RNCs with Trp or Pro as 2nd residue (A2W or A2P), which are not processed by either enzyme, served as negative controls. (e) Scheme of the coupled iMet excision and Nt-acetylation reaction shown in (g). See methods for details of reaction conditions. (f) Domain diagrams of the NAC variants used in (g). Arrows denote motifs involved in enzyme recruitment. (g) Representative Western blot (upper) and quantified time courses (lower) of the coupled iMet excision and Nt-acetylation reactions mediated by MetAP1, NatA, and the indicated NAC variants. The data in (c, d, g) are shown as mean ± S.D. from 4 independent measurements.
Figure 4.
Figure 4.. NAC activates NatA-HYPK on the ribosome.
(a) Scheme depicting the domain organization of HYPK and NAC, with arrows depicting the interaction partners for individual domains. (b) Reconstituted Nt-acetylation reactions on RNC. Upper, representative Western blot of reaction time courses. Lower, quantification of the data from 3 independent measurements, shown as mean ± S.D. (c) Reconstituted Nt-acetylation reactions on RNC with NatA-HYPK and the indicated NAC variants. Reactions were quenched at 60 seconds. Upper, representative Western blot. Lower, quantification of the data from 3 independent measurements. Individual data points are shown, and values represent mean ± S.D. (d) Upper panel: Viability of NACα RNAi worms in the HYPK WT and knockout (KO) background. The graph shows the number of progeny relative to empty vector (ev) RNAi wildtype worms (set to 100%). Data are shown as means ± S.D., with n = 3 biological replicates. Lower panel: Immunoblots showing NACα knockdown efficiency in each strain and Nt-acetylation of a NatA model substrate (SNAP25). The N-acetylated (Nt-Ac) substrate was detected by an epitope-specific antibody. (e) Model of HYPK (purple) bound to free NatA/E (green). HYPK was modelled onto the quaternary complex by superposition of free NatA-HYPK (PDB 6C95). (f) Cartoon of free NatA-HYPK (upper) and NatA-HYPK recruited by NAC at the ribosome (lower) summarizing the mechanism of HYPK derepression by NAC, as described in the text. The blue circle indicates the unblocked active site of Naa10. (g) cryo-EM structure of NatA/E-HYPK recruited by NAC at the ribosome. The cryo-EM map of the quaternary complex is shown as a solid surface; additional density present only in the map of the quaternary complex with HYPK is shown as a semi-transparent purple difference volume superimposed on the model of the rearranged HYPK.
Figure 5.
Figure 5.. Model for ribosome recruitment and activation of NatA and MetAP1 for cotranslational processing of the nascent chain.
Step 1, NAC captures NatA/E using the UBA domain of NACα and MetAP1 using the C-terminus of NACβ. Step 2, the interaction of NACα H2 with Naa15 positions NatA/E near the exit tunnel and removes the inhibitory contacts from HYPK. The front (upper) and back (lower) views are shown to depict the protein interactions and positions of the enzyme active sites relative to the exit tunnel. Step 3, MetAP1-mediated iMet excision. Step 4, NatA-mediated Nt-acetylation of the nascent chain.

References

    1. Aksnes H, Drazic A, Marie M & Arnesen T First Things First: Vital Protein Marks by N-Terminal Acetyltransferases. Trends Biochem Sci 41, 746–760 (2016). - PubMed
    1. Wiedmann B, Sakai H, Davis TA & Wiedmann M A protein complex required for signal-sequence-specific sorting and translocation. Nature 370, 434–440 (1994). - PubMed
    1. Gamerdinger M et al. Early Scanning of Nascent Polypeptides inside the Ribosomal Tunnel by NAC. Mol Cell 75, 996–1006.e8 (2019). - PubMed
    1. Arnesen T et al. The chaperone-like protein HYPK acts together with NatA in cotranslational N-terminal acetylation and prevention of Huntingtin aggregation. Mol Cell Biol 30, 1898–1909 (2010). - PMC - PubMed
    1. Gottlieb L & Marmorstein R Structure of Human NatA and Its Regulation by the Huntingtin Interacting Protein HYPK. Structure 26, 925–935.e8 (2018). - PMC - PubMed

ADDITIONAL REFERENCES.

    1. Liszczak G et al. Molecular basis for N-terminal acetylation by the heterodimeric NatA complex. Nat Struct Mol Biol 20, 1098–1105 (2013). - PMC - PubMed
    1. Yin J, Lin AJ, Golan DE & Walsh CT Site-specific protein labeling by Sfp phosphopantetheinyl transferase. Nat Protoc 1, 280–285 (2006). - PubMed
    1. Sharma A, Mariappan M, Appathurai S & Hegde RS In Vitro Dissection of Protein Translocation into the Mammalian Endoplasmic Reticulum. in Protein Secretion (ed. Economou A) vol. 619 339–363 (Humana Press, Totowa, NJ, 2010). - PMC - PubMed
    1. Yin J et al. Genetically encoded short peptide tag for versatile protein labeling by Sfp phosphopantetheinyl transferase. Proc. Natl. Acad. Sci. U.S.A 102, 15815–15820 (2005). - PMC - PubMed
    1. Walker KW & Bradshaw RA Yeast methionine aminopeptidase I. Alteration of substrate specificity by site-directed mutagenesis. J Biol Chem 274, 13403–13409 (1999). - PubMed

MeSH terms

LinkOut - more resources