. 2024 Sep;633(8030):615-623.
doi: 10.1038/s41586-024-07848-5. Epub 2024 Aug 21.

Thermal infrared directs host-seeking behaviour in Aedes aegypti mosquitoes

Affiliations

Thermal infrared directs host-seeking behaviour in Aedes aegypti mosquitoes

Avinash Chandel et al. Nature. 2024 Sep.

Abstract

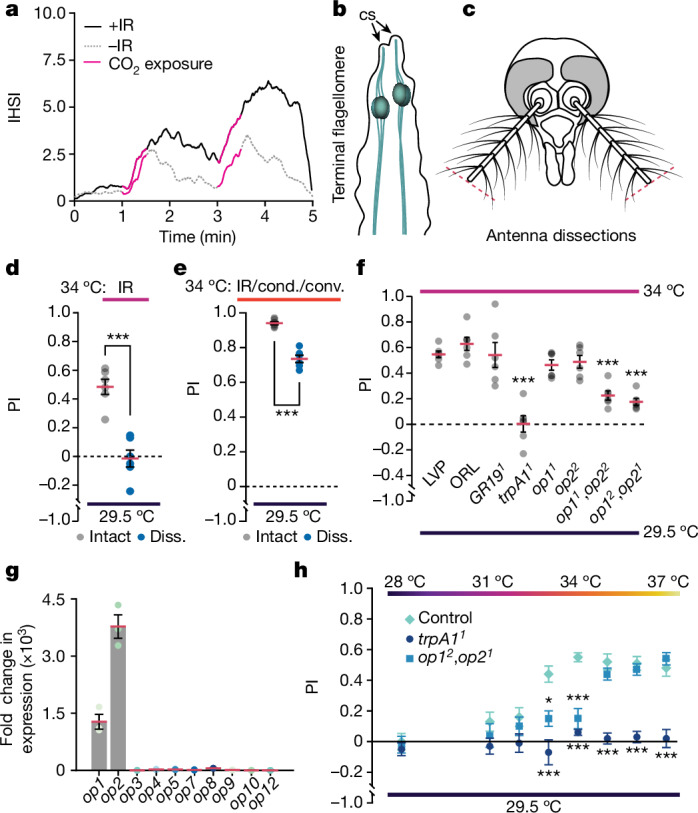
Mosquito-borne diseases affect hundreds of millions of people annually and disproportionately impact the developing world1,2. One mosquito species, Aedes aegypti, is a primary vector of viruses that cause dengue, yellow fever and Zika. The attraction of Ae. aegypti female mosquitos to humans requires integrating multiple cues, including CO2 from breath, organic odours from skin and visual cues, all sensed at mid and long ranges, and other cues sensed at very close range3-6. Here we identify a cue that Ae. aegypti use as part of their sensory arsenal to find humans. We demonstrate that Ae. aegypti sense the infrared (IR) radiation emanating from their targets and use this information in combination with other cues for highly effective mid-range navigation. Detection of thermal IR requires the heat-activated channel TRPA1, which is expressed in neurons at the tip of the antenna. Two opsins are co-expressed with TRPA1 in these neurons and promote the detection of lower IR intensities. We propose that radiant energy causes local heating at the end of the antenna, thereby activating temperature-sensitive receptors in thermosensory neurons. The realization that thermal IR radiation is an outstanding mid-range directional cue expands our understanding as to how mosquitoes are exquisitely effective in locating hosts.


Conflict of interest statement

The authors declare no competing interests.

Figures

Fig. 1
Fig. 1. Set-up for testing IR radiation as a potential host-associated cue.
a, Known host-associated sensory cues. b, Modes of thermal energy transfer: convection, conduction and IR radiation. The peak emission wavelength (λM) of emitting bodies at 34 °C is around 9.4 µm. c, The host-associated cues presented during the assay: human odour, 5% (v/v) CO2 and heat in the form of IR radiation. Assay cages were 4 cm from the arena wall that housed the Peltier device to mitigate the effect of convective cues. Human odour was applied uniformly on the outside of the mesh of the assay cage from a used nitrile glove. CO2 was delivered through perforated tubing, which formed a perimeter around both the control and IR zones. d, The Peltier device housing. An IR-transparent polyethylene (PE) film blocked convective cues from reaching the mosquitoes. e, Schematic of the behavioural assay. Mosquitoes were presented with IR and their host-seeking behaviour was video recorded for 5 min. f, Representative video frame taken from an experiment in which females were exposed to human odour and 5% CO2. One zone was exposed to 34 °C radiant heat from a Peltier device. The Peltier device behind the other zone was off, and equilibrated to the ambient temperature (temp.) (29.5 °C). The position of each host-seeking mosquito was recorded during the experimental window. In all of the experiments in which CO2 was provided, it was applied using the indicated time series (in seconds) unless otherwise stated. g, The PI, calculated from the indicated formula, using the total number of host-seeking observations in each zone during the 5 min experiment. PI < 0 indicates preference for zone 1; PI > 0 indicates preference for zone 2.
Fig. 2
Fig. 2. Integrating IR with other cues to direct host-seeking behaviour.
a, The effects of host-associated cues on host-seeking: 5% CO2, human odour and a 34 °C IR source. The HSI represents the average number of female mosquitos host seeking during 5 min experiment. bd,fh, Experiments in which both zones were exposed to CO2 and human odour, and one zone was exposed to IR at the indicated temperatures. Ambient temperature, 29.5 °C. b, The host-seeking frequency during an assay. c, There was no preference when both sides were at 29.5 °C. There was a strong preference for the 34 °C IR zone over the 29.5 °C zone. Obstructing IR from one of the two 34 °C IR sources produced a preference for the unobstructed source. Blocking IR from the 34 °C zone abolished the preference over the 29.5 °C zone. d, Removing the convective (conv.) barrier (−) did not increase the preference for the 34 °C zone. e, Female An. stephensi were exposed to two zones with human odour and 5% CO2. The zones were at 27 °C ambient temperature or exposed to 34 °C IR. f, IR thermographs under different ambient temperatures (left zone). The right zone was held at 34 °C. g, Assays performed under different ambient temperatures. Linear regression between the PI and temperature differences between the two zones. h, Assays were performed using different IR source temperatures (28–40 °C) in a 29.5 °C environment. i, The set-up for determining the distances at which Ae. aegypti detect 34 °C IR. Each side of the cage was exposed to human odour and CO2. IR was blocked on one side with an acrylic panel. Distances of 30–90 cm were used. j, The distances at which Aedes detect IR. Mosquitoes exposed to CO2, human odour and 34 °C IR in one zone, and 29.5 °C in the other zone. Data are mean ± s.e.m. Statistical analysis was performed using one-way analysis of variance (ANOVA) with Tukey’s multiple-comparison test (a, c, h and j) and parametric two-tailed Student’s t-tests (d,e); NS, not significant; ***P < 0.001. For ae, g, h and j, n = 6 biological replicates for each group. Exact P values are provided as source data. Source Data
Fig. 3
Fig. 3. Molecular components of IR sensation.
a,df,h, Females in both zones were exposed to 5% CO2 and human odour. Zone 1 was at ambient temperature (29.5 °C). Zone 2 was exposed to an IR source at 34 °C (a,d,f), all three forms of heat transfer at 34 °C (e) or an IR source only at the indicated temperature (h). a, The effect of CO2 on navigation towards IR on the basis of the IHSI. The average IHSI in the +IR and −IR zones represents the overall trend in host seeking at a specific time during CO2 exposure. b, Terminal flagellomere in an Aedes antenna. cs, coeloconic sensilla. Purported thermosensory neurons are shown in teal. c, The location of the dissection where the ends of the antennae were removed. d, IR-preference assays performed with dissected (diss.) and non-dissected (intact) wild-type (LVP) female mosquitos exposed to the presence or absence of IR. e, IR-preference assays performed with dissected and non-dissected LVP female mosquitos in the presence or absence of all three forms of heat transfer: IR, conductive (cond.) and convective (conv.) heat. f, Screen of mutant lines for impact on IR preference. LVP and Orlando (ORL) are the wild-type controls. g, qPCR analysis of all 10 Aedes opsin genes using RNA from female antennae. n = 3 biological replicates. Fold change in expression was calculated by normalizing to the lowest-abundance opsin, op12. h, The effects of the trpA11 and op12,op21 mutations on IR preference across a range of Peltier temperatures. Data are mean ± s.e.m. Statistical analysis was performed using one-way ANOVA with Tukey’s multiple-comparison test (f and h) and parametric two-tailed Student’s t-tests (d and e); *P < 0.05. For a, df and h, n = 6 biological replicates for each group. Exact P values are provided as source data. Source Data
Fig. 4
Fig. 4. Expression of genes involved in IR sensation.
In situ hybridization analysis of trpA1, op1, op2 and orco mRNAs at the female antennal tip (13th flagellomere). a, Probing for trpA1 mRNA in the wild-type control and the trpA11 mutant. b, Probing for op1 mRNA in the wild-type control and the op12 mutant. c, Probing for op2 mRNA in the wild-type control and the op21 mutant. For ac, n ≥ 5. dg, Double in situ hybridizations in wild-type antennae. Co-localizations of the signals are shown in white in the merged subpanels. d, In situ hybridization analysis of trpA1 (green) and op1 (magenta). e, In situ hybridization analysis of trpA1 (green) and op2 (magenta). f, In situ hybridization analysis of op1 (green) and op2 (magenta). g, In situ hybridization analysis of trpA1 (green) and orco (magenta). For dg, n = 3. Scale bars, 20 μm (full views) and 5 μm (insets).
Fig. 5
Fig. 5. EAG analysis to address whether heat activation is impaired in the trpA1 and opsin mutants.
a, IR thermograph of the thermal output of the 4 cm × 4 cm × 1 cm IR source used in the experiments. Right, the 4 cm × 4 cm × 1 cm block was held at around 34 °C. Left, the same block at ambient temperature (around 21 °C). The images were acquired using the FLIR One IR smartphone camera. b, The temperature at the site of the antennal preparation before exposure to the 34 °C block and during exposure to the 34 °C IR stimulus (grey shading). The temperature was measured by placing the tip of the probe (TSP01-USB Temperature and Humidity Data Logger; Thor Labs) at the same site as the antennal preparation used for the EAG experiments. c, Representative EAG traces from wild-type (control), trpA11 and op12,op21 female mosquitos that were presented with the IR source (grey shading). d, EAG amplitudes exhibited by wild-type (control), trpA11 and op12,op21 mosquitos in response to a 34 °C IR source. n = 12 (wild-type control and trpA11) and n = 11 (op12,op21). Each datapoint represents EAG responses from individual mosquitoes. Data are mean ± s.e.m. Statistical analysis was performed using one-way aligned-rank ANOVA with pairwise contrasts (d); **P < 0.01. Exact P values are provided as source data. Source Data
Extended Data Fig. 1
Extended Data Fig. 1. IR-based behavioural assay setup.
a, Design and construction of IR assay arena. b, Diagram of Peltier plates and recording camera position in the IR assay arena (image shown with one side wall removed for clarity). c, Schematic of assay cage used in IR behaviour experiments. The clear acrylic panel is shown in grey. d, Perforated tubing surrounding the two Peltier plates. e, Concentrations of CO2 recorded from a CO2 sensor placed inside an assay cage and exposed to the 5-minute CO2 paradigm used in the study. There were no differences in CO2 concentration in the left and right zones. Means ± SEMs (n = 3 independent measurements). f, Infrared thermograph of the thermal output of each zone of the IR source used in the distance setup. The right zone was held at ~34 °C, while the left zone was allowed to equilibrate with the ambient incubator conditions. Image acquisition and temperature estimation were made using a FLIR One infrared smartphone camera. Source Data
Extended Data Fig. 2
Extended Data Fig. 2. Temperatures of the behavioural setup and of a human hand and arm, and a heatmap of model outcomes under various host-seeking activities.
a, Air temperature recordings taken from a distance of 4 cm from the arena wall that housed the two Peltier plates used in the behavioural assay. A thin polyethylene film was placed 0.5 cm in front of the Peltier plates. The circles indicate the mean recorded air temperatures over a 5-minute recording period. The dashed lines indicate the maximum and minimum recorded temperatures during a 5-minute window. b, Same analysis as in panel ‘a’ without the polyethylene film. c, Comparison showing the sensitivity of the manual (Man.) versus the automated scoring method (Auto.) for the same experiments, n = 6 biological replicates. d, The input number of fictive mosquitoes used in the simulation ranged from 1 to 30. At each input number, the model was iterated 10,000 times. Simulation data were then analysed for the PI and the HSI. The interpretation of these data helped shape the minimum HSI used in this study (HSI = 5, red line). e, Temperature recordings over a 5-minute period at the cage mesh (red) and at the second polyethylene film (turquoise), which is placed 2 cm from the cage mesh. f, IR-preference assay performed with the first and second polyethylene films (2 cm and 4 cm from the cage mesh) and with just the first polyethylene film (4 cm from the cage mesh). Means ± SEMs (n = 6 biological replicates) Two-tailed Student’s t-test, n.s., not significant. g, IR thermography of a human hand and arm demonstrating non-homogenous skin temperatures. Exact P-values provided in Source Data. Source Data
Extended Data Fig. 3
Extended Data Fig. 3. Effects on behaviour of dosedependent block of IR preference, and effects of temperature and distance on IR intensity.
a, IR thermograph of the IR source used in the IR block setup. The IR zone was held at 34 °C and covered using different thickness of IR blocking windows. Acquisition of the images was made using a FLIR One infrared smartphone camera and the background was normalized using FLIR ignite software. b, IR preference assay performed using different thickness of IR blocking Si wafers covering the 34 °C IR source. Means ± SEMs (n = 6 biological replicates). One-way ANOVA with Tukey’s HSD test. *P < 0.05 and ***P < 0.001. c, IR intensity measurements with a pyroelectric sensor when the temperature of the IR source varies between 28°– 37 °C. d, IR intensity measurements using a pyroelectric sensor when the distance of the IR source at 34 °C is 8 cm to 30 cm from the sensor. Exact P-values provided in Source Data. Source Data
Extended Data Fig. 4
Extended Data Fig. 4. IR is an effective cue in single choice assays.
Host-seeking response of the mosquitoes exposed to a single 34 °C IR source, 5% CO2 and human odour. Host-seeking index: average number of female mosquitoes host seeking throughout the five-minute experiment. Means ± SEMs (n = 6 biological replicates). One-way ANOVA with Tukey’s HSD test. **P < 0.01 and ***P < 0.001. Exact P-values provided in Source Data. Source Data
Extended Data Fig. 5
Extended Data Fig. 5. A correlation study of behaviours associated with shifting preference indexes.
The data for these correlations were generated from 982 independent behavioural experiments (circles). Linear regression analyses were performed (black lines) and the fit of the models are indicated (R2). The average track time (ATT) for each zone is the cumulative host-seeking time spent in each zone divided by the overall number of tracks (bouts) observed in that zone. The average track distance (ATD) is the normalized average track distance difference between zones 1 and 2. The host-seeking index (HSI) is the average number of mosquitoes actively host seeking throughout the five-minute experimental window. The difference in total tracks (DTT) is the normalized difference in total number of tracks, ranging from −1 to 1. a, The correlation in ATT (where ATT = [ATTzone2 – ATTzone1]/[ATTzone2 + ATTzone1]) and recorded PI, R2 = 0.05 indicates no strong correlation between the preference index (PI) and the average time that the mosquitoes occupied that zone. The dashed lines cross the origin (0,0). b, The correlation in ATD (where ATD = [ATDzone2 – ATDzone1]/[ATDzone2 + ATDzone1]), and recorded PI, R2 = 0.15 indicates no strong correlation between the PI and the average distance that the mosquitoes occupied that zone. The dashed lines cross the origin (0,0). c, The correlation between the HSI, and recorded PI. R2 = 0; the vertical dashed lines indicate the HSI threshold value (HSI = 5); and the horizontal dashed lines indicate PI = 0. d, The correlation between the DTT (where DTT = [TTzone2 – TTzone1]/[TTzone2 + TTzone1] and recorded PI, R2 = 0.92 indicates a strong correlation between the preference index and the total number of tracks in each zone. This suggests that negative or positive PIs cannot be accounted for by behaviours exhibited after landing (ATT or ATD) or the overall host-seeking activity (HSI). Rather, the PI strongly correlated with the total tracks (DTT) recorded in each zone. Source Data
Extended Data Fig. 6
Extended Data Fig. 6. Effects of exposure of mosquitoes to all three modes of heat transfer.
a, Setup to test the impact of all three modes of heat transfer on the selection of 34 °C versus ambient temperature (29.5 °C) in the presence of elevated CO2 and human odour. b, Testing effects of the indicated mutations on selecting the ambient temperature (29.5 °C), versus 34 °C under conditions in which the female mosquitoes are exposed to conductive, convective and radiant heat. Both zones were exposed to elevated CO2 and human odour. Means ± SEMs (n = 6 biological replicates). One-way ANOVA with Tukey’s multiple comparisons test. c, Preference assay of dissected (Diss.) versus non-dissected (Control) wild-type mosquitoes when exposed to all three forms of heat from a 50 °C source. Means ± SEMs (n = 6 biological replicates), two-tailed Student’s unpaired t-test. d, Dwell time of wild-type female mosquitoes exposed to IR versus IR with conductive and convective heat. Both zones were exposed to elevated CO2 and human odour. n.s., not significant. Exact P-values are provided in Source Data. Source Data
Extended Data Fig. 7
Extended Data Fig. 7. Expression of opsin and trpA1 RNAs in antennae assayed by RT-PCR.
a, RT-PCR with primers specific to trpA1, op1, and op2 mRNAs using cDNA derived from female antennae. Primers specific to RpL17 mRNA were used as a positive control (bottom row). RNAs from the control and mutant mosquitoes were used to generate the PCR products for the indicated genes (trpA1, op1 and op2) and for RpL17. The PCR products for trpA1, op1 and op2 and for RpL17 were loaded in adjacent sets of wells on the same 1% agarose gel. The original scan of the experiments from two biological replicates are shown in Supplementary Fig. 3. b, Expanded qPCR data (from Fig. 3g) for the low-abundance opsin genes. n = 3 biological replicates, Means ± SEMs. Source Data
Extended Data Fig. 8
Extended Data Fig. 8. Checking whether the trpA1 and opsin double mutants display normal taxis, and presence of trpA1- and opsin-expressing neurons in sensilla at the distal end of the mutant antennae.
a, Odour preference assays performed on control, trpA11, and op12,op21 in response to CO2 alone versus CO2 with human odour. Each group is n = 6 (biological replicates). Means ± SEMs. One-way ANOVA with Tukey’s test for multiple comparisons. n.s., not significant. b-g, In situ hybridizations at the distal end (13th flagellomere) of female antennae. Confocal images below in b-d. b, trpA1 mRNA in the op12,op21 mutant. c, op1 mRNA in the trpA11 mutant. d, op2 mRNA in the trpA11 mutant. n ≥ 5 for b-d. e, brp mRNA in WT. f, brp mRNA in the trpA11 mutant. g, brp mRNA in the op12,op21 mutant. n = 3 for e-g. a-g, Scale bar is 20 μm. h-j, Cross-sectional bright-field images of the distal end (13th flagellomere) of female antennae. Antennal vessel (AV), antennal haemocoel (AH), Scale bars are 10 μm. h, WT. i, trpA11 j, op12,op21. n = 3 for h-j. Exact P-values provided in Source Data. Source Data

References

    1. Shaw, W. R. & Catteruccia, F. Vector biology meets disease control: using basic research to fight vector-borne diseases. Nat. Microbiol.4, 20–34 (2019). - PMC - PubMed
    1. Girard, M., Nelson, C. B., Picot, V. & Gubler, D. J. Arboviruses: a global public health threat. Vaccine38, 3989–3994 (2020). - PMC - PubMed
    1. McMeniman, C. J., Corfas, R. A., Matthews, B. J., Ritchie, S. A. & Vosshall, L. B. Multimodal integration of carbon dioxide and other sensory cues drives mosquito attraction to humans. Cell156, 1060–1071 (2014). - PMC - PubMed
    1. Cardé, R. T. Multi-cue integration: how female mosquitoes locate a human host. Curr. Biol.25, R793–R795 (2015). - PubMed
    1. van Breugel, F., Riffell, J., Fairhall, A. & Dickinson, M. H. Mosquitoes use vision to associate odor plumes with thermal targets. Curr. Biol.25, 2123–2129 (2015). - PMC - PubMed

MeSH terms