. 2024 Sep;633(8031):856-863.
doi: 10.1038/s41586-024-07853-8. Epub 2024 Aug 21.

Oligodendrocytes and myelin limit neuronal plasticity in visual cortex

Affiliations

Oligodendrocytes and myelin limit neuronal plasticity in visual cortex

Wendy Xin et al. Nature. 2024 Sep.

Abstract

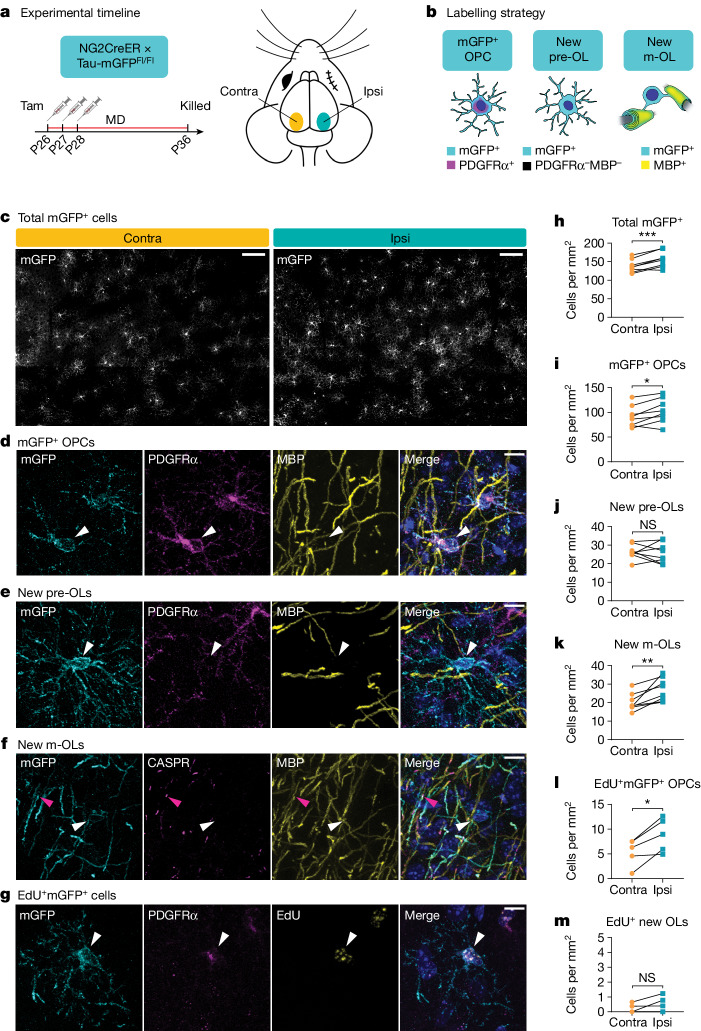
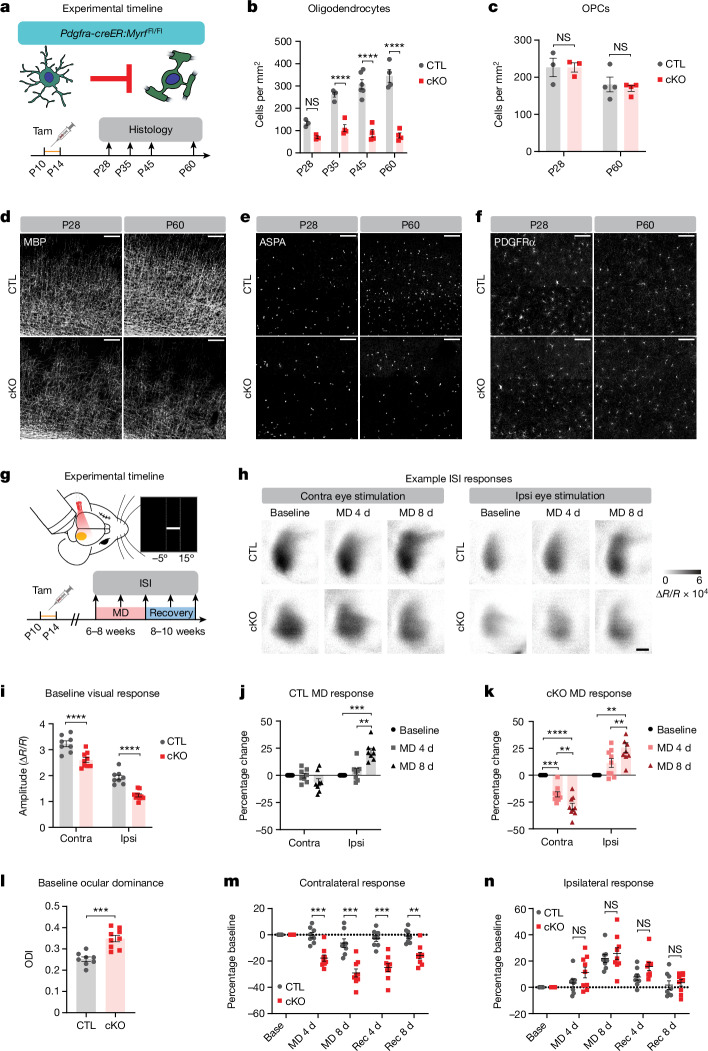
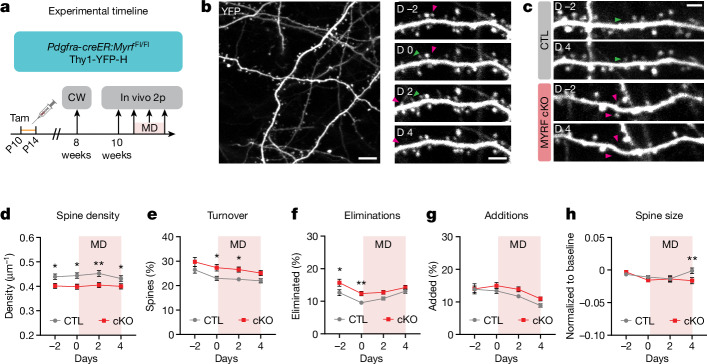
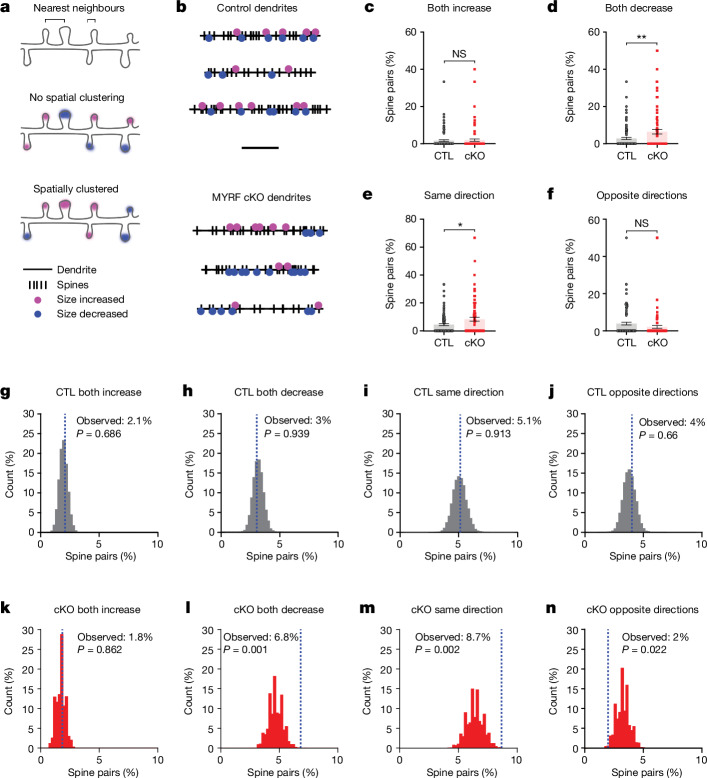
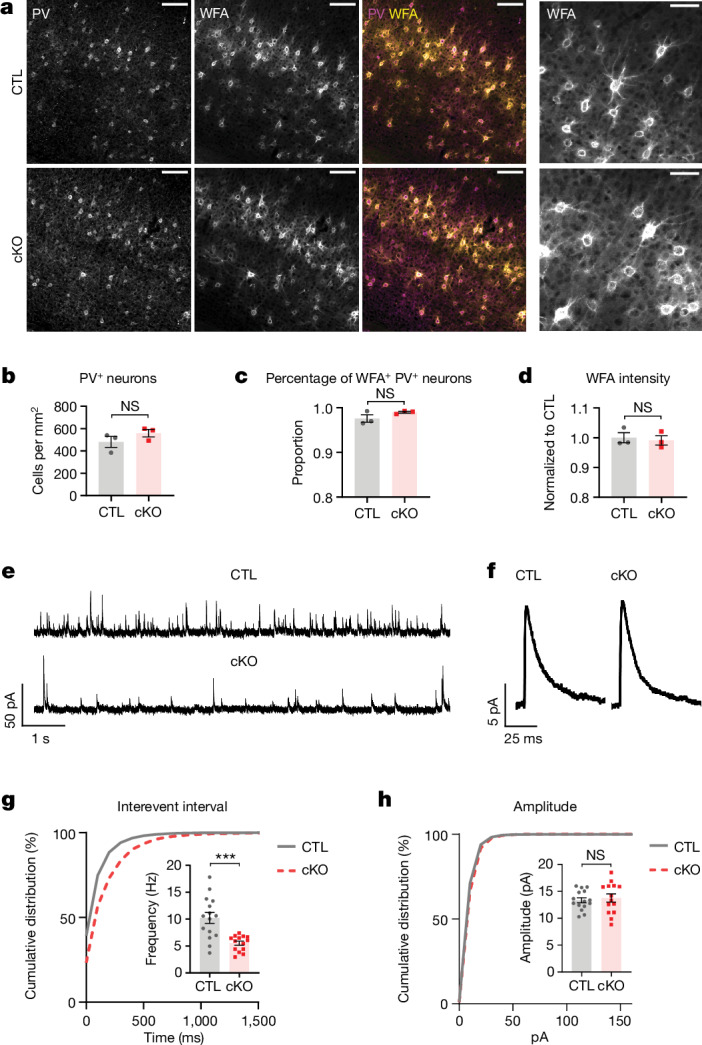
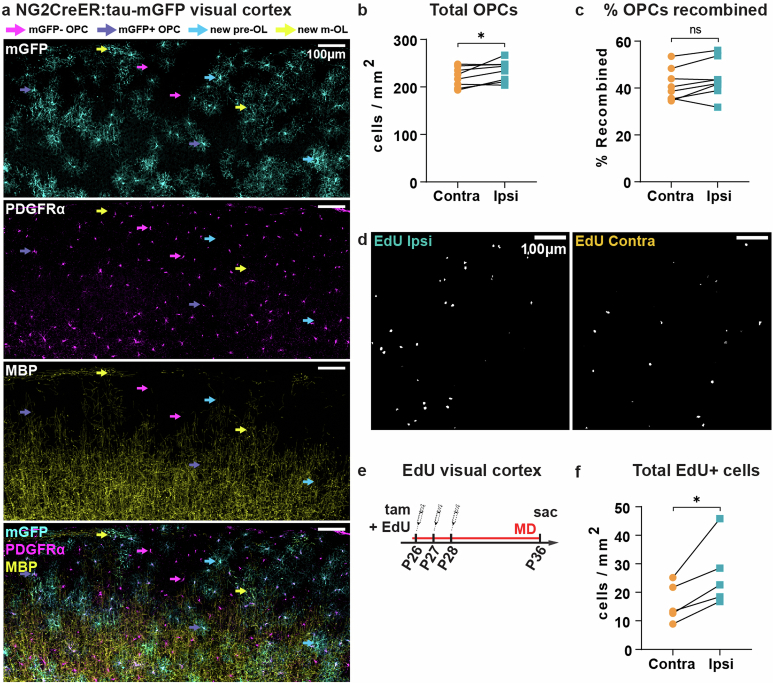
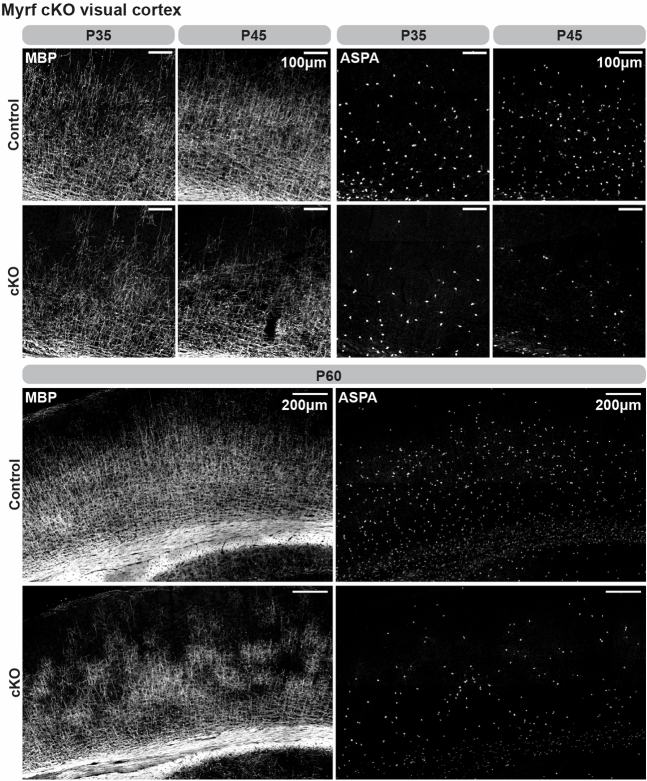
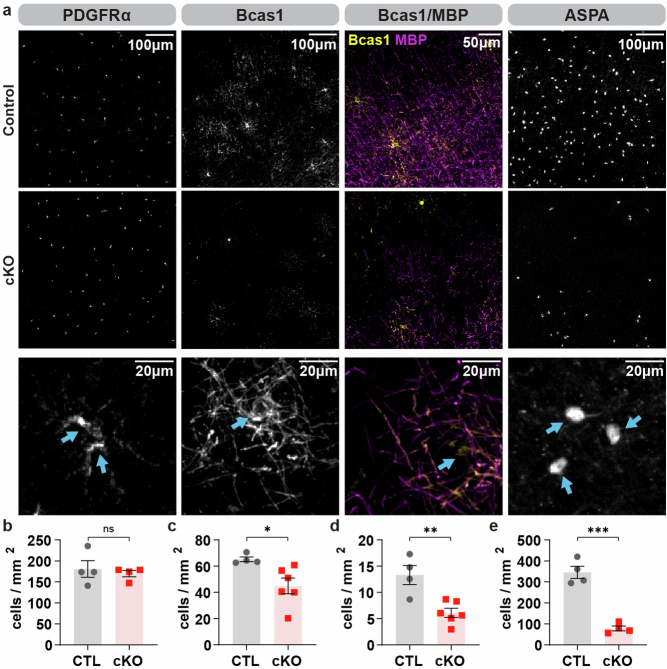
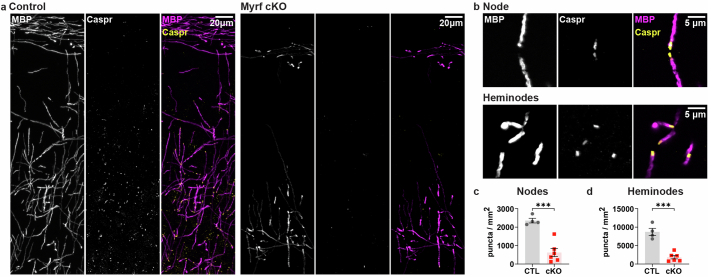
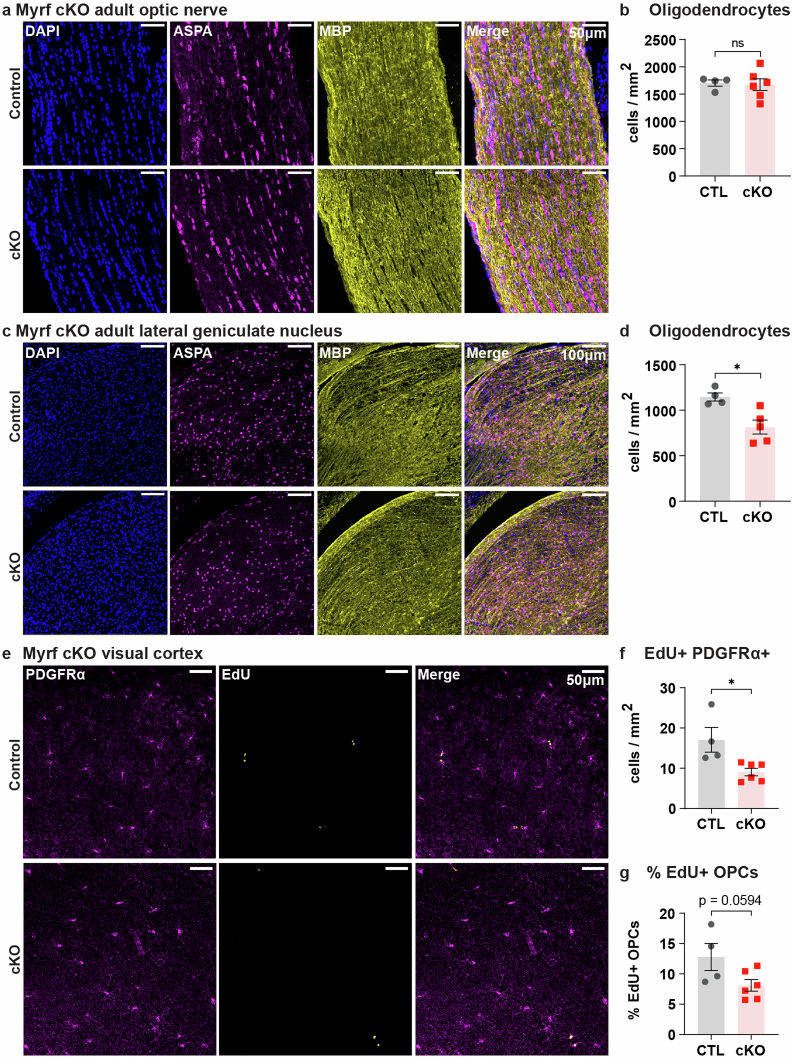
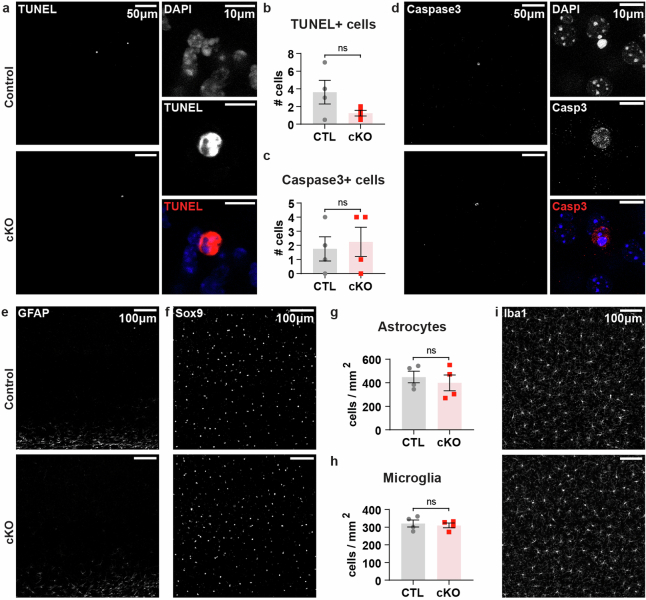
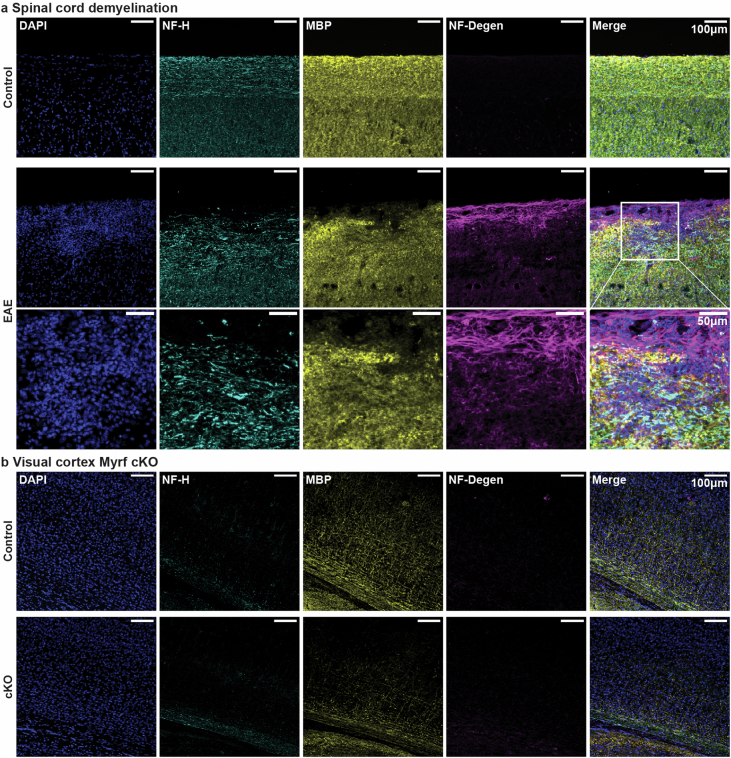
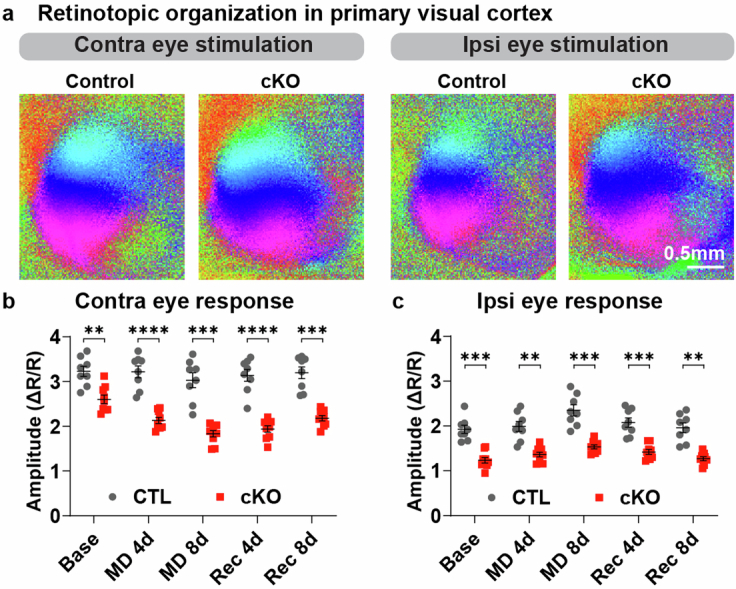
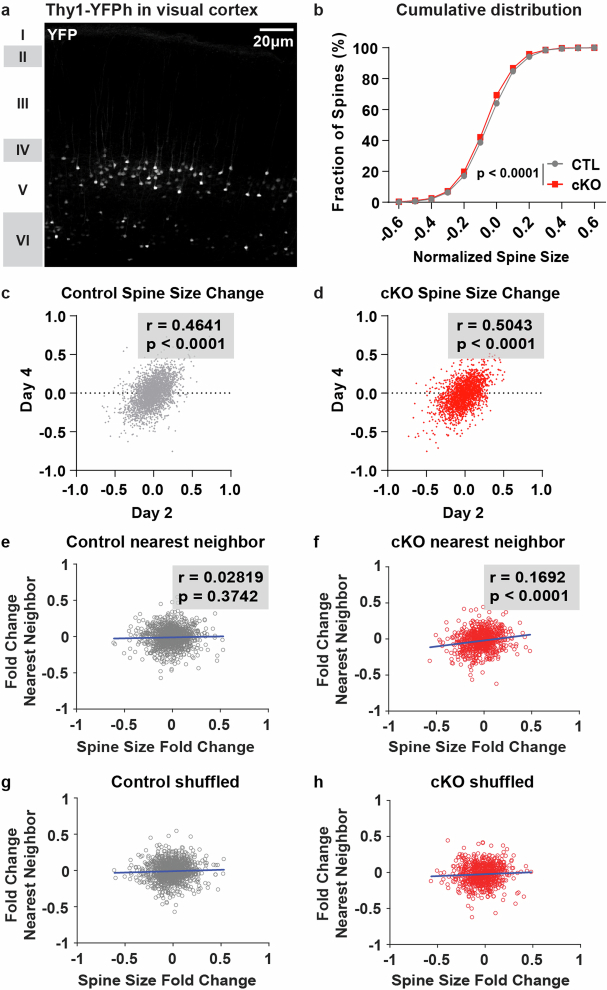
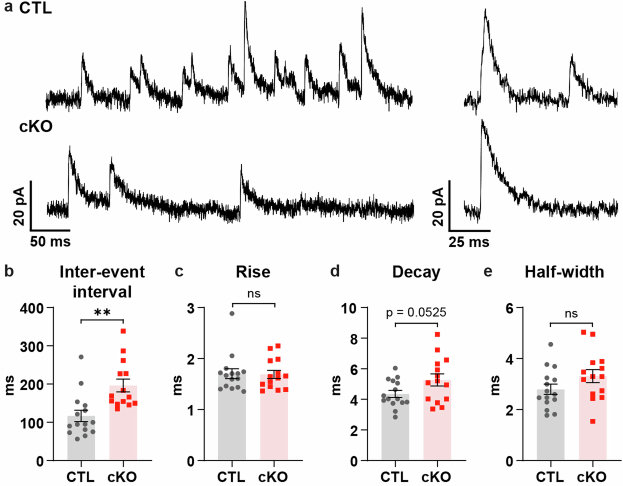
Developmental myelination is a protracted process in the mammalian brain1. One theory for why oligodendrocytes mature so slowly posits that myelination may stabilize neuronal circuits and temper neuronal plasticity as animals age2-4. We tested this theory in the visual cortex, which has a well-defined critical period for experience-dependent neuronal plasticity5. During adolescence, visual experience modulated the rate of oligodendrocyte maturation in visual cortex. To determine whether oligodendrocyte maturation in turn regulates neuronal plasticity, we genetically blocked oligodendrocyte differentiation and myelination in adolescent mice. In adult mice lacking adolescent oligodendrogenesis, a brief period of monocular deprivation led to a significant decrease in visual cortex responses to the deprived eye, reminiscent of the plasticity normally restricted to adolescence. This enhanced functional plasticity was accompanied by a greater turnover of dendritic spines and coordinated reductions in spine size following deprivation. Furthermore, inhibitory synaptic transmission, which gates experience-dependent plasticity at the circuit level, was diminished in the absence of adolescent oligodendrogenesis. These results establish a critical role for oligodendrocytes in shaping the maturation and stabilization of cortical circuits and support the concept of developmental myelination acting as a functional brake on neuronal plasticity.


Conflict of interest statement

The authors declare no competing interests.

Figures

Fig. 1
Fig. 1. Sensory experience during adolescence modulates oligodendroglial dynamics.
a, Experimental strategy and timeline. b, Labelling strategy for identification of OPCs, newly formed premyelinating oligodendrocytes (pre-OLs) and mature oligodendrocytes (m-OLs). c,h, Representative images (c) and quantification (h) of mGFP+ cells from both hemispheres of visual cortex. Two-tailed paired t-test, n = 8 mice, P = 0.0009. d,i, Example image (d) and quantification (i) of mGFP+ OPCs. Two-tailed paired t-test, n = 8 mice, P = 0.0183. e,j, Example image (e) and quantification (j) of newly formed pre-OLs. Two-tailed paired t-test, n = 8 mice, P = 0.7584. f,k, Example image (f) and quantification (k) of newly formed m-OLs. Two-tailed paired t-test, n = 8 mice, P = 0.0064. g,l, Example image (g) and quantification (l) of mGFP+EdU+ OPCs. Two-tailed paired t-test, n = 5 mice, P = 0.018. m, Quantification of mGFP+EdU+PDGFRα newly formed OLs. Two-tailed paired t-test, n = 5 mice, P = 0.1763. White arrowheads represent cell bodies, pink arrowheads MBP+CASPR+mGFP+ myelin sheath. *P < 0.05, **P < 0.01, ***P < 0.001. Scale bars, 100 µm (c), 10 µm (dg). Additional statistical details available in Supplementary Table 1. Contra, hemisphere contralateral to the deprived eye; ipsi, hemisphere ipsilateral to the deprived eye; MD, monocular deprivation; NS, not significant; tam, tamoxifen. Source Data
Fig. 2
Fig. 2. Impairment of adolescent oligodendrogenesis disrupts adult visual cortex activity and enhances experience-dependent neuronal plasticity.
a, Experimental strategy and histology timeline. b,e, Quantification (b, P = 0.0002) and example images (e) of mature oligodendrocytes in the visual cortex at P28 and P60 in CreER (CTL) and CreER+ (cKO) mice. c,f, Quantification (c, P = 0.7504) and example images (f) of OPCs in visual cortex. d, Example images of myelin in visual cortex. g, Experimental strategy and timeline for intrinsic signal imaging (ISI). h, Example images from ISI. i,l, Amplitude of ISI responses (i, P < 0.0001) and ocular dominance (l) in binocular visual cortex at baseline (P = 0.0001). j, Change in ISI responses in adult control mice following 4 or 8 days of MD (contra, P = 0.1804; ipsi, P < 0.0001). k, Change in ISI responses in adult cKO mice (contra, P < 0.0001; ipsi, P < 0.0001). m, Change in ISI responses to contralateral eye stimulation following MD and recovery (rec) (P < 0.0001). n, Change in ISI responses to ipsilateral eye stimulation (P = 0.3008). b,c, Two-way analysis of variance (ANOVA) with Sidak’s multiple-comparisons test, n = 3–6 mice per age, per genotype; i, two-way ANOVA with Sidak’s multiple-comparisons test; j,k, one-way repeated-measures ANOVA followed by Tukey’s multiple-comparisons test; l, unpaired two-tailed t-test. m,n, two-way ANOVA with Sidak’s multiple-comparisons test; in, n = 8 CTL mice and n = 9 cKO mice. Data presented as mean ± s.e.m. **P < 0.01, ***P < 0.001, ****P < 0.0001. Additional statistical details are provided in Supplementary Table 1. Scale bars, 100 µm (df), 0.5 mm (h). MD 4 d/8 d, following 4 days/8 days of MD; ODI, ocular dominance index, defined as (contra − ipsi responses)/(contra + ipsi). ∆R/R, change in relative reflectance. Source Data
Fig. 3
Fig. 3. Adult mice with impaired adolescent oligodendrogenesis have fewer spines and higher spine turnover.
a, Experimental strategy and timeline. b, Left, example two-photon (2p) image from an adult mouse visual cortex, contralateral to the deprived eye (z-projection of a 7-μm-thick volume). Right, example dendrite imaged at 2 days pre-MD (D −2), just before MD (D 0), 2 days following MD (D 2) and 4 days following MD (D 4) (z-projection of a 5-μm-thick volume). c, Example dendrites from control and cKO mice (z-projections of 3-μm-thick volumes). dh, Average spine density (d, P = 0.0071), spine turnover (e, P = 0.0033), spine eliminations (f, P = 0.0002), spine additions (g, P = 0.0634) and spine size (h, P = 0.1175, interaction P = 0.0486) in CTL and cKO visual cortex dendrites. Green arrowheads denote spines that were added, pink arrowheads spines that were eliminated. d,h, Two-way repeated-measures ANOVA followed by Holm–Sidak multiple-comparisons test, n = 111 dendrites from ten CTL mice and n = 97 dendrites from ten cKO mice. eg, Mixed-effects analysis (restricted maximum likelihood) followed by Holm–Sidak multiple-comparisons test, n = 111 dendrites from ten CTL mice and n = 97 dendrites from ten cKO mice. Data presented as mean ± s.e.m. *P < 0.05, **P < 0.01. Scale bars, 5 μm (b (right), c) and 10 μm (b, left). Additional statistical details are provided in Supplementary Table 1. CW, cranial window. Source Data
Fig. 4
Fig. 4. Monocular deprivation induces spatially clustered spine size decreases in adult mice with impaired adolescent oligodendrogenesis.
a, Schematic of nearest-neighbour analysis. Brackets indicate two examples of pairs of nearest-neighbouring spines. b, Spinodendrograms of three example dendrites per group. Scale bar, 20 μm. cf, Percentage of spine pairs per dendrite that either increased (c, P = 0.7427), decreased (d, P = 0.0052), changed in the same direction (e, P = 0.0112) or changed in opposite directions (f, P = 0.1052) in CTL and cKO mice. g, Distribution of percentage of spine pairs that increased together (P = 0.686) from 10,000 random spine–location pairings in control mice; blue dashed line denotes the observed percentage of spine pairs. hj, Distribution of percentages of random spine pairs that either decreased together (h, P = 0.939), changed in the same direction (i, P = 0.913) or changed in opposite directions (j, P = 0.66) in control mice. kn, Distribution of percentages of random spine pairs (and observed percentage, blue dashed line) that either increased (k, P = 0.862), decreased (l, P = 0.001), changed in the same direction (m, P = 0.002) or changed in opposite directions (n, P = 0.022) in cKO mice. cf, Unpaired two-tailed t-tests, n = 110 dendrites from ten CTL mice and n = 96 dendrites from ten cKO mice; data presented as mean ± s.e.m. gn, Monte Carlo P values, n = 996 spine pairs from ten CTL mice and n = 704 spine pairs from ten cKO mice. *P < 0.05, **P < 0.01. Additional statistical details are provided in Supplementary Table 1. Source Data
Fig. 5
Fig. 5. Inhibitory synaptic transmission is impaired in adult mice lacking adolescent oligodendrogenesis.
a, Example images of parvalbumin (PV) and WFA immunostaining in the adult visual cortex of CreER (CTL) and CreER+ (cKO) mice. bd, Quantification of PV+ neuron density (b, P = 0.2538), percentage of PV+ neurons with WFA+ perineuronal nets (c, P = 0.1773) and WFA intensity in visual cortex (d, P = 0.718). e, Example voltage-clamp traces recorded at 0 mV from layer V visual cortex pyramidal neurons in the presence of tetrodotoxin, d-(-)-2-amino-5-phosphonopentanoic acid (APV) and 2,3-dioxo-6-nitro-1,2,3,4-tetrahydrobenzo[f]quinoxaline-7-sulfonamide (NBQX). f, Example waveforms of mIPSCs (average trace obtained from all events recorded from one cell for each genotype). g, Cumulative distribution of mIPSC interevent interval. Inset, quantification of mIPSC frequency (P = 0.0003). h, Cumulative distribution of mIPSC amplitude. Inset, quantification of mIPSC amplitude (P = 0.6413). bd, Unpaired two-tailed t-test, n = 3 CTL mice and n = 3 cKO mice; gh, unpaired two-tailed t-test, n = 15 cells from five CTL mice and n = 14 cells from five cKO mice. Data presented as mean ± s.e.m. ***P < 0.001. Additional statistical details are provided in Supplementary in Table 1. Source Data
Extended Data Fig. 1
Extended Data Fig. 1. Sensory experience during adolescence modulates oligodendroglial dynamics.
(A) Example image from visual cortex. OPC = oligodendrocyte precursor cell, pre-OL = pre-myelinating oligodendrocyte, m-OL = mature oligodendrocyte. (B) Total PDGFRα + OPCs per hemisphere (p = 0.0373). Contra = hemisphere contralateral to the deprived eye, ipsi = hemisphere ipsilateral to the deprived eye. (C) Percentage of PDGFRα + OPCs that were mGFP+ (p = 0.066). (D) Example images of EdU+ cells in visual cortex. (E) Timeline of EdU injections. (F) Quantification of total EdU+ cells in both hemispheres of visual cortex (p = 0.022). Panels B-C: paired two-tailed t-test, n = 8 mice. Panel F: paired two-tailed t-test, n = 5 mice. *p < 0.05, ns = not significant. Additional statistical details in Table S1. Source Data
Extended Data Fig. 2
Extended Data Fig. 2. OPC-specific deletion of Myrf in adolescence impairs oligodendrogenesis and myelination in visual cortex.
Example images of myelin (MBP) and mature oligodendrocytes (ASPA) in visual cortex of control and Myrf cKO mice at P35, P45, and P60.
Extended Data Fig. 3
Extended Data Fig. 3. Stage-dependent decrease in oligodendrocyte density in adult visual cortex of Myrf cKO mice.
(A) Example images and (B) quantification of OPCS (PDGFRα; p = 0.6237), (C) newly formed oligodendrocytes (Bcas1; p = 0.0291), (D) newly formed oligodendrocytes that are actively myelinating (Bcas1/MBP; p = 0.004), and (E) mature oligodendrocytes (ASPA; p = 0.0001) of control and Myrf cKO mice at P60. Blue arrows denote cell bodies. Panels B-E: unpaired two-tailed t-tests, n = 4 CTL mice and 6 cKO mice. Data are presented as mean +/- SEM. *p < 0.05, **p < 0.01, ***p < 0.001, ns = not significant. Additional statistical details in Table S1. Source Data
Extended Data Fig. 4
Extended Data Fig. 4. Analysis of Caspr+ paranodes in adult visual cortex of control and Myrf cKO mice.
(A) Example images of myelin sheaths (MBP) and paranodes (Caspr) in adult visual cortex. (B) Example images of pairs of Caspr+ puncta categorized as a node (top row) or as heminodes (bottom row). (C) Quantification of number of nodes (p = 0.0004) and (D) heminodes (p = 0.0001) by genotype. Panels C-D: unpaired two-tailed t-tests, n = 4 CTL mice and 6 cKO mice. Data are presented as mean +/- SEM. ***p < 0.001, ns = not significant. Additional statistical details in Table S1. Source Data
Extended Data Fig. 5
Extended Data Fig. 5. Myelination in optic nerve and lateral geniculate nucleus, and visual cortex OPC proliferation, of adult control and Myrf cKO mice.
(A) Example images of myelin (MBP) and oligodendrocytes (ASPA) in optic nerve. (B) Quantification of ASPA+ oligodendrocytes in optic nerve (p = 0.8477). (C) Example images of myelin and oligodendrocytes in lateral geniculate nucleus. (D) Quantification of ASPA+ oligodendrocytes in lateral geniculate nucleus (p = 0.0105). (E) Example images of OPCs (PDGFRα) and EdU labeling in visual cortex. (F) Quantification of PDGFRα + EdU+ OPCs in visual cortex (p = 0.0176). (G) Quantification of percentage of PDGFRα + OPCs that were EdU+ in visual cortex. Panels B, F-G: unpaired two-tailed t-tests, n = 4 CTL mice and 6 cKO mice. Panel D: unpaired two-tailed t-test, n = 4 CTL mice and 5 cKO mice. Data are presented as mean +/- SEM. *p < 0.05. Additional statistical details in Table S1. Data are presented as mean +/- SEM. *p < 0.05, ns = not significant. Additional statistical details in Table S1. Source Data
Extended Data Fig. 6
Extended Data Fig. 6. Cell death, astrocyte density, and microglia density in adult control and Myrf cKO mice.
(A) Example images and (B) quantification of TUNEL immunostaining in visual cortex (p = 0.1748). (C) Quantification (p = 0.7216) and (D) example images of Caspase+ cells in visual cortex. (E) Example images of GFAP immunostaining in visual cortex. (F) Example images and (G) quantification of Sox9+ astrocytes (p = 0.5736) in visual cortex. (H) Quantification (p = 0.6627) and (I) example images of Iba1+ microglia in visual cortex. Panel B: Welch’s t-test, n = 4 CTL mice and 4 cKO mice. Panels C, G-H: unpaired two-tailed t-test, n = 4 CTL mice and 4 cKO mice. Data are presented as mean +/- SEM. ns = not significant. Additional statistical details in Table S1. Source Data
Extended Data Fig. 7
Extended Data Fig. 7. Assessing neurodegeneration in demyelination and in Myrf cKO mice.
(A) Immunostaining for neurofilament H (NF-H), myelin basic protein (MBP), and neurofilament light chain DegenoTag (NF-Degen) in spinal cords of control mice and mice that underwent experimental autoimmune encephalitis (EAE). Disordered NF-H and prominent NF-Degen signal can be detected in the spinal cord of EAE mice, most notably in regions of demyelination. (B) Immunostaining for NF-H, MBP, and NF-Degen in visual cortex of control and Myrf cKO mice.
Extended Data Fig. 8
Extended Data Fig. 8. Retinotopic organization and amplitude of visual cortex responses to visual stimulation in adult control and Myrf cKO mice.
(A) Example intrinsic signal images of retinotopy in primary visual cortex. (B, C) Amplitude of intrinsic signal imaging responses to stimulation of the contralateral deprived eye (contra; p < 0.0001) or ipsilateral non-deprived eye (ipsi; p < 0.0001) in binocular visual cortex of control (CTL) and cKO mice. Panels B-C: two-way ANOVA followed by Sidak’s multiple comparisons test, n = 8 CTL mice and 9 cKO mice. Data are presented as mean +/- SEM. **p < 0.01, ***p < 0.001, ****p < 0.0001. Additional statistical details in Table S1. Source Data
Extended Data Fig. 9
Extended Data Fig. 9. Spine size changes following monocular deprivation in adult control and Myrf cKO mice.
(A) Low magnification image of Thy1YFPh expression in visual cortex. (B) Cumulative distribution plot of spine size changes in control (CTL) and Myrf cKO (cKO) mice after four days of monocular deprivation. (C, D) Correlation of spine size changes after two days of monocular deprivation with spine size changes after four days of monocular deprivation in control and cKO mice. (E, F) Correlation of average size change following monocular deprivation for a given spine and size change of its nearest neighbor in control and cKO mice. (G, H) Example correlation of nearest neighbor spine changes in one set of shuffled spine pairings for control and cKO mice. Panel B: Kolmogorov-Smirnov test, n = 3484 spines from 10 CTL mice and 2438 spines from 10 cKO mice. Panels C-F: Pearson r correlation, n = 10 CTL and 10 cKO mice, exact numbers of spine numbers and spine pairs can be found along with additional statistical details in Table S1. Source Data
Extended Data Fig. 10
Extended Data Fig. 10. Inhibitory synaptic transmission in adult control and Myrf cKO mice.
(A) Example voltage clamp traces recorded at 0 mV from control (CTL) and Myrf cKO (cKO) mice, in the presence of TTX, APV, and NBQX. (B) Quantification of mIPSC inter-event interval (p = 0.0014), (C) rise time (p = 0.9116), (D) decay time (p = 0.0525), and (E) half-width (p = 0.1218). Panels B-E: unpaired two-tailed t-test, n = 15 cells from 5 CTL mice and 14 cells from 5 cKO mice. Data are presented as mean +/− SEM. **p < 0.01, ns = not significant. Additional statistical details in Table S1. Source Data

Update of

References

    1. Williamson, J. M. & Lyons, D. A. Myelin dynamics throughout life: an ever-changing landscape? Front. Cell. Neurosci.12, 424 (2018). - PMC - PubMed
    1. Priebe, N. J. & McGee, A. W. Mouse vision as a gateway for understanding how experience shapes neural circuits. Front. Neural Circuits8, 123 (2014). - PMC - PubMed
    1. Hensch, T. K. Critical period plasticity in local cortical circuits. Nat. Rev. Neurosci.6, 877–888 (2005). - PubMed
    1. LeVay, S. & Stryker, M. P. in Aspects of Developmental Neurobiology Vol. 4 (ed. Ferrebdelli, J. A.) 83–98 (Society for Neuroscience, 1979).
    1. Gordon, J. A. & Stryker, M. P. Experience-dependent plasticity of binocular responses in the primary visual cortex of the mouse. J. Neurosci.16, 3274–3286 (1996). - PMC - PubMed

MeSH terms