. 2024 Oct;26(10):1745-1758.
doi: 10.1038/s41556-024-01489-6. Epub 2024 Aug 21.

RNA sequestration in P-bodies sustains myeloid leukaemia

Affiliations

RNA sequestration in P-bodies sustains myeloid leukaemia

Srikanth Kodali et al. Nat Cell Biol. 2024 Oct.

Abstract

Post-transcriptional mechanisms are fundamental safeguards of progenitor cell identity and are often dysregulated in cancer. Here, we identified regulators of P-bodies as crucial vulnerabilities in acute myeloid leukaemia (AML) through genome-wide CRISPR screens in normal and malignant haematopoietic progenitors. We found that leukaemia cells harbour aberrantly elevated numbers of P-bodies and show that P-body assembly is crucial for initiation and maintenance of AML. Notably, P-body loss had little effect upon homoeostatic haematopoiesis but impacted regenerative haematopoiesis. Molecular characterization of P-bodies purified from human AML cells unveiled their critical role in sequestering messenger RNAs encoding potent tumour suppressors from the translational machinery. P-body dissolution promoted translation of these mRNAs, which in turn rewired gene expression and chromatin architecture in leukaemia cells. Collectively, our findings highlight the contrasting and unique roles of RNA sequestration in P-bodies during tissue homoeostasis and oncogenesis. These insights open potential avenues for understanding myeloid leukaemia and future therapeutic interventions.


Conflict of interest statement

Ethics declarations

Competing interests

E.V.N. is co-founder, member of the Board of Directors, on the SAB, equity holder, and paid consultant for Eclipse BioInnovations, on the SAB of RNAConnect, and is inventor of intellectual property owned by University of California San Diego. E.V.N’s interests have been reviewed and approved by the Baylor College of Medicine in accordance with its conflict of interest policies. P.M. is a co-founder, member of the Board of Directors, equity holder, and paid consultant for OneChain Immunotherapeutics S.L. (Barcelona, Spain). This work has no connection with and is not related to the scientific interests of OneChain Immunotherapeutics. J.J.C. is a consultant for Thermo Fisher Scientific, 908 Devices, and Seer. The remaining authors declare no competing financial interests.

Figures
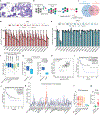
Extended Data Fig. 1
Extended Data Fig. 1. CRISPR screens identify P-body regulators as a selective dependency in AML
(a) Cytospins of HPC7 and CebpaN-mutant/C-mutant (CNC) cells. n=3 independent experiments. (b) Schematic illustration of pooled genome-wide CRISPR/Cas9 dropout screening strategy. (c) Venn diagram showing filtering strategy for the identification of 308 leukemia-specific genetic dependencies shown in Fig. 1a. (d, e) Competition-based proliferation assay in (d) CNC Cas9 cells or (e) HPC7 Cas9 cells, illustrated as color-coded percentage of iRFP670+ cells transduced with indicated sgRNAs over 19 d. The non-targeting sgCTRL is used as a negative control, sgRpa3, targeting essential gene Rpa3, is used as a positive control. Results are normalized to day 5 post-infection. Two-way ANOVA with Dunnett’s post-hoc test, n=3 biological replicates per group, mean ± s.e.m. (f) Boxplots showing the expression levels (log2 mRNA) of P-body related genes (displayed in Fig. 1c) in AML, normal HSPCs, and MDS samples. AML normal karyotype (n=28), AML t(15;17) (n=28), AML t(8;21) (n=28), AML t(11q23)/MLL (n=28), HSC (hematopoietic stem cell) (n=6), GMP (granulocyte monocyte progenitor) (n=7), MDS (myelodysplastic syndromes) (n=28). Box center line indicates median, box limits indicate upper (Q3) and lower quartiles (Q1), lower whisker is Q1 − 1.5 × interquartile range (IQR) and upper whisker is Q3 + 1.5 × IQR. Two-tailed t-test with Welch’s correction. (g) Boxplots showing normalized H3K27ac ChIP-seq signal (RPKM) in MOLM-13 cells (GSM4685439 and GSM4685440) and CD34+ HSPCs at enhancers (n=26 per group) (left panel) and promoter (n=214 per group) (right panel) regions (GSM772885 and GSM772894) of P-body genes. Box center line indicates median, box limits indicate upper (Q3) and lower quartiles (Q1), lower whisker is Q1 − 1.5 × IQR and upper whisker is Q3 + 1.5 × IQR. Two-tailed t-test with Welch’s correction. (h) Significant correlation between the expression of DDX6 and EIF4ENIF1 in the TCGA-LAML dataset. Pearson’s correlation coefficients and corresponding p-values (two-tailed one-sample Student’s t-test) are indicated. (i, j) Kaplan-Meier survival analysis plots of TCGA data for AML patients with low vs high expression of (i) EIF4ENIF1 (n=27 patients per group) or (j) DDX6 (n=53 patients per group). (k) DDX6 mRNA expression in AML (red) compared to other cancers, based on data from TCGA database. Data are presented as mean log2 expression with range. Black dots: expression levels in normal cells; Blue dots: expression levels in cancer cells. (l) DDX6 expression in AML patient samples compared to normal HSPCs. AML: n=48, AML t(15;17): n=54, AML inv(16)/t(16;16): n=47, AML t(8;21): n=60, AML t(11q23)/MLL: n=43 patients. HSC (hematopoietic stem cell): n=6, GMP (granulocyte monocyte progenitor): n=7 healthy individuals (BloodSpot data of DDX6 probe 204909_at). Unpaired two-tailed Student’s t-test. (m) qRT-PCR for DDX6 in human primary CD34+ cells (n=7 healthy individuals) and AML patient cells (n=10 patients). Unpaired two-tailed Student’s t-test, mean.
Extended Data Fig. 2
Extended Data Fig. 2. DDX6 is essential for AML cell proliferation and survival in vitro
(a) Representative IF imaging of EDC4 punctae (green) in control and DDX6 overexpressing HPC7 cells. Nuclei were counterstained with DAPI (blue). Scale: 2.5 μm. (b) Quantification of EDC4 punctae in HPC7 cells overexpressing DDX6 by IF. n=45–55 cells per group, unpaired two-tailed Student’s t-test, mean ± s.e.m. (c) Representative Western blot image of DDX6 in the nuclear and cytoplasmic fractions of MOLM-13 cells. n=3 independent experiments. (d) Representative IF imaging of LSM14A (green) and DDX6 (red) punctae in control and DDX6 KD MOLM-13 cells. Nuclei were counterstained with DAPI. Scale: 10 μm. (e) Quantification of LSM14A+DDX6+ punctae in control and DDX6 KD MOLM-13 cells by IF. Unpaired two-tailed Student’s t-test, n=24–30 cells per group, mean ± s.e.m. (f) Representative intracellular flow cytometry plots showing DDX6 levels in shCTRL and shDDX6 MOLM-13 cells. (g) qRT-PCR validation of DDX6 KD in MOLM-13 cells. Unpaired two-tailed Student’s t-test, n=3 biologically independent samples per group, mean ± s.e.m. (h) Proliferation assay for shCTRL and shDDX6 AML cell lines at the indicated time points after transduction. Two-way ANOVA with Dunnett’s post-hoc test, n=3 biological replicates per group, mean ± s.e.m. (i) Competition-based proliferation assays upon DDX6 knockdown performed in indicated cell lines. shRPL17, targeting the essential gene RPL17, is used as a positive control. Two-way ANOVA with Dunnett’s post-hoc test, n=3 biologically independent samples per group, mean ± s.e.m. (j) Heatmap summarizing the competition-based proliferation assays upon DDX6 knockout in indicated Cas9-expressing cell lines. Data are illustrated as color-coded percentage of iRFP670+ cells transduced with indicated sgRNAs over 17 d. sgAAVS1 is used as negative control, sgRPL17 is used as positive control. Results are normalized to day 3 post-infection, (n=3 biologically independent samples per group, mean). (k) Proliferation assay for CTRL and DDX6 KO human AML cell lines at the indicated time points after transduction. Unpaired two-tailed Student’s t-test, n=3 biologically independent samples per group, mean ± s.e.m. (l) Schematic of dCas9-KRAB and sgRNA vectors (upper panel). Representative intracellular flow cytometry plots for DDX6 in CRISPRi HEL cells, either untreated (UT) or treated with doxycycline (DOX) for 7 d (lower panel). (m) Representative IF imaging of EDC4 punctae (green) in CRISPRi HEL cells, either untreated (UT) or treated with doxycycline (DOX) for 4 d. Nuclei were counterstained with DAPI (blue). Scale: 2.5 μm. (n) Proliferation assay for UT or DOX-treated CRISPRi HEL cells at the indicated time points after transduction. Unpaired two-tailed Student’s t-test, n=3 biologically independent samples per group, mean ± s.e.m. (o) Representative images of UT or DOX-treated CRISPRi HEL cells. Scale: 10 μm. (p) Megakaryocytic differentiation in CRISPRi HEL cells 7 d after DDX6 silencing was quantified by flow cytometry, using CD41 and CD61 as markers. Unpaired two-tailed Student’s t-test, n=3 biologically independent samples per group, mean ± s.e.m.
Extended Data Fig. 3
Extended Data Fig. 3. DDX6 is essential for the proliferation and gene expression program of AML cells
(a) Flow cytometric analysis of cell death (Annexin V+) in shCTRL and shDDX6 AML cell lines. Unpaired two-tailed Student’s t test, n=3 biologically independent samples per group, mean ± s.e.m. (b) Correlation heatmap showing the correlation (r) values between MOLM-13 RNA-seq samples. Scale bar represents the range of the correlation coefficients (r) displayed. (c) Heatmap of RNA-seq data for shCTRL and shDDX6 HL-60 cells (n=2, FC > 1.5; p < 0.05). Upregulated genes are depicted in red, while in blue are downregulated genes. (d) Correlation heatmap showing the correlation (r) values between HL-60 RNA-seq samples. Scale bar represents the range of the correlation coefficients (r) displayed. (e) GO enrichment analysis of differentially expressed genes in control vs. DDX6 KD HL-60 cells. (f) qRT-PCR validation of (left) EIF4ENIF1 KD and (right) LSM14A KD in MOLM-13 cells. Unpaired two-tailed Student’s t-test, n=3 biologically independent samples per group, mean ± s.e.m. (g) Quantification of LSM14A+DDX6+ punctae in control and (left) EIF4ENIF1 KD or (right) LSM14A KD MOLM-13 cells by IF. Unpaired two-tailed Student’s t-test, n=17–31 cells per group, mean ± s.e.m. (h) Representative Western blot showing HA-tagged endogenous DDX6 protein levels in DDX6-FKBP12F36V MOLM-13 cells after 2 d of dTAG-13 treatment, followed by washout and culture for 5 d. n=3 independent experiments. (i) Representative IF imaging of EDC4 punctae (green) and DDX6 punctae (red) in DDX6-FKBP12F36V MOLM-13 cells after 2 d of dTAG-13 treatment, followed by washout and culture for 5 d. Nuclei were counterstained with DAPI (blue). Scale: 10 μm. (j) Quantification of EDC4+DDX6+ punctae in the indicated cells by IF (n=47–87 cells per group, mean ± s.e.m.). (k) Representative Western blot showing HA-tagged endogenous DDX6 protein levels in DDX6-FKBP12F36V HL-60 cells after 2 d of dTAG-13 treatment, followed by washout and culture for 5 d. n=3 independent experiments. (l) Proliferation of DDX6-FKBP12F36V HL-60 cells, either untreated (UT), continuously treated with dTAG-13, or treated with dTAG-13 for 2, 5, or 6 days, followed by washout and culture (n=3 biological replicates per group, mean ± s.e.m.). (m) Percentages of control or DDX6 KD MOLM-13 cells in the bone marrow and spleens of NSG mice (25 d post-transplant) quantified by flow cytometry. Unpaired two-tailed Student’s t-test, n=3 mice per group, mean ± s.e.m. (n) Representative intracellular flow cytometry plot for DDX6 in shCTRL and shDDX6 MOLM-13 cells in the bone marrow of NSG mice (45 d post-transplant). (o) Genotyping PCR demonstrating poly(I:C)-induced Ddx6 deletion in c-Kit+ hematopoietic progenitor cells isolated from the bone marrow of Mx1-Cre/Ddx6fl/fl mice. n=3 independent experiments. (p) Left: Representative IF imaging of EDC4 punctae (green) and DDX6 punctae (red) in Ddx6WT and Ddx6KO c-Kit+ hematopoietic progenitor cells. Nuclei were counterstained with DAPI (blue), scale: 10 μm. Right: Quantification of EDC4+DDX6+ punctae by IF in Ddx6WT and Ddx6KO c-Kit+ hematopoietic progenitor cells. Unpaired two-tailed Student’s t-test, n=60–63 cells per group, mean ± s.e.m. (q) Left: Representative IF imaging of LSM14A punctae (green) and DDX6 punctae (red) in Ddx6WT and Ddx6KO c-Kit+ hematopoietic progenitor cells. Nuclei were counterstained with DAPI (blue), scale: 10 μm. Right: Quantification of LSM14A+DDX6+ punctae by IF in Ddx6WT and Ddx6KO c-Kit+ hematopoietic progenitor cells. Unpaired two-tailed Student’s t-test, n=32–33 cells per group, mean ± s.e.m.
Extended Data Fig. 4
Extended Data Fig. 4. DDX6 loss has little effect on steady-state hematopoiesis
(a) Representative image of spleens from mice 90 d after transplantation with MLL-AF9-transduced Ddx6WT and Ddx6KO c-Kit+ cells. (b) Weights of spleens isolated from mice 90 days after transplantation with MLL-AF9-transduced Ddx6WT and Ddx6KO c-Kit+ cells. Unpaired two-tailed Student’s t-test, Ddx6WT n=4 mice, Ddx6KO n=6 mice, mean ± s.e.m. (c) Representative flow cytometry plots of leukemia (GFP+) cells in bone marrow from mice 90 d after transplantation with MLL-AF9-transduced Ddx6WT and Ddx6KO c-Kit+ cells. (d) Representative intracellular flow cytometry plot for DDX6 in shCTRL and shDDX6 primary bone marrow human CD34+ cells. (e) Representative flow cytometry plots showing cell death (Annexin V+/Sytox AAD+) in shCTRL and shDDX6 primary human CD34+ cells. (f) qRT-PCR analysis to validate DDX6 KD in human iPSC-derived CD34+ HSPCs. Unpaired two-tailed t-test with Welch’s correction, n=3 biologically independent samples per group, mean ± s.e.m. (g) Proliferation assay for shCTRL and shDDX6 human iPSC-derived HSPCs at the indicated timepoints after transduction. Unpaired two-tailed Student’s t-test, n=3 biologically independent samples per group, mean ± s.e.m. (h) Flow cytometric analysis for myeloid differentiation (CD11b median fluorescence intensity (MFI)) in shCTRL vs shDDX6 human iPSC-derived HSPCs. Unpaired two-tailed Student’s t-test, n=3 biologically independent samples per group. (i) Flow cytometric analysis of cell death (Annexin V+) in human iPSC-derived HPCs. Unpaired two-tailed Student’s t-test, n=3 biologically independent samples per group, mean ± s.e.m. (j, k) Representative Western blots validating (j) LSM14A KD and (k) EIF4ENIF1 KD in primary human CD34+ cells. n=3 independent experiments. (l) Representative flow cytometry plots and quantification for CMP, GMP, and MEP populations (gated on LK cells) in the bone marrow of Mx1-Cre and Mx1-Cre/Ddx6fl/fl mice 110 d after Ddx6 deletion. Unpaired two-tailed Student’s t-test, Ddx6WT n=5 mice, Ddx6KO n=5 mice, mean ± s.e.m. (m, n) Quantification of myeloid cells, T cells, and B cells as a percentage of CD45+ cells in the (m) bone marrow and (n) spleens of Mx1-Cre and Mx1-Cre/Ddx6fl/fl mice 110 d after Ddx6 deletion. Unpaired two-tailed Student’s t-test, Ddx6WT n=5 mice, Ddx6KO n=5 mice, mean ± s.e.m. (o, p) Frequency of erythroid cells in the (o) bone marrow and (p) peripheral blood Mx1-Cre and Mx1-Cre/Ddx6fl/fl mice 110 d after Ddx6 deletion. Unpaired two-tailed Student’s t-test, Ddx6WT n=5 mice, Ddx6KO n=5 mice, mean ± s.e.m. (q) Representative Western blot analysis for DDX6 in bone marrow cells of Rosa26-Cre and Rosa26-Cre/Ddx6fl/fl mice. n=3 independent experiments. (r) Quantification of myeloid cells, T cells, and B cells as a percentage of CD45+ cells in the peripheral blood of Rosa26-Cre-ERT2 and Rosa26-Cre-ERT2/Ddx6fl/fl mice 80 d after tamoxifen treatment. Unpaired two-tailed Student’s t-test, Ddx6WT n=3 mice, Ddx6KO n=3 mice, mean ± s.e.m. (s) Frequency of erythroid cells in the peripheral blood of Rosa26-Cre-ERT2 and Rosa26-Cre-ERT2/Ddx6fl/fl mice 80 d after tamoxifen treatment. Unpaired two-tailed Student’s t-test, Ddx6WT n=3 mice, Ddx6KO n=3 mice, mean ± s.e.m. (t) Representative flow cytometry plots showing percentages of HSC, MPP1, MPP2, and MPP4 populations, gated on LSK cells, in the bone marrow of Rosa26-Cre-ERT2 and Rosa26-Cre-ERT2/Ddx6fl/fl mice after Ddx6 deletion. (u) Quantification of HSC, MPP1, MPP2, and MPP4 populations, as a percentage of LSK cells, in the bone marrow of Rosa26-Cre-ERT2 and Rosa26-Cre-ERT2/Ddx6fl/fl mice after Ddx6 deletion. Unpaired two-tailed Student’s t-test, Ddx6WT n=5 mice, Ddx6KO n=5 mice, mean ± s.e.m. (v) Kaplan-Meier survival curves of Rosa26-Cre-ERT2 and Rosa26-Cre-ERT2/Ddx6fl/fl mice 4 months after tamoxifen treatment. Mantel-Cox test, Ddx6WT n=3 mice, Ddx6KO n=3 mice.
Extended Data Fig. 5
Extended Data Fig. 5. DDX6 regulates HSC quiescence and response to stress
(a) Unsupervised clustering of Ddx6WT and Ddx6KO HSC, MPP1, MPP2, and MPP4 populations subjected to RNA-seq. (b) Representative flow cytometry plots of (left) MitoTracker Green FM and (right) TMRM staining in Ddx6WT and Ddx6KO HSCs, 24 d after Ddx6 deletion. (c) Representative flow cytometry plots of Ddx6WT and Ddx6KO chimerism within the donor hematopoietic compartment (CD45+) in the bone marrow 187 d after primary competitive transplantation. (d) HSCs sorted from CD45.1 and Mx1-Cre/Ddx6fl/fl mice were competitively transplanted into lethally irradiated WT recipient mice, followed by poly(I:C) treatment 34 d later. Quantification is shown of Ddx6WT and Ddx6KO chimerism within the donor hematopoietic compartment (CD45+) in peripheral blood, spleen, or bone marrow, at the indicated timepoints after Ddx6 deletion. Ddx6WT n=8 mice, Ddx6KO n=8 mice, two-way ANOVA with Bonferroni’s multiple comparisons test, mean ± s.e.m. (e) Flow cytometric analysis for the megakaryocytic differentiation markers CD41 and CD61 in HEL cells 4 d after vehicle (DMSO) or PMA treatment. Unpaired two-tailed Student’s t-test, n=3 biologically independent samples per group, mean ± s.e.m. (f) Representative IF imaging of EDC4 punctae (green) and DDX6 punctae (red) in vehicle-treated and PMA-treated HEL cells. Nuclei were counterstained with DAPI (blue). Scale: 10 μm. (g) Quantification of EDC4+DDX6+ punctae in vehicle-treated and PMA-treated HEL cells by IF. Unpaired two-tailed Student’s t-test, n=24–26 cells per group, mean ± s.e.m. (h) Representative IF imaging of LSM14A punctae (green) and DDX6 punctae (red) in vehicle-treated and PMA-treated HEL cells. Nuclei were counterstained with DAPI (blue). Scale: 10 μm. (i) Quantification of LSM14A+DDX6+ punctae in vehicle-treated and PMA-treated HEL cells by IF. Unpaired two-tailed Student’s t-test, n=25–33 cells per group, mean ± s.e.m. (j) Flow cytometric analysis for myeloid differentiation (% CD11b+) in MOLM-13 cells 5 d after treatment with the anti-leukemic drug EPZ-5676. Unpaired two-tailed Student’s t-test, n=3 biologically independent samples per group, mean ± s.e.m. (k) P-body numbers (EDC4+DDX6+ punctae) in MOLM-13 cells treated with EPZ-5676. Unpaired two-tailed Student’s t-test, n=26–30 cells per group. (l) qRT-PCR analysis of DDX6 expression in DDX6 KD MOLM-13 cells rescued with DDX6 WT or DDX6 EQ. n=3 biologically independent samples per group, mean ± s.e.m. (m) Representative IF imaging of EDC4 punctae (green) and DDX6 punctae (red) in shCTRL MOLM-13 cells with exogenous DDX6 WT and EQ expression. Nuclei were counterstained with DAPI (blue). Scale: 10 μm. (n) Representative IF imaging of LSM14A punctae (green) and DDX6 punctae (red) in shCTRL MOLM-13 cells with exogenous DDX6 WT and EQ expression. Nuclei were counterstained with DAPI (blue). (o) Quantification of LSM14A+DDX6+ punctae in shCTRL MOLM-13 cells by IF. Unpaired two-tailed Student’s t-test, n=12–13 cells per group, mean ± s.e.m. (p) Representative IF imaging of LSM14A punctae (green) and DDX6 punctae (red) in shDDX6 MOLM-13 cells with exogenous DDX6 WT and EQ expression. Nuclei were counterstained with DAPI (blue). Scale: 10 μm. (q) Quantification of LSM14A+DDX6+ punctae in shCTRL MOLM-13 cells by IF. Unpaired two-tailed Student’s t-test, n=13–33 cells per group, mean ± s.e.m.
Extended Data Fig. 6
Extended Data Fig. 6. Disrupting P-body assembly abrogates AML cell proliferation
(a) Representative intracellular flow cytometry plots showing expression of FLAG-LSM14A WT, FLAG-LSM14A ΔTFG, or FLAG-LSM14A ΔFFD in control and LSM14A KD HEL cells. (b) Representative IF imaging of EDC4 punctae (green) and DDX6 punctae (red) in control HEL cells expressing LSM14A WT, LSM14A ΔTFG, or LSM14A ΔFFD. Nuclei were counterstained with DAPI (blue). (c, d) Representative IF imaging of LSM14A punctae (green) and DDX6 punctae (red) in (c) LSM14A KD and (d) control HEL cells expressing LSM14A WT, LSM14A ΔTFG, or LSM14A ΔFFD. Nuclei were counterstained with DAPI (blue). Scale: 10 μm. (e) Quantification of LSM14A+DDX6+ punctae in the indicated cells by IF. One-way ANOVA with Dunnett’s post-hoc test, n=16–29 cells per group, mean ± s.e.m. (f) Representative intracellular flow cytometry plot showing NBDY expression (FLAG) in MOLM-13 cells. (g) Left: Representative IF imaging of LSM14A punctae (green) and FLAG (red) in control and NBDY-expressing MOLM-13 cells, scale: 10 μm. Right: quantification of LSM14A+DDX6+ punctae in control and NBDY-expressing MOLM-13 cells by IF. Unpaired two-tailed Student’s t-test, n=24 cells per group, mean ± s.e.m. (h) HEL cell numbers 13 d after forced expression of NBDY. Unpaired two-tailed Student’s t-test, n=3 biologically independent samples per group, mean ± s.e.m. (i) Representative flow cytometry plots showing loss of GFP-LSM14A+ P-bodies after DDX6 silencing. (j) Distribution of RNA biotypes within the P-bodies and cytoplasm of HEL and MOLM-13 cells. (k) Distribution of P-body-enriched, cytoplasm-enriched, and non-enriched genes within each expression quartile, which range from Q1 (low expression) to Q4 (high expression). (l) RNA-seq analysis showing counts per million (CPM) values for the indicated transcripts in the cytoplasm and P-bodies of MOLM-13 cells (n=2 biologically independent samples per group, mean). (m) Representative smFISH images of (left) POLK or (right) RSRC2 mRNA molecules (red) and GFP-LSM14A+ punctae (green). Nuclei were counterstained with DAPI (blue). Scale: 5 μm (n) Quantification of the fraction of POLK or RSCR2 transcripts colocalizing with GFP-LSM14A+ punctae in individual cells (KDM5B: n=30 cells, mean = 69.53%, RSRC2: n=31 cells, mean = 55.05%).
Extended Data Fig. 7
Extended Data Fig. 7. DDX6 sequesters translationally repressed mRNAs in P-bodies
(a) Venn diagrams showing overlap between (left) cytoplasmic mRNAs or (right) P-body-associated mRNAs (FC > 1.5, p < 0.05) in MOLM-13 cells and HEL cells. Shared P-body-enriched transcripts encoding genes with potential tumor suppressive activity are listed. (b) GO enrichment analysis for shared P-body-enriched RNAs in MOLM-13 and HEL cells (n=2042). Two-sided Fisher’s exact test. (c) Histogram of region-based FC for DDX6 eCLIP-seq read density over size-matched input (FC > 2, padj < 0.05). (d) Scatter plot indicating correlation between region-based fold enrichment of DDX6 eCLIP-seq datasets across biological replicates (n=2 biologically independent samples per group). (e) Venn diagram showing the overlap between DDX6 eCLIP-seq targets and P-body-enriched RNAs (n=2 biologically independent samples per group, FC > 2, padj < 0.05, Wald test with Benjamini-Hochberg correction) in MOLM-13 cells. (f) GO pathway enrichment analysis of DDX6-bound, P-body-enriched RNAs (n=589) identified in (e). Two-tailed Fisher’s exact test. (g, h) Scatter plots showing lack of correlation between P-body enrichment and expression for transcripts upregulated in DDX6 KD (g) MOLM-13 or (h) HEL cells. (i) GC content and length distribution for P-body-enriched vs cytosolic mRNAs. (j) Cumulative distribution function (CDF) plot showing translation rate (log2 FC) of P-body enriched and P-body-depleted mRNAs for shDDX6 vs. shCTRL cells. Two-sided Mann–Whitney U test. (k) Dynamic changes in small RNA distribution in MOLM-13 cells following DDX6 suppression (n=2 biologically independent samples per group). (l) Heatmap showing expression levels of selected tsRNAs in control vs DDX6 depleted MOLM-13 cells (n=2 biologically independent samples per group).
Extended Data Fig. 8
Extended Data Fig. 8. Genome topology rewiring following DDX6 depletion
(a) Correlation heatmap showing the correlation (r) values between proteomic samples (n=3). Scale bar represents the range of the correlation coefficients (r) displayed. (b) Heatmap for differentially expressed proteins exhibiting a 1.5-fold or greater difference between control and DDX6 KD MOLM-13 cells (n=3). (c) Gene ontology analysis of upregulated and downregulated proteins (FC > 1.5; p < 0.05, Wald test with Benjamini-Hochberg correction) in shDDX6 compared to shCTRL MOLM-13 cells. (d) Heatmap showing downregulation of P-body-related proteins in DDX6 KD MOLM-13 cells (n=3 biologically independent samples per group). (e) Representative Western blots showing loss of P-body-related proteins upon DDX6 loss in DDX6-FKBP12F36V MOLM-13 cells. n=3 independent experiments. (f, g) qRT-PCR validation of tumor suppressor gene overexpression in MOLM-13 cells. (n=3). (h) Total number of ATAC-seq peaks detected in control and DDX6 KD (left) MOLM-13 or (right) HEL cells. (i) Genomic distribution of ATAC-seq peaks in control and DDX6 KD HEL and MOLM-13 cells. (j) Scatter plot showing ATAC-seq data for shCTRL and shDDX6 HEL cells (n=2 biologically independent samples per group). Blue dots indicate genomic regions showing significantly decreased chromatin accessibility in DDX6-depleted cells (FC > 1.5, p < 0.05, Wald test with Benjamini-Hochberg correction; n=570); red dots indicate genomic regions showing significantly increased chromatin accessibility in DDX6-depleted cells (FC > 1.5, p < 0.05; n=1044). (k) TF motif enrichment analysis on shDDX6 gained and lost ATAC-seq peaks in HEL cells. (l) Increased H3K4me1 levels at loci of genes that gained chromatin accessibility and became upregulated after DDX6 KD. Wilcoxon rank-sum test, shCTRL open (n=2026), shDDX6 open (n=2045), shCTRL closed (n=1024), shDDX6 closed (n=1035). Box center line indicates median, box limits indicate upper (Q3) and lower quartiles (Q1), lower whisker is Q1 − 1.5 × IQR and upper whisker is Q3 + 1.5 × IQR. (m) Total number of promoter interactions detected by liCHi-C in control (n=2) and DDX6 KD (n=2) MOLM-13 cells. (n) Gene tracks of ATAC-seq, RNA-seq, H3K27ac CUT&Tag, and liCHi-C data for the genomic region surrounding AGO4. Blue shadow highlights the gene promoter. Arcs represent significant promoter interactions (CHiCAGO score > 5). (o) Representative intracellular flow cytometry plot for KDM5B in control and KDM5B knockout MOLM-13 cells.
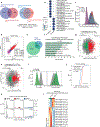
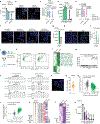
Figure 1.
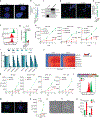
Figure 1.. P-body regulators are AML dependencies.
(a) Comparative analysis of genome-wide CRISPR/Cas9 dropout screens in normal hematopoietic progenitor cells (HPC7 Cas9) and CebpaN-mutant/C-mutant leukemia cells (CNC Cas9). Axes show enrichment/depletion as log2 fold change (FC). Blue dots represent genes that selectively impair (log2FC < −0.5) CNC Cas9 cell proliferation. Gray dots represent all other genes. (b) GO biological processes and cellular components enrichment analyses of genes identified as specific dependencies of murine leukemia cells. Two-tailed Fisher’s exact test. (c) mRNA expression of P-body-related genes in AML compared to normal tissue, based on data from the TCGA database. Data are presented as mean log2 expression with range. (d) Representative immunofluorescence (IF) imaging of EDC4 (green) and DDX6 (red) punctae in primary CD34+ cells and AML patient cells. Nuclei were counterstained with DAPI (blue). Scale: 10 μm. (e) Quantification of EDC4+DDX6+ punctae in two primary CD34+ samples and four AML patient samples by IF. CD34+ #1 (n=20 cells), CD34+ #2 (n=28 cells) AML #1 (n=50 cells), AML #2 (n=42 cells), AML #3 (n=66 cells), AML #4 (n=22 cells), one-way ANOVA with Dunnett’s post-hoc correction, mean ± s.e.m, (f) Representative IF imaging of EDC4 (green) and DDX6 (red) punctae in control and DDX6 KD MOLM-13 cells. Nuclei were counterstained with DAPI (blue). Scale: 10 μm. (g) Quantification of EDC4+DDX6+ punctae in control and DDX6 KD MOLM-13 cells by IF. Unpaired two-tailed Student’s t-test, n=24–30 cells per group, mean ± s.e.m. (h) Proliferation assay for shCTRL and shDDX6 MOLM-13 cells at the indicated time points after transduction. Two-way ANOVA with Dunnett’s post-hoc test, n=3 biologically independent samples, mean ± s.e.m. (i) Flow cytometric analysis of myeloid differentiation in MOLM-13 cells 7 d after DDX6 silencing (CD68 and CD123 MFI). Unpaired two-tailed Student’s t-test, n=3 biologically independent samples, mean ± s.e.m. (j) Heatmap of RNA-seq data for shCTRL and shDDX6 MOLM-13 cells (n=2 biologically independent samples, FC > 1.5; p < 0.05, Wald test with Benjamini-Hochberg correction). Upregulated genes are depicted in red, while in blue are downregulated genes. (k) GO enrichment analysis of differentially expressed genes in control vs. DDX6 KD MOLM-13 cells. Two-tailed Fisher’s exact test. (l) Representative IF imaging of EDC4 (green) and DDX6 (red) punctae in control, LSM14A and EIF4ENIF1 KD MOLM-13 cells. Nuclei were counterstained with DAPI (blue). Scale: 10 μm. (m) Quantification of EDC4+DDX6+ punctae in control, LSM14A and EIF4ENIF1 KD MOLM-13 cells by IF. Unpaired two-tailed Student’s t-test, n=17–31 cells per group, mean ± s.e.m. (n) Cell numbers 9 d after shRNA-mediated silencing of LSM14A and EIF4ENIF1 in MOLM-13 cells. Unpaired two-tailed Student’s t-test, n=3 biologically independent samples, mean ± s.e.m. (o) Schematic showing homozygous insertion of FKBP12F36V-HA-P2A-mCherry sequence into the stop codon of the endogenous DDX6 allele of Cas9-expressing MOLM-13 cells (upper panel). Representative Western blot showing HA-tagged endogenous DDX6 protein levels in DDX6-FKBP12F36V MOLM-13 cells at the indicated timepoints following dTAG-13 treatment (lower panel). n=3 independent experiments. (p) Proliferation of DDX6-FKBP12F36V MOLM-13 cells cultured in the presence of the indicated concentrations of dTAG-13 for 5 d. n=3 biologically independent samples, mean ± s.e.m. (q) Schematic of dTAG-13 administration and washout for DDX6-FKBP12F36V MOLM-13 cells. Briefly, DDX6-FKBP12F36V MOLM-13 cells, were either vehicle-treated (DMSO), continuously treated with 1 μM dTAG-13, or treated with 1 μM dTAG-13 for 2, 5, or 6 days, followed by washout and culture. (r) Proliferation of DDX6-FKBP12F36V MOLM-13 cells treated as in (q), n=3 biologically independent samples, mean ± s.e.m.
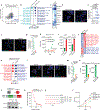
Figure 2.
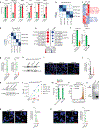
Figure 2.. DDX6 is crucial for human and mouse AML progression in vivo.
(a) NSG mice were injected with sgCTRL or sgDDX6 CRISPRi HEL cells and placed on a doxycycline (DOX) diet 7 d later. (b) Kaplan-Meier survival curves of NSG mice transplanted as in (a) are shown. Mantel-Cox test, sgCTRL n=5 mice, sgDDX6 n=6 mice. (c) NSG mice were injected with shCTRL or shDDX6 MOLM-13 AML cells. (d) Kaplan-Meier survival curves of NSG mice transplanted with shCTRL or shDDX6 MOLM-13 cells. Mantel-Cox test, shCTRL n=6 mice, shDDX6 n=7 mice. (e) NSG mice were injected with shCTRL or shDDX6 patient primary AML cells. (f, g) Percentages of control or DDX6 KD AML cells in the indicated organs of NSG mice at 60 d post-transplant, quantified by flow cytometry. Unpaired two-tailed Student’s t-test, n=3 mice per group, mean ± s.d. (h) Schematic of the Ddx6fl/fl transgenic mice and breeding strategy. (i) Representative Western blot analysis for DDX6 in c-Kit+ hematopoietic progenitor cells. n=3 independent experiments. (j) c-Kit+ bone marrow cells from Mx1-Cre or Mx1-Cre/Ddx6fl/fl mice were transduced with MLL-AF9 and transplanted into WT recipient mice, followed by poly(I:C) treatment 3 weeks later. (k) Percentages of transduced CD45+ cells (GFP+) in the indicated organs at 90 d post-transplantation. Unpaired two-tailed Student’s t-test, Ddx6WT n=4 mice, Ddx6KO n=6 mice, mean ± s.e.m. (l) c-Kit+ bone marrow cells from Rosa26-Cre or Rosa26-Cre/Ddx6fl/fl mice were transduced with AML1-ETO9a and transplanted into WT recipient mice, followed by tamoxifen treatment 3 weeks later. (m) Percentages of transduced CD45+ cells (mCherry+) in the indicated organs at 48 d post-transplantation. Unpaired two-tailed Student’s t-test, Ddx6WT n=5, Ddx6KO n=5 mice per group, mean ± s.e.m. (n) Colony-forming assay of Ddx6WT and Ddx6KO (left) normal c-Kit+ HSPCs or (right) AML1-ETO9a+ leukemic cells. Cells were plated 2 d after 4-hydroxytamoxifen treatment and colony-forming units (CFUs) were counted 7 d later. Unpaired two-tailed Student’s t-test, n=3 biologically independent samples, mean ± s.e.m.
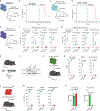
Figure 3.
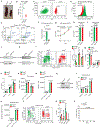
Figure 3.. DDX6 plays a minor role during homeostatic hematopoiesis but is important for regenerative hematopoiesis.
(a) Proliferation assay for shCTRL and shDDX6 human CD34+ primary HSPCs at the indicated timepoints after transduction. Unpaired two-tailed Student’s t-test, n=3 biologically independent samples per group, mean ± s.d. (b) Colony-forming assay of shCTRL and shDDX6 human bone marrow-derived CD34+ cells. Colony-forming units (CFUs) were counted 13 d after seeding. Unpaired two-tailed Student’s t-test, n=3 biologically independent samples per group, mean ± s.e.m. (c, d) Proliferation assay for shCTRL, shLSM14A (c), and shEIF4ENIF1 (d) human CD34+ primary HSPCs at the indicated timepoints after transduction. Unpaired two-tailed Student’s t-test, n=3 biologically independent samples per group, mean ± s.d. (e, f) Absolute numbers of nucleated cells in the (e) spleen and (f) bone marrow of Mx1-Cre and Mx1-Cre/Ddx6fl/fl mice 110 d after Ddx6 deletion. Unpaired two-tailed Student’s t-test, Ddx6WT n=5 mice, Ddx6KO n=5 mice, mean ± s.e.m.. (g) Representative flow cytometry plots showing percentages of Linc-Kit+Sca-1+ (LSK) cells and Linc-Kit+Sca-1 (LK) cells in the bone marrow of Mx1-Cre and Mx1-Cre/Ddx6fl/fl mice 110 d after Ddx6 deletion. (h) Frequency of LSK cells in the bone marrow. Unpaired two-tailed Student’s t-test, Ddx6WT n=5 mice, Ddx6KO n=5 mice, mean ± s.e.m. (i) Representative flow cytometry plots showing percentages of HSC, MPP1, MPP2, and MPP4 populations, gated on LSK cells, in the bone marrow of Mx1-Cre and Mx1-Cre/Ddx6fl/fl mice 110 d after Ddx6 deletion. (j) Quantification of HSC, MPP1, MPP2, and MPP4 populations, as a percentage of LSK cells, in the bone marrow of Mx1-Cre and Mx1-Cre/Ddx6fl/fl mice 110 d after Ddx6 deletion. Unpaired two-tailed Student’s t-test, Ddx6WT n=5 mice, Ddx6KO n=5 mice, mean ± s.e.m. (k) Quantification of B cells (CD19+), T cells (CD3+), and myeloid cells (CD11b+) as a percentage of CD45+ cells in the peripheral blood of Mx1-Cre and Mx1-Cre/Ddx6fl/fl mice at the indicated timepoints after Ddx6 deletion. Ddx6WT n=5 mice, Ddx6KO n=5 mice, two-way ANOVA with Bonferroni’s multiple comparisons test, mean ± s.d. (l) Ddx6WT and Ddx6KO HSC, MPP1, MPP2, and MPP4 populations were sorted 24 d after Ddx6 deletion and subjected to RNA-seq. Principal component analysis (PCA) of all replicates of all populations is shown. (m) GO analysis showing enrichment of indicated gene categories in genes upregulated in each Ddx6KO population, relative to its Ddx6WT counterpart. Two-tailed Fisher’s exact test. (n) Representative flow cytometry plots and quantification of percentages of Ki-67+ cells in Ddx6WT and Ddx6KO HSCs, 24 d after Ddx6 deletion. Unpaired two-tailed Student’s t-test, n=3 mice per group, mean ± s.e.m. (o) MFI quantification of MitoTracker Green FM and TMRM staining in Ddx6WT and Ddx6KO HSCs, 24 d after Ddx6 deletion. Unpaired two-tailed Student’s t-test, n=3 mice per group, mean ± s.e.m. (p) Quantification of Ddx6WT and Ddx6KO chimerism within donor LSKs and LSK subpopulations in the bone marrow, 187 d after primary competitive transplantation. Unpaired two-tailed Student’s t-test, n=5 mice per group, mean ± s.e.m. (q) Quantification of Ddx6WT and Ddx6KO chimerism within donor myeloid, T cell, and B cell populations in the peripheral blood, at the indicated timepoints after primary competitive transplantation. Unpaired two-tailed Student’s t-test, n=5 mice per group, mean ± s.e.m. (r) Quantification of Ddx6WT and Ddx6KO chimerism within the donor hematopoietic compartment (CD45+) in peripheral blood, bone marrow, and spleen, 63 d after secondary competitive transplantation. Unpaired two-tailed Student’s t-test, n=5 mice per group, mean ± s.e.m.
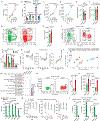
Figure 4.
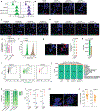
Figure 4.. P-bodies sequester translationally repressed mRNAs encoding key tumor suppressors.
(a) DDX6 KD MOLM-13 cell numbers after rescue with DDX6 WT or DDX6 EQ. One-way ANOVA with Dunnett’s post-hoc test, n=3 biologically independent samples per group, mean ± s.e.m. (b) Representative IF imaging of EDC4 punctae (green) and DDX6 punctae (red) in DDX6 KD MOLM-13 cells after rescue with DDX6 WT or DDX6 EQ. Nuclei were counterstained with DAPI (blue). Scale: 5 μm. (c) Quantification of EDC4+DDX6+ punctae in the indicated cells by IF. One-way ANOVA with Dunnett’s post-hoc test, n=29–40 cells per group, mean ± s.e.m.. (d) LSM14A KD HEL cell numbers after rescue with LSM14A WT, LSM14A ΔTFG, or LSM14A ΔFFD. One-way ANOVA with Dunnett’s post-hoc test, n=3 biologically independent samples per groups, mean ± s.e.m.. (e) Quantification of EDC4+DDX6+ punctae in the indicated cells by IF. One-way ANOVA with Dunnett’s post-hoc test, n=15–36 cells per group, mean ± s.e.m.. (f) Representative IF imaging of EDC4 punctae (green) and DDX6 punctae (red) in LSM14A KD HEL cells after rescue with LSM14A WT, LSM14A ΔTFG, or LSM14A ΔFFD. Nuclei were counterstained with DAPI (blue). Scale: 5 μm. (g) MOLM-13 cell numbers 13 d after forced expression of NBDY. Unpaired two-tailed Student’s t-test, n=3 biologically independent samples per group, mean ± s.e.m. (h) Representative IF imaging of EDC4 punctae (red) and FLAG (green) in control and NBDY-expressing MOLM-13 cells. Nuclei were counterstained with DAPI (blue). Scale: 5 μm. (i) Quantification of EDC4+ punctae in the indicated cells by IF. Unpaired two-tailed Student’s t-test, n=59–129 cells per group, mean ± s.e.m. (j) Schematic for the purification and transcriptomic profiling of P-bodies from MOLM-13 cells based on the expression of GFP-LSM14A+. (k) Representative flow cytometry plots showing gating for GFP-LSM14A+ P-bodies in MOLM-13 cells. (l) Heatmap showing expression levels of differentially enriched mRNAs between purified P-body and cytoplasmic fractions in MOLM-13 cells (n=2 biologically independent samples per group), FC > 1.5, p < 0.05, Wald test with Benjamini-Hochberg correction. Highlighted in green, putative tumor suppressors, transcription factors, and chromatin factors. (m) GSEA plot showing enrichment of a tumor suppressor gene signature in P-bodies versus cytoplasmic fractions of MOLM-13 cells. NES = 1.26, p = 0.0038. (n) Gene tracks of RNA-seq data showing individual mRNAs enriched in P-bodies or cytoplasm of MOLM-13 cells. (o) Representative smFISH images of KDM5B mRNA molecules (red) and GFP-LSM14A+ punctae (green). Nuclei were counterstained with DAPI (blue). Scale bar: 5 μm. (p) Quantification of the fraction of KDM5B mRNA transcripts colocalizing with GFP-LSM14A+ punctae in individual cells (n=33, mean: 48.98%). (q) Ribosome density negatively correlates with mRNA enrichment in P-bodies in MOLM-13 cells. Polysome profiling data from GSE20222776. (r) Translation rate fold changes following P-body dissolution (shDDX6) positively correlated with mRNA enrichment in P-bodies. (s) Left: Balloon plot showing TargetScan miRNA enrichment analysis for miRNA binding within P-body enriched mRNAs that change translation level. Right: Heatmap showing expression levels of miRNAs (small RNA-seq) identified by TargetScan in control vs DDX6 KD MOLM-13 cells (n=2 biologically independent samples per group). (t) Heatmap of protein expression for tumor suppressors in CTRL and DDX6 KD MOLM-13 cells that increase in both translation and protein levels upon DDX6 silencing (n=3). (u) Cell numbers 6 d after lentivirus-mediated overexpression of the indicated genes in MOLM-13 cells. Unpaired two-tailed Student’s t-test, n=3 biologically independent samples per group, mean ± s.e.m.
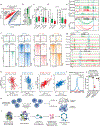
Figure 5.
Figure 5.. Loss of DDX6 impacts the chromatin architecture of AML cells.
(a) Scatterplot showing ATAC-seq analysis of chromatin accessibility for shCTRL (n=2) and shDDX6 (n=2) MOLM-13 cells. Blue dots indicate genomic regions showing significantly decreased chromatin accessibility in DDX6-depleted cells (FC > 1.5, p < 0.05, n=1222); red dots indicate genomic regions showing significantly increased chromatin accessibility in DDX6-depleted cells (FC > 1.5, p < 0.05, n=2345). (b) TF motif enrichment on shDDX6 gained and lost ATAC-seq peaks. (c) Boxplots showing H3K27ac levels (RPKM) at loci of genes that gained or lost chromatin accessibility after DDX6 KD. Wilcoxon rank-sum test, shCTRL open (n=1974), shDDX6 open (n=2039), shCTRL closed (n=1041), shDDX6 closed (n=1075). Box center line indicates median, box limits indicate upper (Q3) and lower quartiles (Q1), lower whisker is Q1 − 1.5 × interquartile range (IQR) and upper whisker is Q3 + 1.5 × IQR. (d) (Left) Low-input Promoter Capture Hi-C (liCHi-C) results showing loss of looping interactions and (right) average distance of interactions at promoters of genes with significantly decreased chromatin accessibility and expression following DDX6 knockdown. Unpaired two-tailed Student’s t-test, n=28 per group. Box center line indicates median, box limits indicate upper (Q3) and lower quartiles (Q1), lower whisker is Q1 − 1.5 × IQR and upper whisker is Q3 + 1.5 × IQR. (e) Gene tracks of ATAC-seq, RNA-seq, H3K27ac CUT&RUN, and liCHi-C data for the genomic region surrounding ZNF785. Blue shadow highlights the gene promoter. Arcs represent significant promoter interactions (CHiCAGO score > 5). (f) Bottom: Genomic heatmaps (CUT&Tag) showing gain and loss of peaks for the indicated histone modifications in control versus DDX6 KD HL-60 cells. Top: average plot showing CUT&Tag signal at the genomic heatmaps (bottom) in control versus DDX6 KD HL-60 cells (g) Gene tracks of RNA-seq and CUT&Tag data for the indicated histone modifications for the genomic regions surrounding (top) ZNF770 and (bottom) IRF8. Blue shadow highlights the gene promoter. (h) Scatter plots showing correlations in histone marks dynamics for all regions (gray dots and lines), regions associated with upregulated genes (red dots and lines) or regions associated with downregulated genes (blue dots and lines) in DDX6 KD MOLM-13 cells. Correlation coefficients and the corresponding p-values are shown. (i) Average plot showing KDM5B enrichment at differentially accessible regions (DARs) as defined by ATAC-seq in (a). KDM5B ChIP-seq data was taken from (GSM1003586). (j) Competition-based proliferation assays upon DDX6 and KDM5B double knockout in AML cells. Unpaired two-tailed Student’s t-test, n=3 biologically independent samples per group, mean ± s.e.m. (k) Model summarizing the phenotypic consequences of losing P-body-targeted RNA sequestration in AML cells. (l) A mechanistic model proposing how the interplay between RNA sequestration in P-bodies and chromatin architecture impacts AML.

References

    1. van Galen P et al. Single-Cell RNA-Seq Reveals AML Hierarchies Relevant to Disease Progression and Immunity. Cell 176, 1265–1281 e1224 (2019). - PMC - PubMed
    1. Fabbri L, Chakraborty A, Robert C & Vagner S The plasticity of mRNA translation during cancer progression and therapy resistance. Nat Rev Cancer 21, 558–577 (2021). - PubMed
    1. Buxbaum AR, Haimovich G & Singer RH In the right place at the right time: visualizing and understanding mRNA localization. Nat Rev Mol Cell Biol 16, 95–109 (2015). - PMC - PubMed
    1. Roden C & Gladfelter AS RNA contributions to the form and function of biomolecular condensates. Nature reviews. Molecular cell biology 22, 183–195 (2021). - PMC - PubMed
    1. Sheth U & Parker R Decapping and decay of messenger RNA occur in cytoplasmic processing bodies. Science 300, 805–808 (2003). - PMC - PubMed

METHODS-ONLY REFERENCES

    1. Zhao M, Kim P, Mitra R, Zhao J & Zhao Z TSGene 2.0: an updated literature-based knowledgebase for tumor suppressor genes. Nucleic Acids Res 44, D1023–1031 (2016). - PMC - PubMed
    1. Park HJ et al. Therapeutic resistance in acute myeloid leukemia cells is mediated by a novel ATM/mTOR pathway regulating oxidative phosphorylation. Elife 11 (2022). - PMC - PubMed
    1. Pinto do OP, Kolterud A & Carlsson L Expression of the LIM-homeobox gene LH2 generates immortalized steel factor-dependent multipotent hematopoietic precursors. EMBO J 17, 5744–5756 (1998). - PMC - PubMed
    1. Michlits G et al. Multilayered VBC score predicts sgRNAs that efficiently generate loss-of-function alleles. Nat Methods 17, 708–716 (2020). - PubMed
    1. Schmoellerl J et al. EVI1 drives leukemogenesis through aberrant ERG activation. Blood (2022). - PubMed