. 2024 Nov;30(11):3173-3183.
doi: 10.1038/s41591-024-03167-4. Epub 2024 Aug 21.

Molecular classification to refine surgical and radiotherapeutic decision-making in meningioma

Collaborators, Affiliations

Molecular classification to refine surgical and radiotherapeutic decision-making in meningioma

Justin Z Wang et al. Nat Med. 2024 Nov.

Abstract

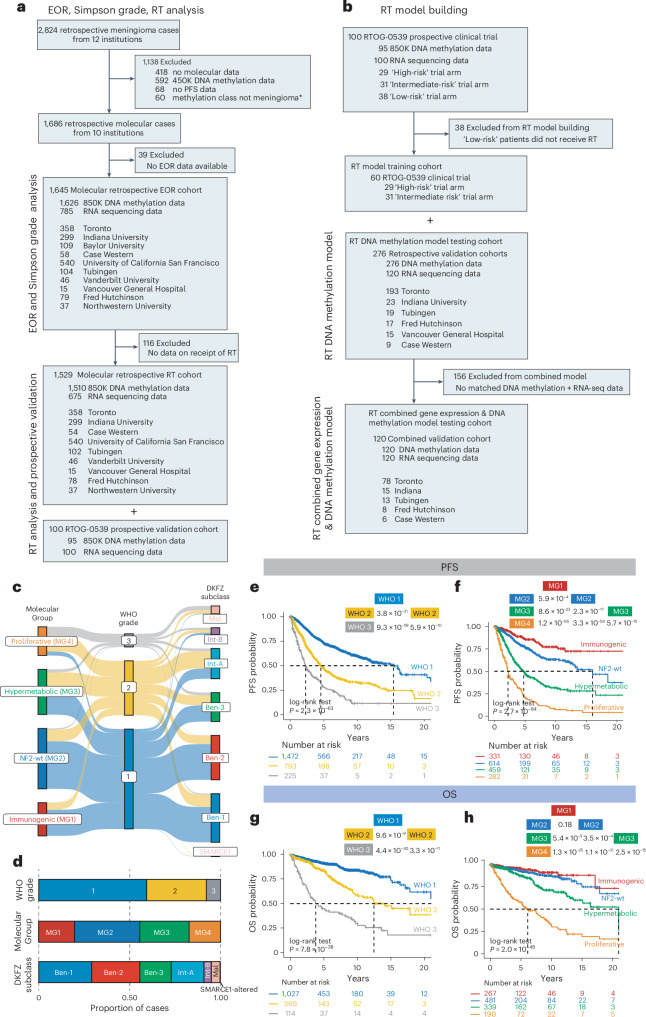
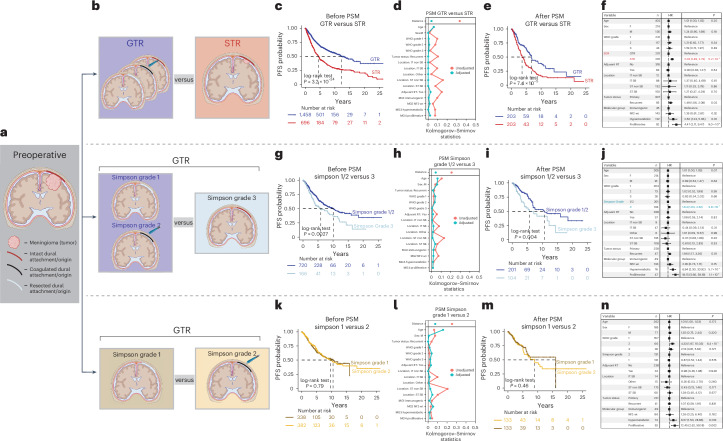
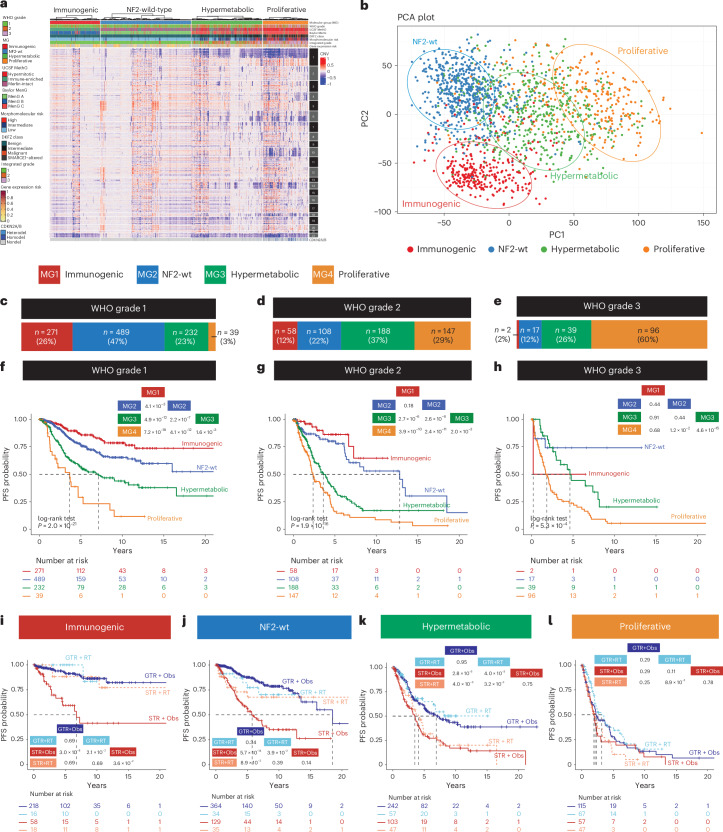
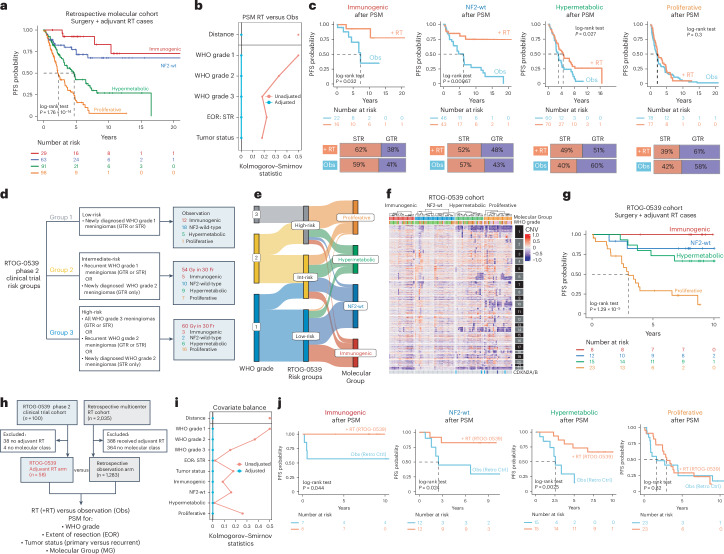
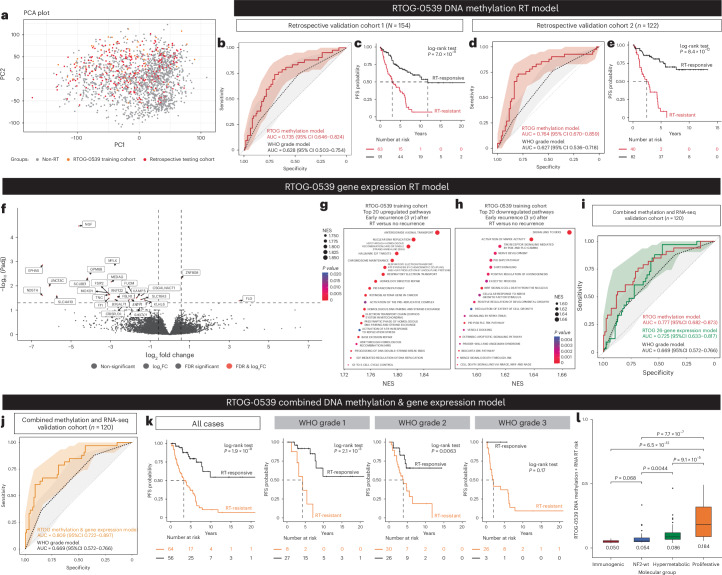
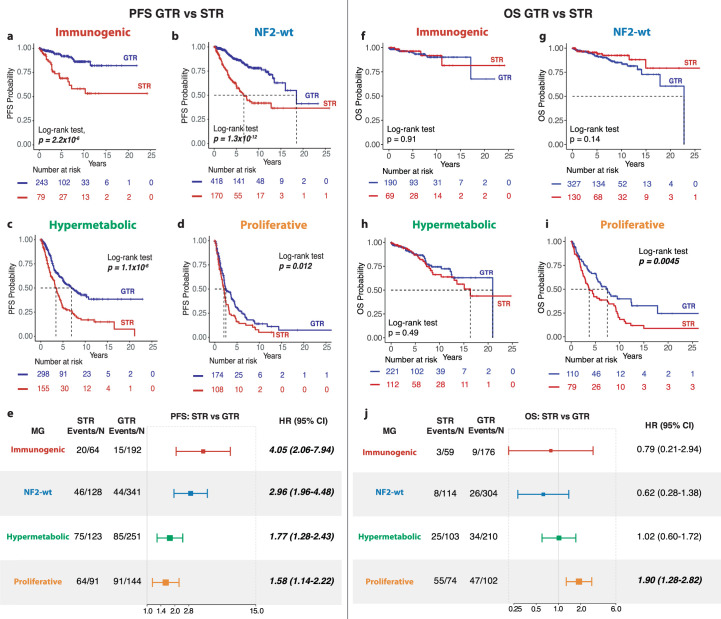
Treatment of the tumor and dural margin with surgery and sometimes radiation are cornerstones of therapy for meningioma. Molecular classifications have provided insights into the biology of disease; however, response to treatment remains heterogeneous. In this study, we used retrospective data on 2,824 meningiomas, including molecular data on 1,686 tumors and 100 prospective meningiomas, from the RTOG-0539 phase 2 trial to define molecular biomarkers of treatment response. Using propensity score matching, we found that gross tumor resection was associated with longer progression-free survival (PFS) across all molecular groups and longer overall survival in proliferative meningiomas. Dural margin treatment (Simpson grade 1/2) prolonged PFS compared to no treatment (Simpson grade 3). Molecular group classification predicted response to radiotherapy, including in the RTOG-0539 cohort. We subsequently developed a molecular model to predict response to radiotherapy that discriminates outcome better than standard-of-care classification. This study highlights the potential for molecular profiling to refine surgical and radiotherapy decision-making.


Conflict of interest statement

Competing interests S.Y. is a member of advisory boards and has received honoraria from AstraZeneca, Amgen, Bayer, Janssen, Pfizer, Roche and Servier. The remaining authors declare no competing interests.

Figures

Fig. 1
Fig. 1. Meningioma cohort stratified based on molecular classification and the role of EOR.
a,b, CONSORT diagram demonstrating the cohort of meningiomas used in this study, the sequence of analyses and results presented and the respective institutions from where these samples were obtained for our EOR, Simpson grade, and RT analyses (a) and for RT model building (b). c,d, Sankey plot (c) and bar plots (d) showing the relationship of WHO grading with molecular classifications (Molecular Group (MG) for primary analysis and DKFZ methylation subclass to confirm the molecular diagnosis of meningioma). e,f, Kaplan–Meier survival curves showing PFS of meningiomas based on WHO grade (e) and MG (f). gh, OS of meningiomas used in our study based on classification by WHO grade (g) and MG (h). Inset shows the P values from the pairwise log-rank test between groups with Benjamini–Hochberg correction for multiple comparisons.
Fig. 2
Fig. 2. Propensity score matched analysis of degrees of surgical resection in meningioma.
a, Schematic of a meningioma and its dural attachments/origin preoperatively, with legend indicating different methods of dural margin treatment (Simpson grades 1–3). b, Schematic of treatment arms being compared in PSM analyses: GTR versus STR (above), Simpson grades 1/2 versus grade 3 (middle) and Simpson grade 1 versus grade 2 (below). cf, Kaplan–Meier survival plot of PFS before PSM (c) and covariate balance before PSM (unadjusted) and after PSM (adjusted) (d); Kaplan–Meier survival plot of PFS after PSM (e); and results of multivariable Cox regression model of PFS for GTR versus STR comparison (f). gj, Kaplan–Meier survival plot of PFS before PSM (g); covariate balance before PSM (unadjusted) and after PSM (adjusted) (h); Kaplan–Meier survival plot of PFS after PSM (i); and results of multivariable Cox regression model of PFS for Simpson grade 1/2 versus grade 3 comparison (j). kn, Kaplan–Meier survival plot of PFS before PSM (k); covariate balance before PSM (unadjusted) and after PSM (adjusted) (l); Kaplan–Meier survival plot of PFS after PSM (m); and results of multivariable Cox regression model of PFS for Simpson grade 1 versus grade 2 comparison (n). Horizontal error bars in the forest plots of f, j and n represent the 95% CI of the HRs for each of the covariates included in the multivariable Cox regressions. P values for each covariate in the multivariable Cox regression were derived from Waldʼs test (two-tailed) without adjustments for multiple comparisons. Panels a and b were created with BioRender.
Fig. 3
Fig. 3. Resolution of heterogeneity in outcomes using Molecular Group classification within WHO grades.
a, Heatmap of CNVs organized by chromosome number (vertical) and Molecular Group (MG) (horizontal) called by DNA methylation in the complete cohort of retrospective meningioma cases with available DNA methylation data. b, Principal component analysis (PCA) of all meningiomas based on DNA methylation, colored and circled by their respective MG. ce, Molecular reclassification of meningiomas into each of the four MGs, including the proportion of cases within each respective WHO grade belonging to each MG. fh, PFS outcomes stratified by MG of meningiomas within each WHO grade: WHO grade 1 (f), grade 2 (g) and grade 3 (h). il, PFS outcomes stratified by EOR in molecularly defined Immunogenic (i), NF2-wt (j), Hypermetabolic (k) and Proliferative (l) meningioma cases, with PFS groups stratified based on treatment modality (EOR and receipt of adjuvant RT). Inset shows the P values from the pairwise log-rank test between groups with Benjamini–Hochberg correction for multiple comparisons. PC, principal component.
Fig. 4
Fig. 4. Using Molecular Group to predict response to adjuvant RT in meningiomas after surgery.
a, PFS of cases in the retrospective molecular meningioma cohort that received adjuvant RT after surgery stratified by Molecular Group. b, Covariate balance before PSM (unadjusted) and after PSM (adjusted) for meningiomas treated with adjuvant RT (+RT) versus observation (Obs) after surgery. c, Above, PFS of the PSM retrospective cohort comparing meningiomas that received adjuvant RT (+RT) after surgery to those that were observed (Obs) in each respective Molecular Group; below, the proportion of these matched cases that received GTR and STR in each Molecular Group. d,e, Molecular cohort of RTOG-0539 clinical trial cases used as a validation cohort here, including their originally defined risk groups and their reclassification into Molecular Groups after molecular profiling. f, Genome-wide chromosomal arm-level copy number alterations called based on DNA methylation of molecularly profiled RTOG-0539 cases organized by Molecular Group. g, PFS of meningiomas from the RTOG-0539 trial that received adjuvant RT after surgery (defined as the original ‘intermediate-risk’ and ‘high-risk’ treatment arms of the trial) stratified based on Molecular Group. h, Schematic of separate PSM analysis mimicking a randomized controlled trial with the RT arm composed entirely of RT-treated meningiomas from the prospective RTOG-0539 cohort and the control/observation arm composed of retrospective meningioma cases that did not receive adjuvant RT after surgery. i, Covariate balance before and after the PSM schema outlined in k. j, PFS analysis of PSM meningioma cohort stratified based on receipt of adjuvant RT (+RT; comprising only cases from the RTOG-0539 trial) versus observation (Obs; non-RTOG-0539 cases only) in each Molecular Group.
Fig. 5
Fig. 5. RT biomarker discovery using the RTOG-0539 clinical trial meningiomas.
a, Principal component analyis (PCA) based on DNA methylation of meningiomas colored for model training (RTOG-0539 cohort) and model testing/validation (retrospective cohort). b,d, Area under the receiver operating characteristic curve (AUC ROC) and its 95% CI (shaded) for predicting 3-year PFS after RT for the RT DNA methylation model in the first (b) and second (d) retrospective validation cohorts compared to a WHO grade model. c,e, PFS after RT for meningiomas in the first (c) and second (e) retrospective validation cohort stratified based on RT DNA methylation risk score (high-risk and low-risk). f, Differential gene expression analysis on RT-treated cases in the RTOG-0539 cohort that recurred early (≤3 years; n = 16) versus cases that remained stable (n = 46). Labeled 26 genes met the cutoff of FDR-adjusted P < 0.05 (Waldʼs test with Benjamini–Hochberg adjustment) and |logFC| > 0.57 and were used for gene expression model building. g,h, The top 20 upregulated (g) and downregulated (h) gene expression pathways in the progressive RTOG-0539 meningiomas after GSEA. Unadjusted P values were obtained from permutation testing. i, AUC ROC and its 95% CI (shaded) for the prediction of 3-year PFS after RT for the RT gene expression model compared to the RT DNA methylation model and a WHO grade model tested in the combined retrospective validation cohort with matched DNA methylation and RNA-seq data. j, AUC ROC and its 95% CI (shaded) for predicting 3-year PFS after RT for the combined RT DNA methylation and gene expression model compared to a WHO grade model tested in the same cohort. k, PFS of meningiomas in the combined validation cohort dichotomized into an RT-resistant and an RT-responsive group based on combined DNA methylation and gene expression risk scores and stratified across WHO grade. l, Distribution of predicted risk scores across Molecular Group (Immunogenic n = 18; NF2-wt n = 23; Hypermetabolic n = 45; Proliferative n = 34) generated by the combined DNA methylation and gene expression model. For all box plots, the center line shows the median risk score (annotated on the plot); the box limits are the interquartile range (IQR); and whiskers show the range of data (Q1 −1.5× IQR, Q3 +1.5× IQR), with additional points as outliers. P values here were obtained from two-tailed Wilcoxon rank-sum test for pairwise comparison of means between groups. NES, normalized enrichment score; PC, principal component; yr, years.
Extended Data Fig. 1
Extended Data Fig. 1. Copy number variation (CNV) plot in each molecular cohort.
CNVs were derived based on inference from DNA methylation data organized based on molecular group (MG) assignment and by institution, including publicly available datasets utilized as well as the prospective RTOG-0539 clinical trial cohort.
Extended Data Fig. 2
Extended Data Fig. 2. Reclassification of meningiomas into different previously published molecular classifications and integrated prognostic systems.
a. Heatmap of cases with matched DNA methylation and RNA sequencing on the same meningioma utilized for outcome prediction and generation of Brier error curves b. Brier error curves over time for prediction of PFS at 5-years in the complete molecular cohort with matched DNA methylation and RNA-sequencing data demonstrating that Molecular Group (MG) had the lowest Brier error across multiple different molecular classifications and prognostic systems with integrated molecular features. Integrated Brier score or cumulative prediction error/cumulative rank probability score for each molecular classification and prognostic system are listed in the parentheses. (c-e) Sankey diagrams showing the distribution of cases from each WHO Grade and MG into the DKFZ methylation subclasses (c), the UCSF Methylation Groups (MethG) (d), and the Baylor Meningioma Groups (MenG) (e). (f-h) Kaplan-Meier (KM) survival curves of PFS based on cases classified into the DKFZ methylation subclasses (f), MethG (g) and MenG (h). (i-k) KM survival curve of OS based on cases classified into the DKFZ methylation subclasses (i), MethG (j) and MenG (k). (l-n) Sankey diagram showing the distribution of cases from each WHO Grade and MG stratified into Integrated Grade (l), Morphomolecular Risk (m), and Gene Expression Risk groups (n). (o-q) KM survival curves of PFS based on cases stratified by Integrated Grade (o), Morphomolecular Risk (p), and Gene Expression Risk Group (q). (r-t) KM survival curve of OS stratified by Integrated Grade (r), Morphomolecular Risk (s), and Gene Expression Risk Group (t). Insets shows the P values obtained from the pairwise log-rank test between groups with Benjamini–Hochberg correction for multiple comparisons.
Extended Data Fig. 3
Extended Data Fig. 3. Benefits of extent of surgical resection (EOR) across Molecular Groups (MG).
(a-b) Kaplan-Meier (KM) survival curve showing PFS of meningiomas that received a GTR vs STR belonging to the following MG: Immunogenic (a), NF2-wildtype (b), Hypermetabolic (c), Proliferative (d). e. Results of the multivariable Cox regression analysis assessing the PFS benefits of EOR while controlling for age, sex, WHO grade, primary/recurrent tumor status, and receipt of adjuvant RT with an interaction term between EOR and MG. (f-i) KM survival curve showing OS of meningiomas based on EOR (GTR vs STR) in each MG: Immunogenic (f), NF2-wildtype (g), Hypermetabolic (h), 4: Proliferative (i). j. Results of multivariable Cox regression analysis on the effect of EOR on OS while controlling for age, sex, WHO grade, primary/recurrent tumor status, and receipt of adjuvant RT with an interaction term between EOR and MG. Box size for the forest plots in (e) and (j) are relative to the weight of the effect size with its center representing the HR and the horizontal error bars representing the 95% CI.
Extended Data Fig. 4
Extended Data Fig. 4. Univariable and multivariable analyses of PFS and OS across molecular classifications and prognostic systems.
(a, i) Univariable Cox proportional hazards model of PFS (a) and OS (i) in the complete retrospective cohort of meningiomas. (b-h) Multivariable Cox proportional hazards models of PFS before PSM with meningiomas classified in the following different molecular strata: MG (b), DKFZ Methylation Subclass (c), UCSF MethG (d), Baylor MenG (e), Integrated Grade (f), Morphomolecular Risk (g), and Gene Expression Risk (h). (j-p) Multivariable Cox proportional hazards models of OS before PSM with meningiomas classified in the following different molecular strata: MG (j), DKFZ Methylation Subclass (k), UCSF MethG (l), Baylor MenG (m), Integrated Grade (n), Morphomolecular Risk (o), and Gene Expression Risk (p). Horizontal error bars in the forest plots of represent the 95% confidence interval of the hazard ratios for each of the covariates included in the Cox regression models presented. P-values for each covariate in the multivariable Cox regression were derived from the Wald test (two-tailed) without adjustments for multiple comparisons.
Extended Data Fig. 5
Extended Data Fig. 5. PSM analyses using other molecular classifications and integrated molecular prognostic systems.
(a-x) From left to right: love plot, KM survival curve, and results of multivariable Cox regression analyses after PSM for GTR vs STR, Simpson grades 1/2 vs 3, Simpson grade 1 vs 2, and RT vs observation using the DKFZ methylation subclasses (a-d), UCSF MethG (i-l), Baylor MenG (q-t), Integrated Grade (e-h), Morphomolecular Risk (m-p), and Gene Expression Risk (u-x). Horizontal error bars in the forest plots of represent the 95% confidence interval of the hazard ratios for each of the covariates included in the multivariable Cox regression models presented. P-values for each covariate in the multivariable Cox regression were derived from the Wald test (two-tailed) without adjustments for multiple comparisons.
Extended Data Fig. 6
Extended Data Fig. 6. Prognostic role of Simpson Grade resection across Molecular Groups.
a. PFS in each Molecular Group (MG) based on grouping meningiomas that received a Simpson grade 1 or 2 resection together vs those that received a Simpson grade 3 resection. b. PFS in each Molecular Group for meningiomas that received a Simpson grade 1 resection vs a Simpson grade 2 resection. (c-d) Results from the multivariable Cox proportional hazards model showing the effect of Simpson grade on PFS when controlling for age, sex, WHO grade, receipt of adjuvant RT, and tumor location with an interaction term between Simpson Grade and Molecular Group. Box size for the forest plots in (c) is relative to the weight of the effect size with its center representing the HR and horizontal error bars representing the 95% confidence interval of the hazard ratios for each of the covariates included in the multivariable Cox regression models presented.
Extended Data Fig. 7
Extended Data Fig. 7. RTOG-0539 trained DNA methylation model of RT response and molecular nomogram.
a. Representative screenshot of DNA methylation .idat files uploaded for 2 separate samples and their respective probabilistic risk of recurrence within 3 years of surgery and adjuvant RT on the publicly available RTOG DNA methylation predictor site. b. representative magnetic resonance images of the same sample cases uploaded to the predictor in panel (a) with one RT-resistant case demonstrating recurrence within 3 years of clinical follow-up after gross total resection and adjuvant radiotherapy (above), and a different case in another patient (below) demonstrating interval stability after 3-years following similarly gross total resection and adjuvant RT. (c-d). RT-specific PFS outcomes of meningiomas within each WHO grade of the first (c) and second (d) retrospective validation cohorts stratified into an RT-resistant and RT-responsive group based on the predicted DNA-methylation based RT risk score. P-values generated from Log-rank test. e. Molecular nomogram built using the DNA methylation based RT predictor, WHO grade, EOR, and RT dose to predict PFS post-surgery and adjuvant RT using the RTOG-0539 cohort as the training cohort. Each variable in the nomogram is scaled accordingly and values/scores for each variable are assigned points which cumulatively add up to estimate a probabilistic risk of recurrence within 3-years of treatment. f. clinical nomogram built using the same variables and training cohort as in (e) except without DNA methylation risk score. g. AUC and 95% CI demonstrating the predictive accuracy of the molecular and clinical nomogram respectively validated in the same retrospective cohort of RT-treated meningiomas (N=276).

References

    1. Ostrom, Q. T. et al. CBTRUS statistical report: primary brain and other central nervous system tumors diagnosed in the United States in 2015–2019. Neuro Oncol.24, v1–v95 (2022). - PMC - PubMed
    1. Vernooij, M. W. et al. Incidental findings on brain MRI in the general population. N. Engl. J. Med.357, 1821–1828 (2007). - PubMed
    1. Simpson, D. The recurrence of intracranial meningiomas after surgical treatment. J. Neurol. Neurosurg. Psychiatry20, 22 (1957). - PMC - PubMed
    1. Gallagher, M. J., Jenkinson, M. D., Brodbelt, A. R., Mills, S. J. & Chavredakis, E. WHO grade 1 meningioma recurrence: are location and Simpson grade still relevant? Clin. Neurol. Neurosurg.141, 117–121 (2016). - PubMed
    1. Gousias, K., Schramm, J. & Simon, M. The Simpson grading revisited: aggressive surgery and its place in modern meningioma management. J. Neurosurg.125, 551–560 (2016). - PubMed

Substances